Hello
I have download PRT on desktop to preview it, and I am now considering a monthly subscription.
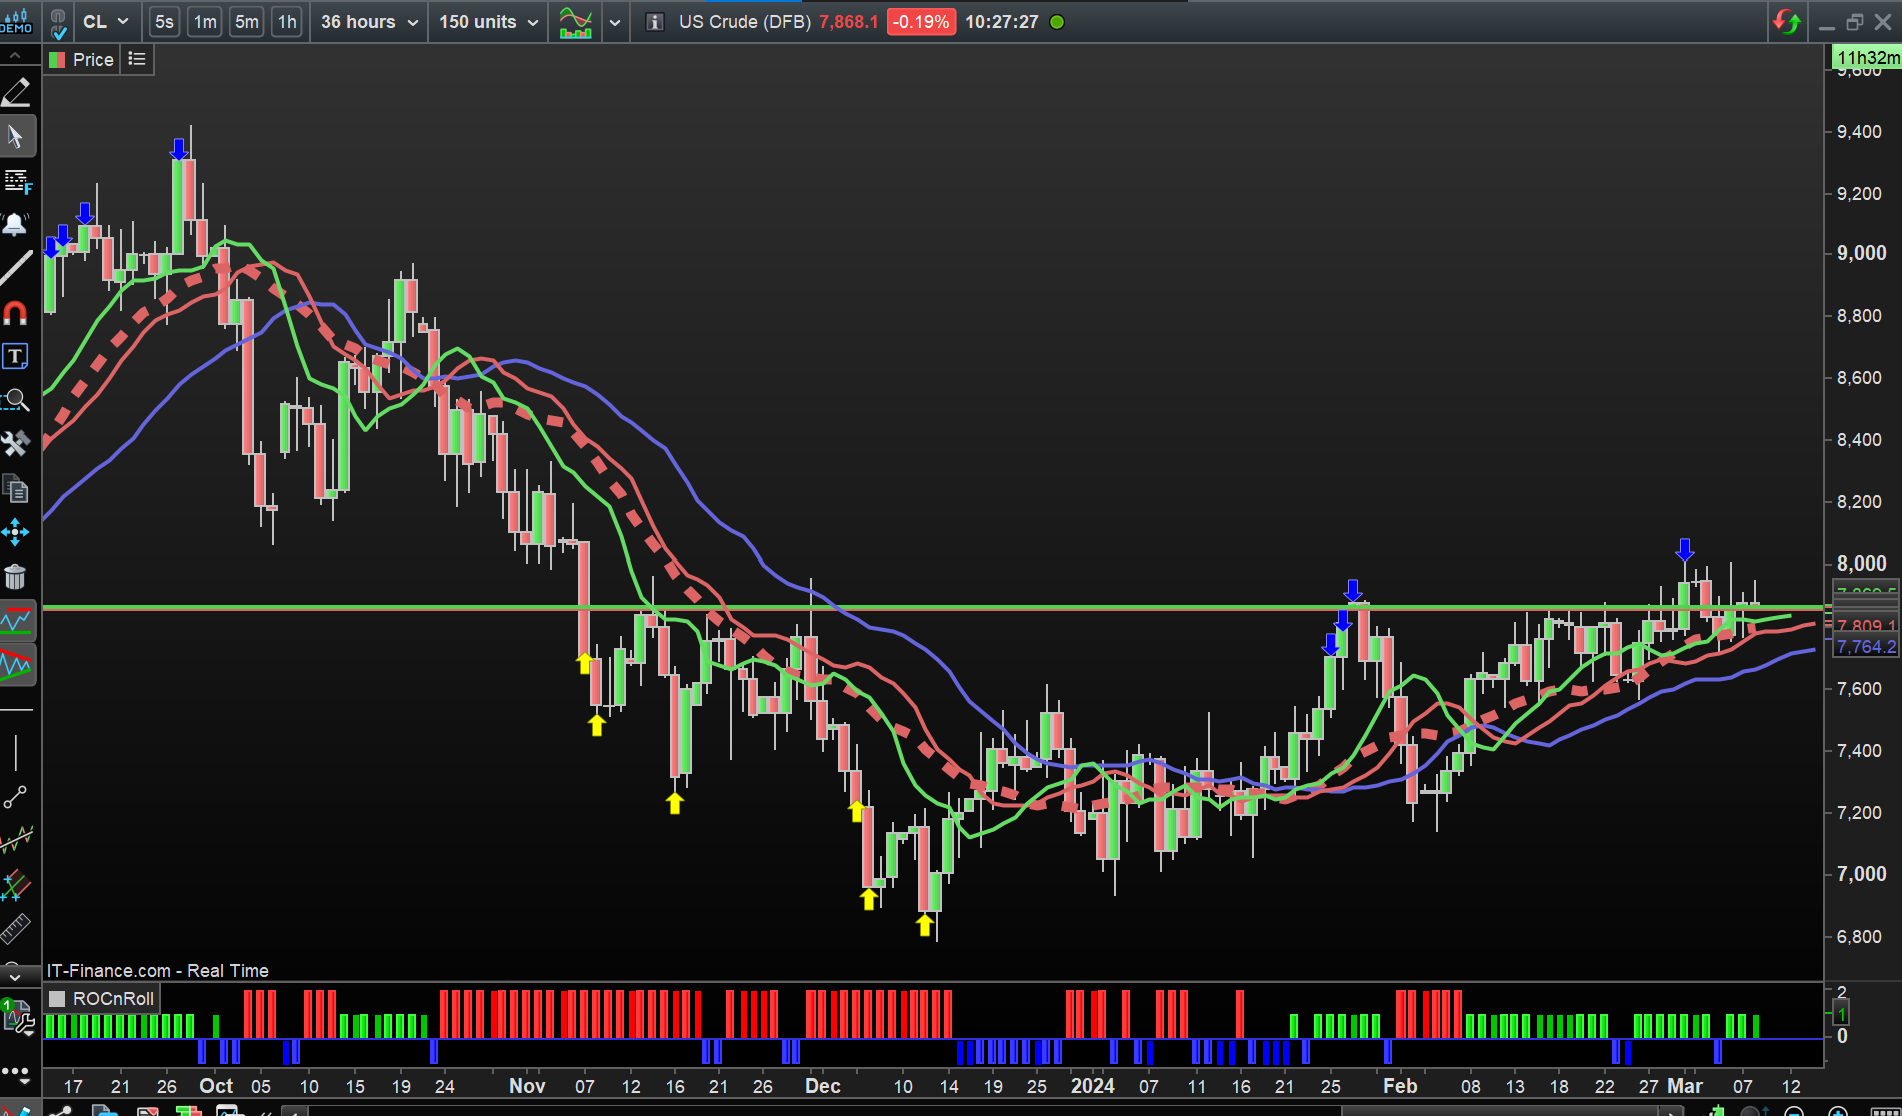
I am trying to look at a 36-Hour chart, but I can’t preview this without a membership. I want to see if this is suitable for me, before purchasing it. Would someone please be able to show me a 36 hour chart, for example on Crude Oil? Just so I can see how this looks first.
(I am coming from T.V. platform, but they don’t allow creation of 36 hour timeframe, so wanted to see PRTs.)
P.S. Would getting a subscription allow me to use this timeframe on the Web platform too?
Would someone please be able to show me a 36 hour chart, for example on Crude Oil? Just so I can see how this looks first.
Meant to say ‘A simple screenshot will do’ 😊
US Crude or Brent Crude and over how many bars do you want to see the Chart?
US Crude or Brent Crude and over how many bars do you want to see the Chart?
Thank you for your time. I greatly appreciate this.
US Crude, 150 bars?
Many thanks once again.
Am I wrong in thinking this ❓:
It looks like PRT doesn’t actually show the 36-Hour chart? It shows the standard Daily (24-Hour) chart? If we switch and compare, there isn’t any difference?
 JS
JSParticipant
Veteran
Hi Maria,
Your post raises a few questions:
When you use time frame, do you really mean “the time between opening and closing of 1 bar/candle”?
For example, 36-hour time frame: each bar/candle represents 36 hours of price data.
(It seems very strange to me when you can’t use these “custom timeframes” in TV)
Something else is the number of bars/candles you want to use in your chart, suppose you want to see a graph over a period of a year with a time frame of 36 hours…
You then set the number of bars to around 135 bars (135×36 = 4860 hours = 1 trading year) with a time frame of 36 hours.
Hi JS
Yes – exactly. Each bar should represent 36 hours of price data. Just like a bar on a 4-Hour chart would represent 4 hours of price data.
Yes, even with my premium TV sub, it’s not possible to add 36 hour custom timeframe. (I have asked their support over the years, but they just take it as a suggestion/feedback.) I haven’t found a platform that offers this.
To the second part: I am not too fussed about the number of bars/historical data I can see in the chart. I can simply scroll back and forth across whatever historical data I have access to with the platform.) Right now I’m interested only in each bar representing 36 hours of price data.
It shows the standard Daily (24-Hour) chart?
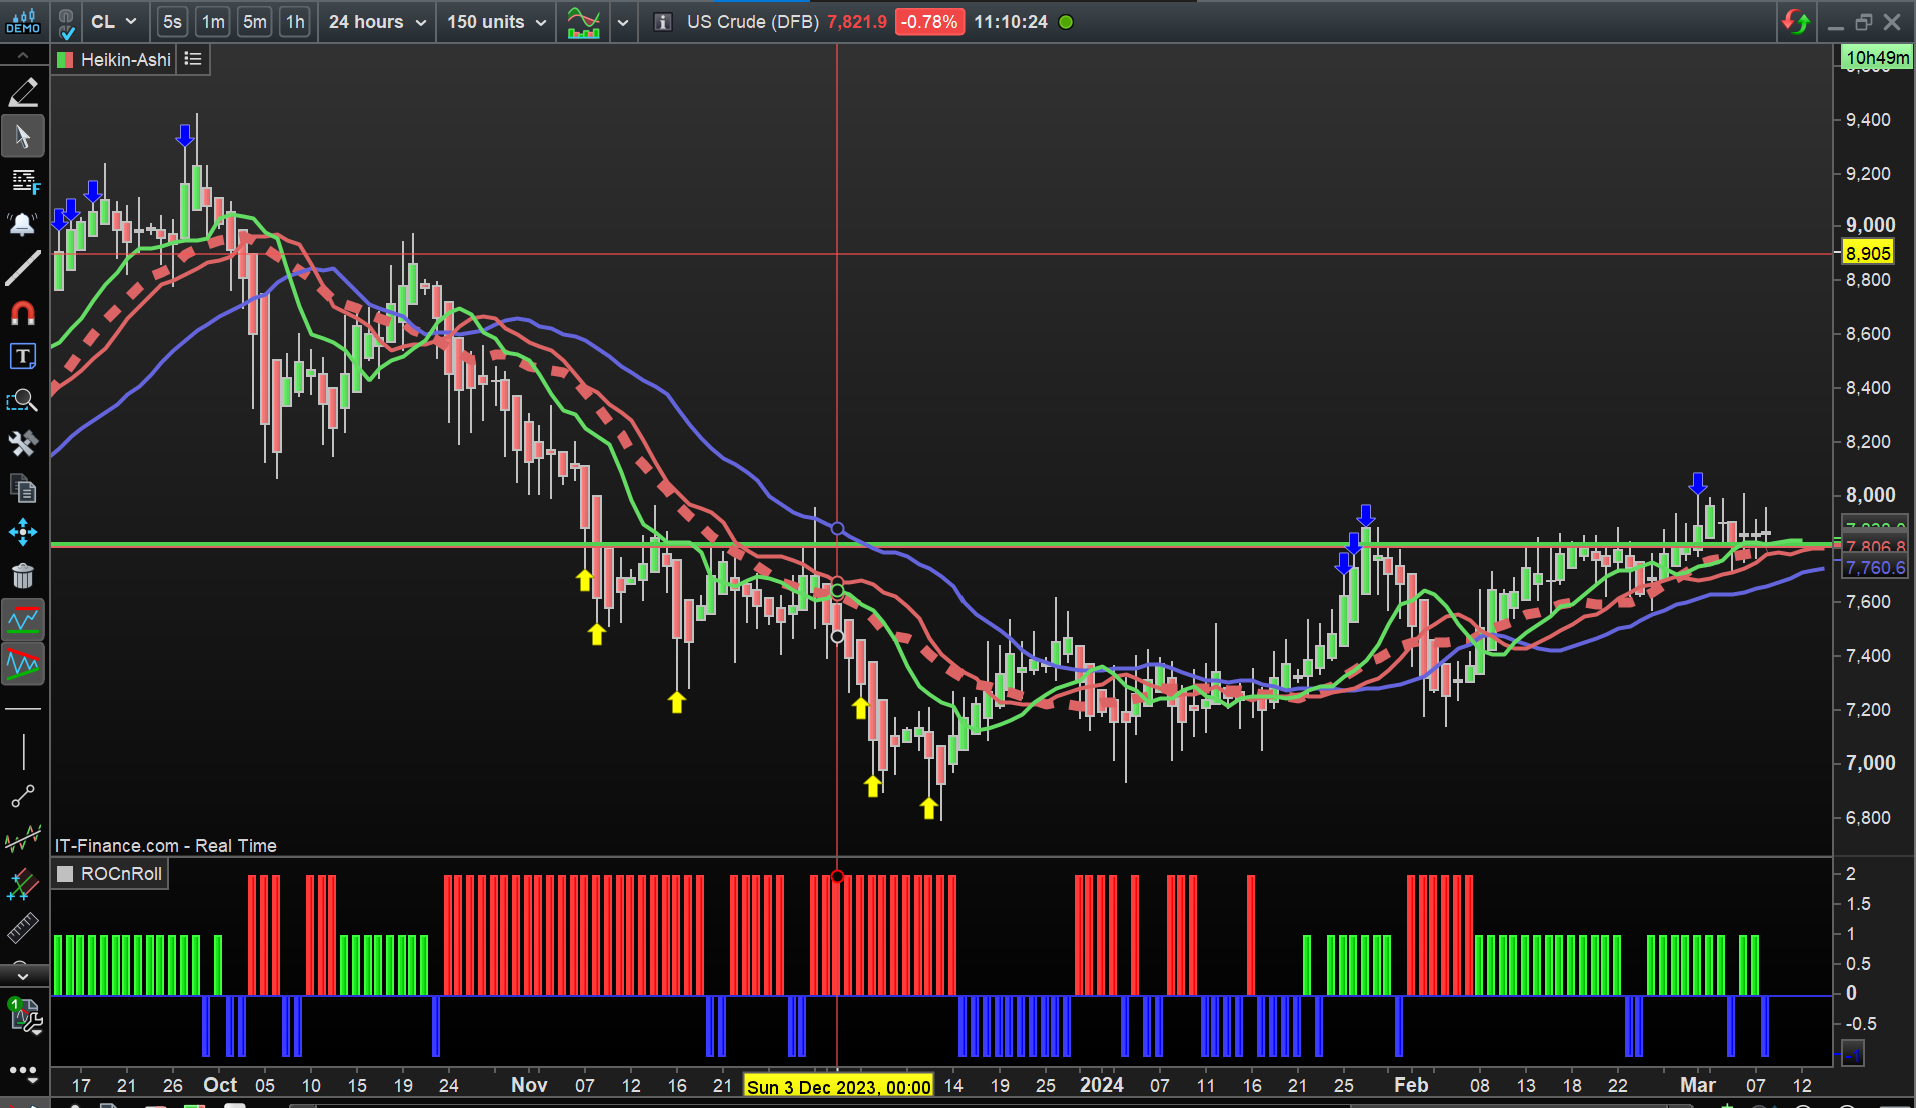
Seems you are right as the chart never changed as I switched from 36 hour to 24 hour Chart.
Attached is the 24 hour Chart.
JSParticipant
Veteran
Hi Maria,
You are absolutely right, there appears to be no difference between, for example, a time frame of 36 hours, 24 hours and a day, it is all displayed in the same way.
chart never changed
Wrong GraHal, it seemed that way, but now checking the 2 attachments I posted … there are clear differences!
Above is wrong and I was ‘right first time’ … in between the 2 Charts I posted, I had switched from VolWeighted to HeikenAshi Candles. 🙂
Thanks guys. 36-hour timeframe is a toughy for platforms for some reason 😅
18, 13, 7, etc. is all fine, but looks like anything over 24 hours can’t be done. (Same with TV.)
(I tried in minutes on TV too: 2160 minutes is 36 hours. No luck.)
JSParticipant
Veteran
So, you can set some time frames in PRT (and in TV) but then there is no difference with other time frames… (as in the example of Maria)
@Nicolas perhaps an explanation can be given on this…