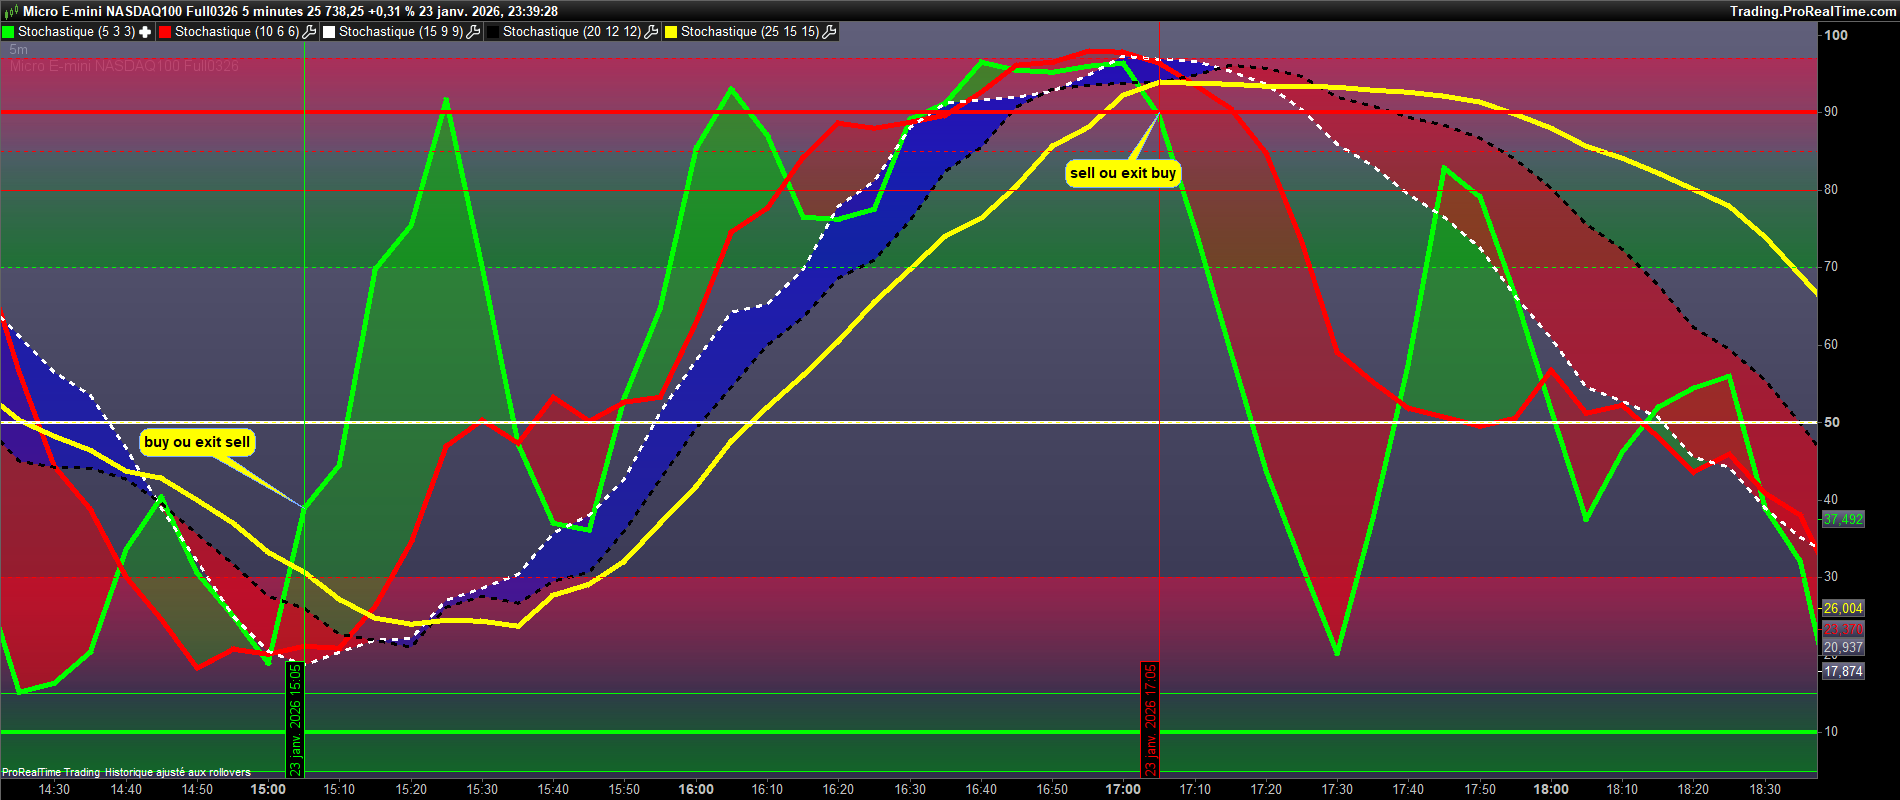
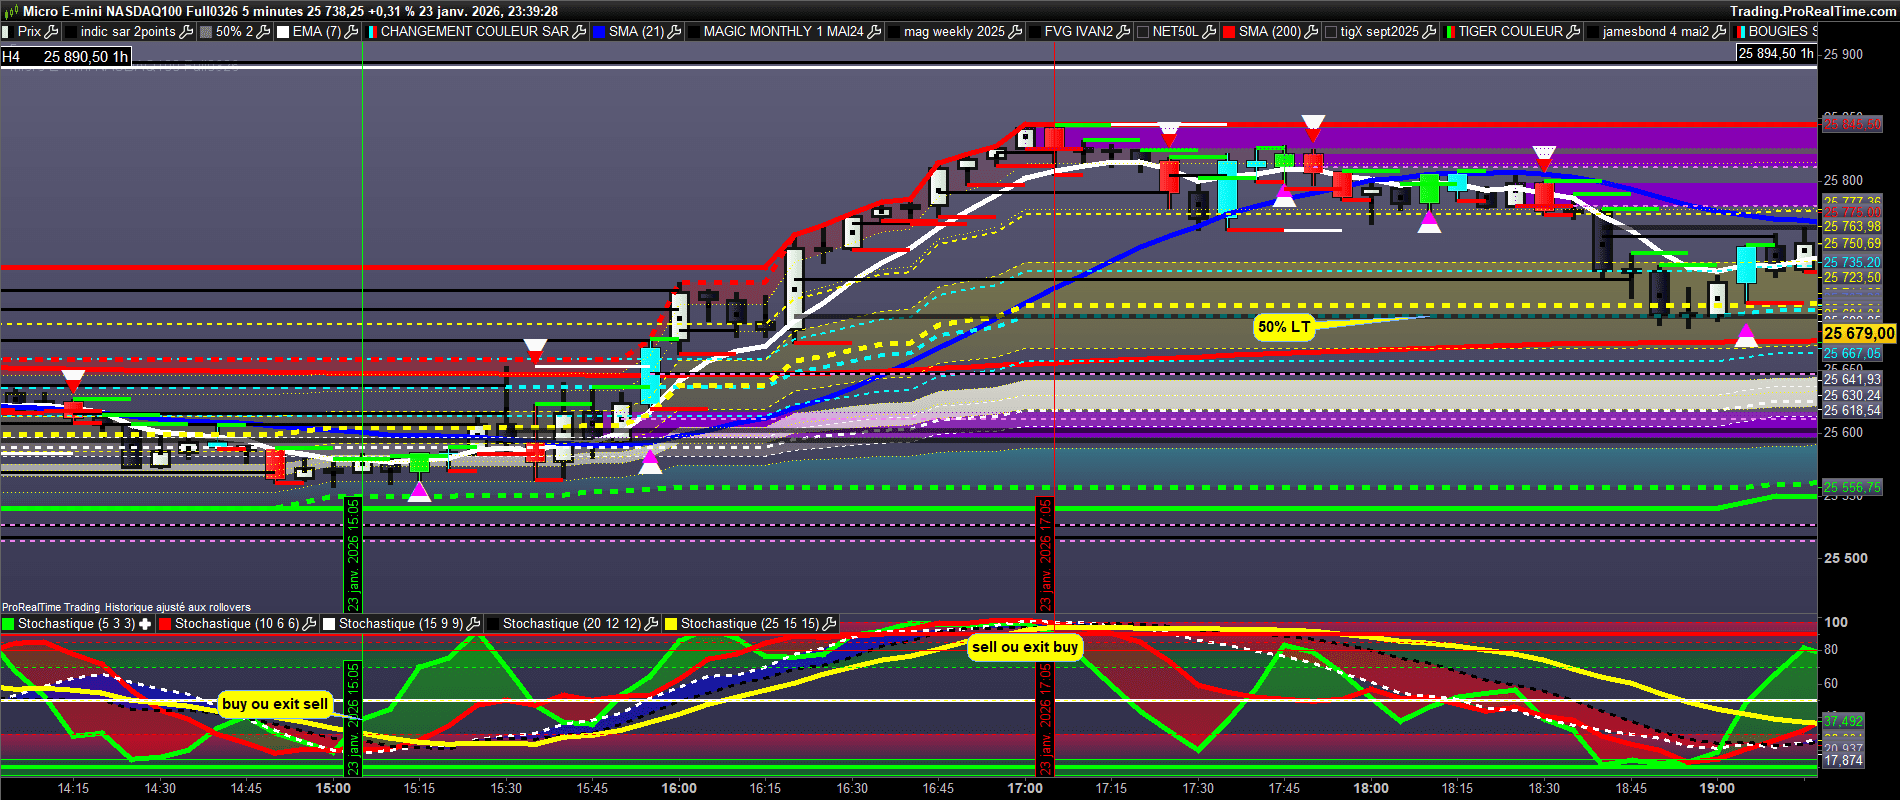
créer une fleche sur le graphe au breakout + de stochastique

Viewing 6 posts - 1 through 6 (of 6 total)
  • Author
    Posts
  • #256874 quote
    geronimangeroniman
    Participant
    Average

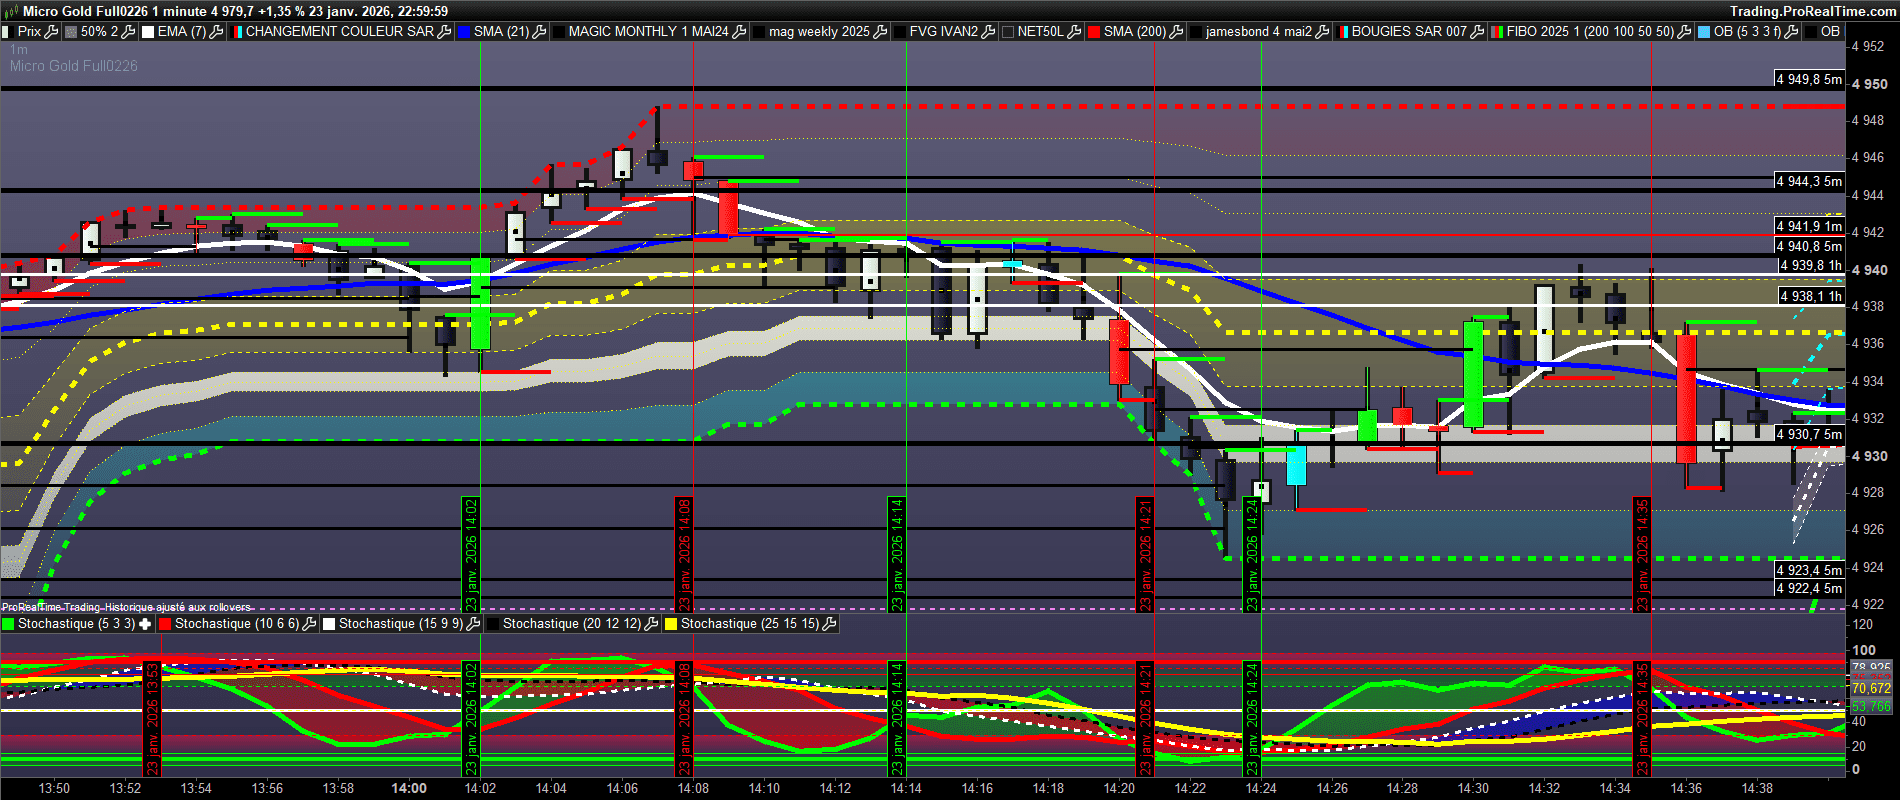
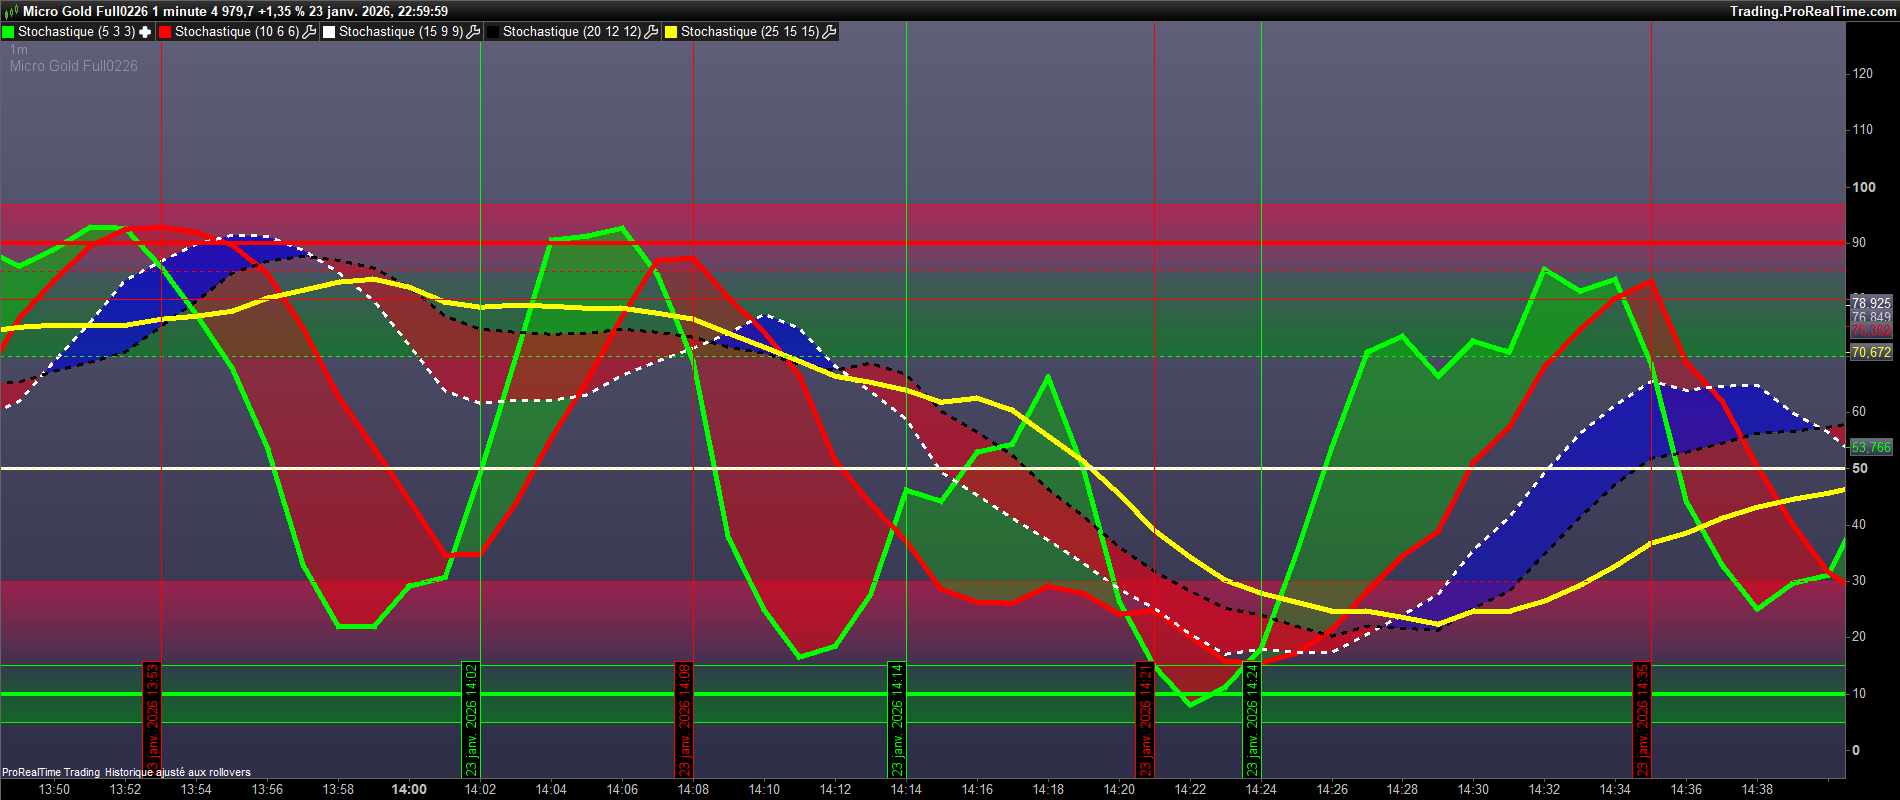
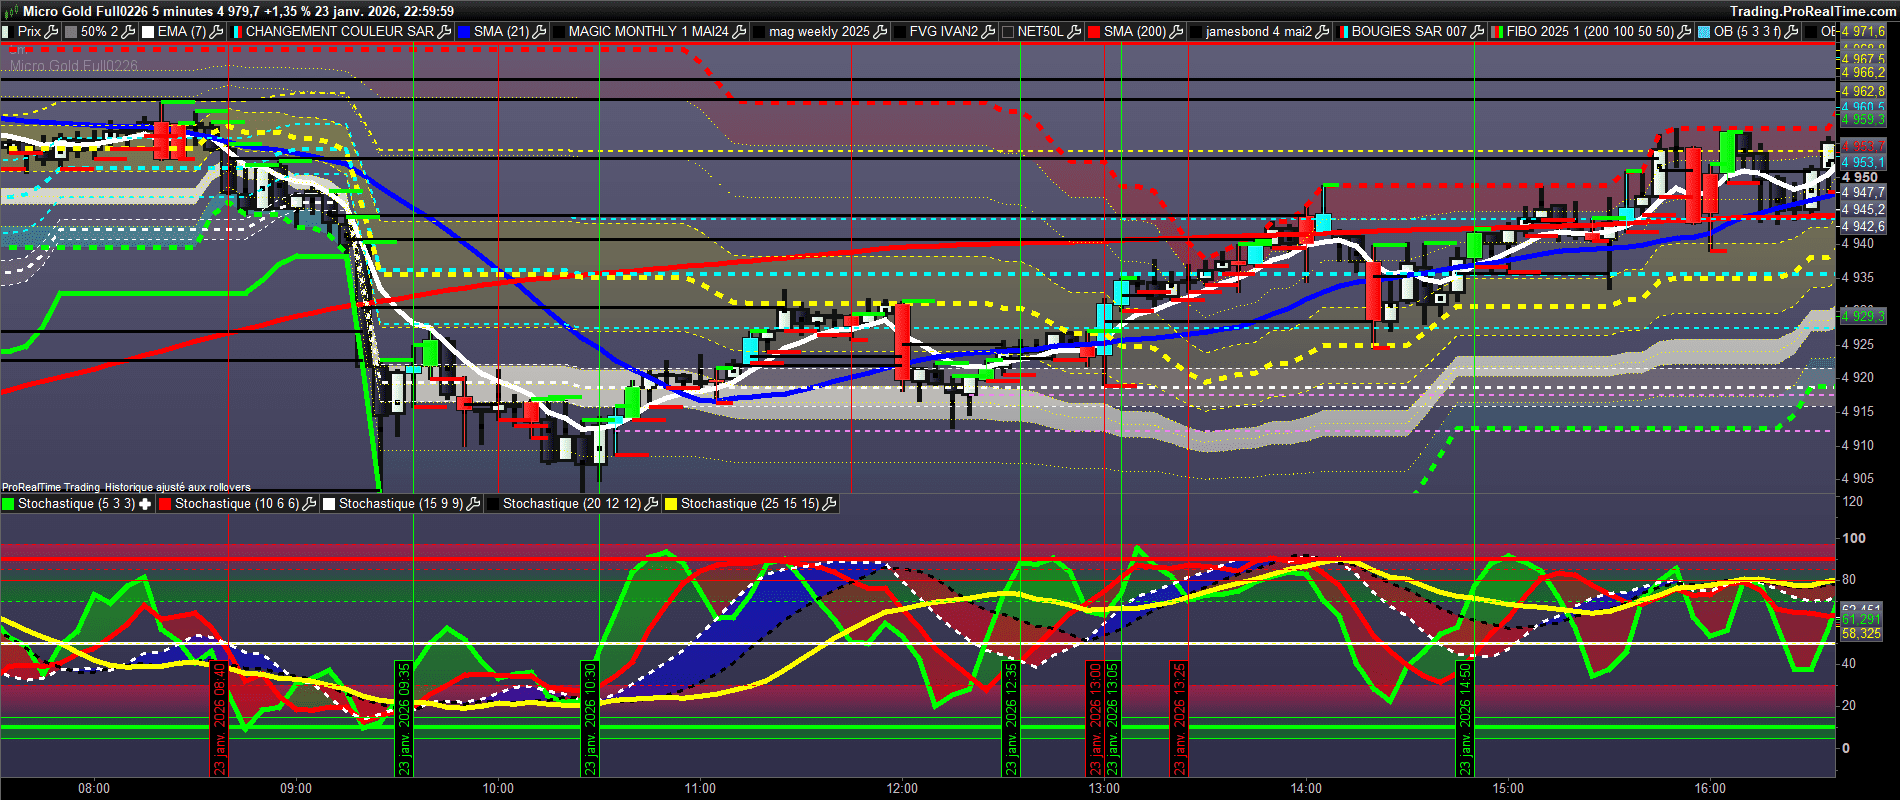
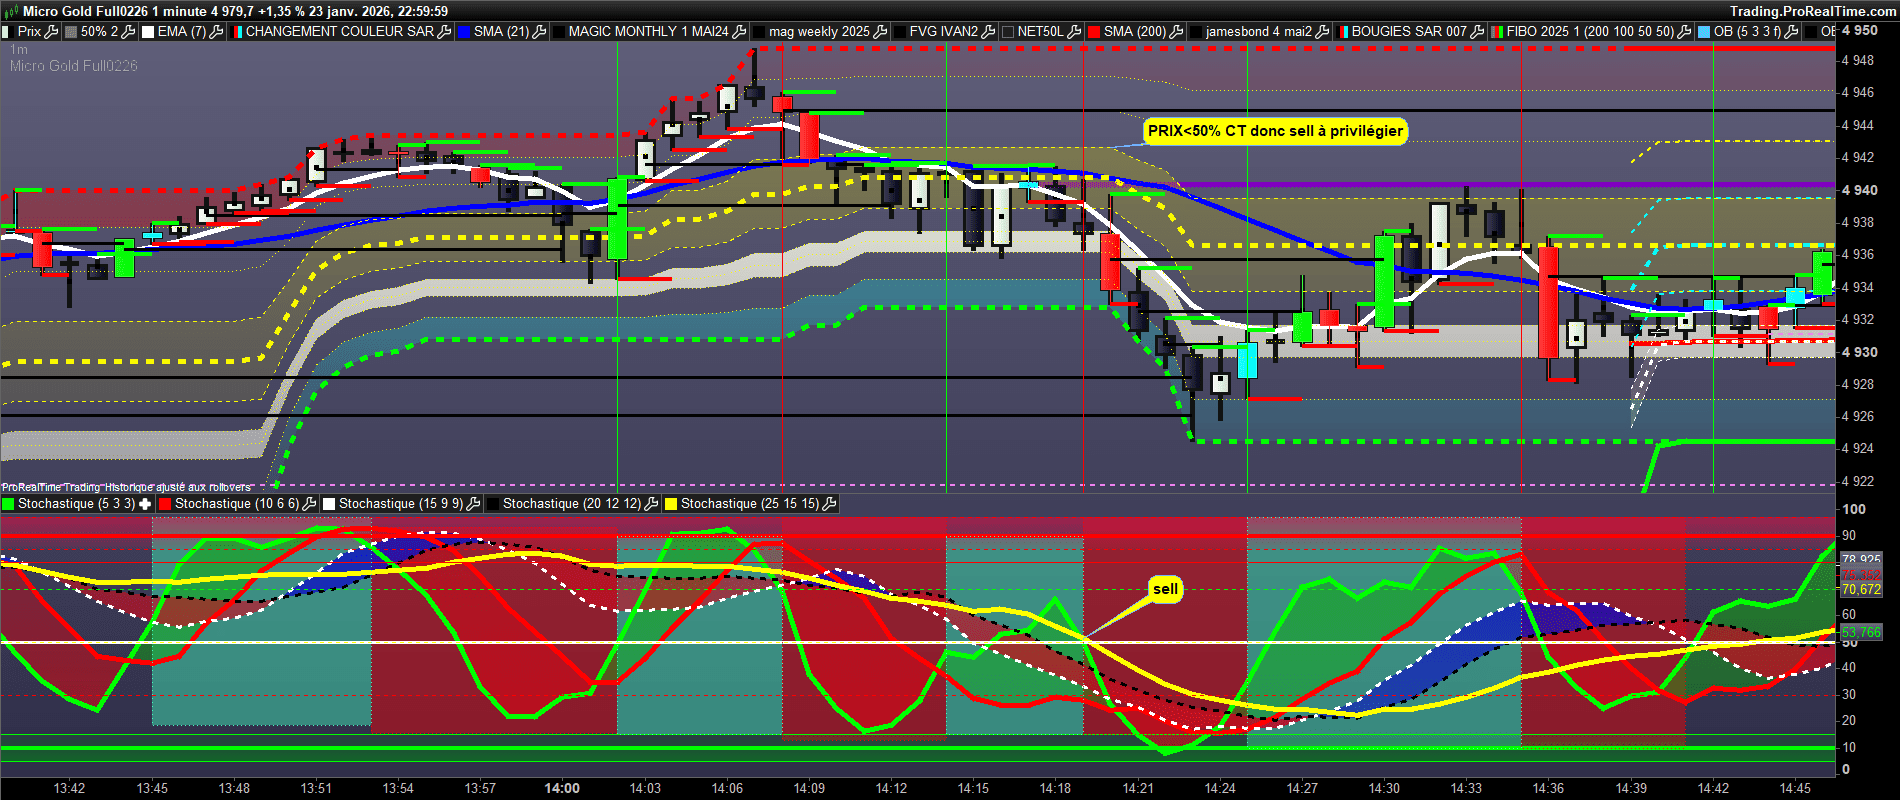
    l idée est de créer une fleche BUY sur le breakout de la stoch 5.3.3 sur la stoch 25.15.15 et de SELL sur el breakout – à l inverse. Pour optimiser la lecture de créer en meme temps une ligne vertcale verte ou rouge sur le graphe des stochs comme indiqué sur les graphes suivants ( exemple en m5) .Merci bien.

    23JAN-M5-1.png 23JAN-M5-1.png 23JAN-M5-2.png 23JAN-M5-2.png
    #256878 quote
    geronimangeroniman
    Participant
    Average

    Exemple de scalping du Gold en M1 et M5

    GC-23JAN-M1-1.png GC-23JAN-M1-1.png GC-23JAN-M1-2.png GC-23JAN-M1-2.png GC-23JAN-M5-1.png GC-23JAN-M5-1.png
    #256881 quote
    jacquesgermainjacquesgermain
    Participant
    Veteran

    Hello voici :

    //====================================================================

    // Stoch Fast (5,3) vs Stoch Slow (25,15) – Crossover Breakout

    // Flèches + Lignes verticales dans le panneau Stoch

    //====================================================================


    DEFPARAM drawonlastbaronly = false


    //—————————————————-

    // Paramètres

    //—————————————————-

    periodKfast = 5

    smoothKfast = 3


    periodKslow = 25

    smoothKslow = 15


    //—————————————————-

    // Calculs Stoch (syntaxe moderne PRT)

    //—————————————————-

    Kfast = Stochastic[periodKfast, smoothKfast](close)  // Fast %K (5,3)

    Kslow = Stochastic[periodKslow, smoothKslow](close)  // Slow %K (25,15)


    //—————————————————-

    // Signaux

    //—————————————————-

    buySignal = Kfast CROSSES OVER Kslow

    sellSignal = Kfast CROSSES UNDER Kslow


    //—————————————————-

    // Flèches + texte sur le graphique principal

    //—————————————————-

    IF buySignal THEN

    DRAWARROWUP(barindex, low*0.995) COLOURED(0,255,0)

    ENDIF


    IF sellSignal THEN

    DRAWARROWDOWN(barindex, high*1.005) COLOURED(255,0,0)

    ENDIF


    //—————————————————-

    // Lignes verticales dans le sous-graphique Stoch

    //—————————————————-

    IF buySignal THEN

    DRAWVLINE(barindex) COLOURED(120,255,120)

    ENDIF


    IF sellSignal THEN

    DRAWVLINE(barindex) COLOURED(255,120,120)

    ENDIF


    RETURN


    #256885 quote
    geronimangeroniman
    Participant
    Average

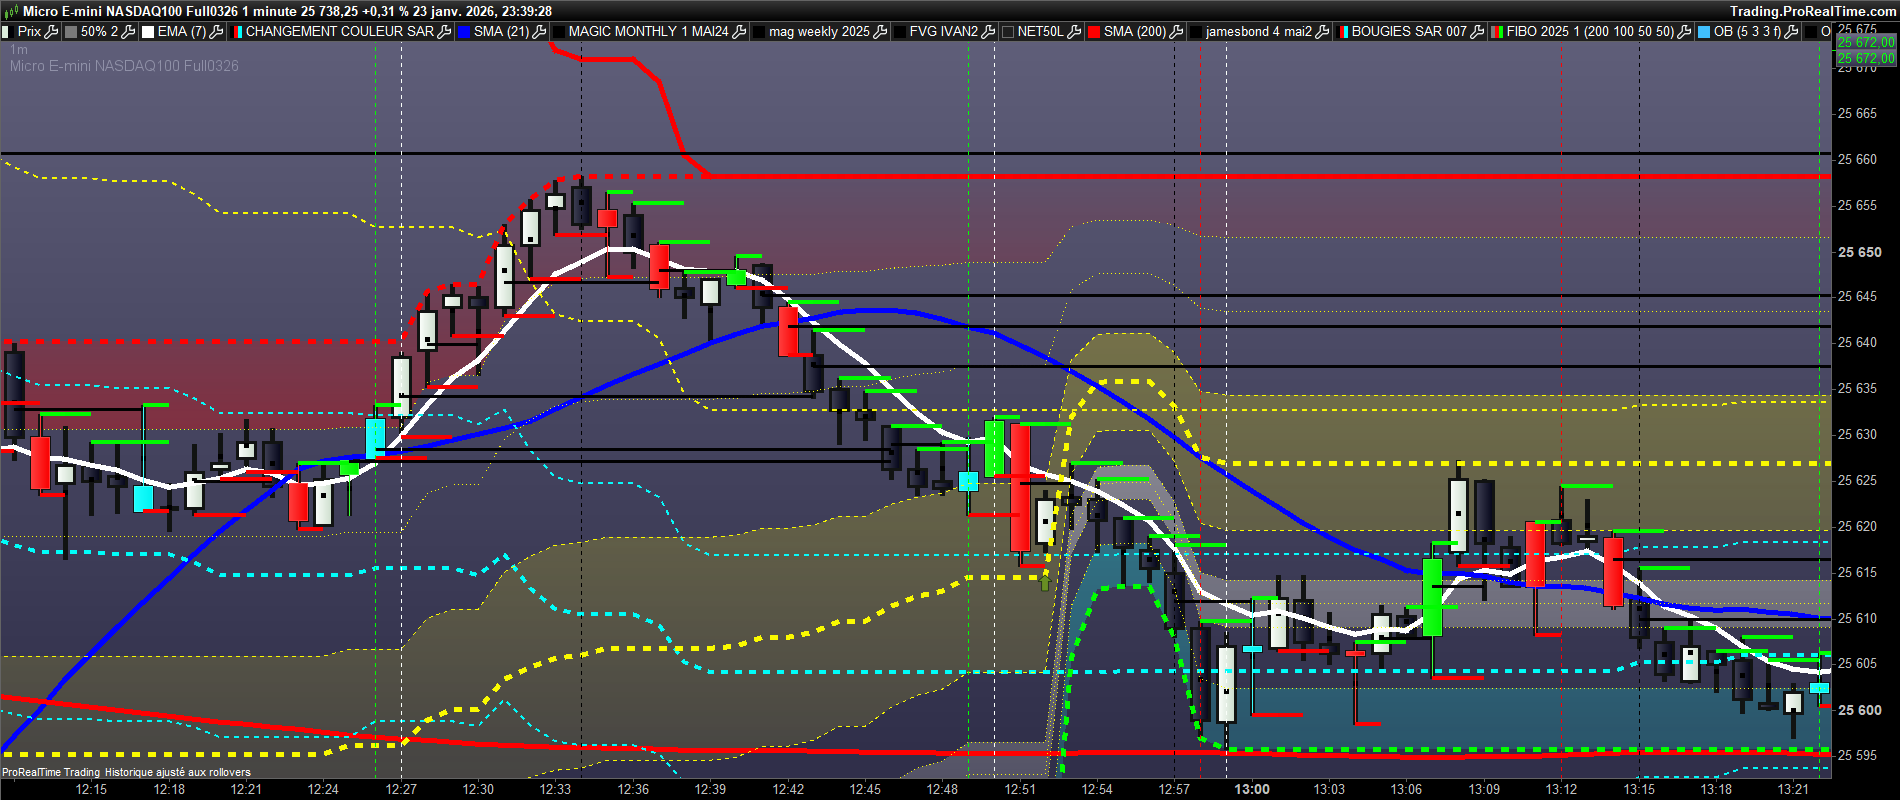
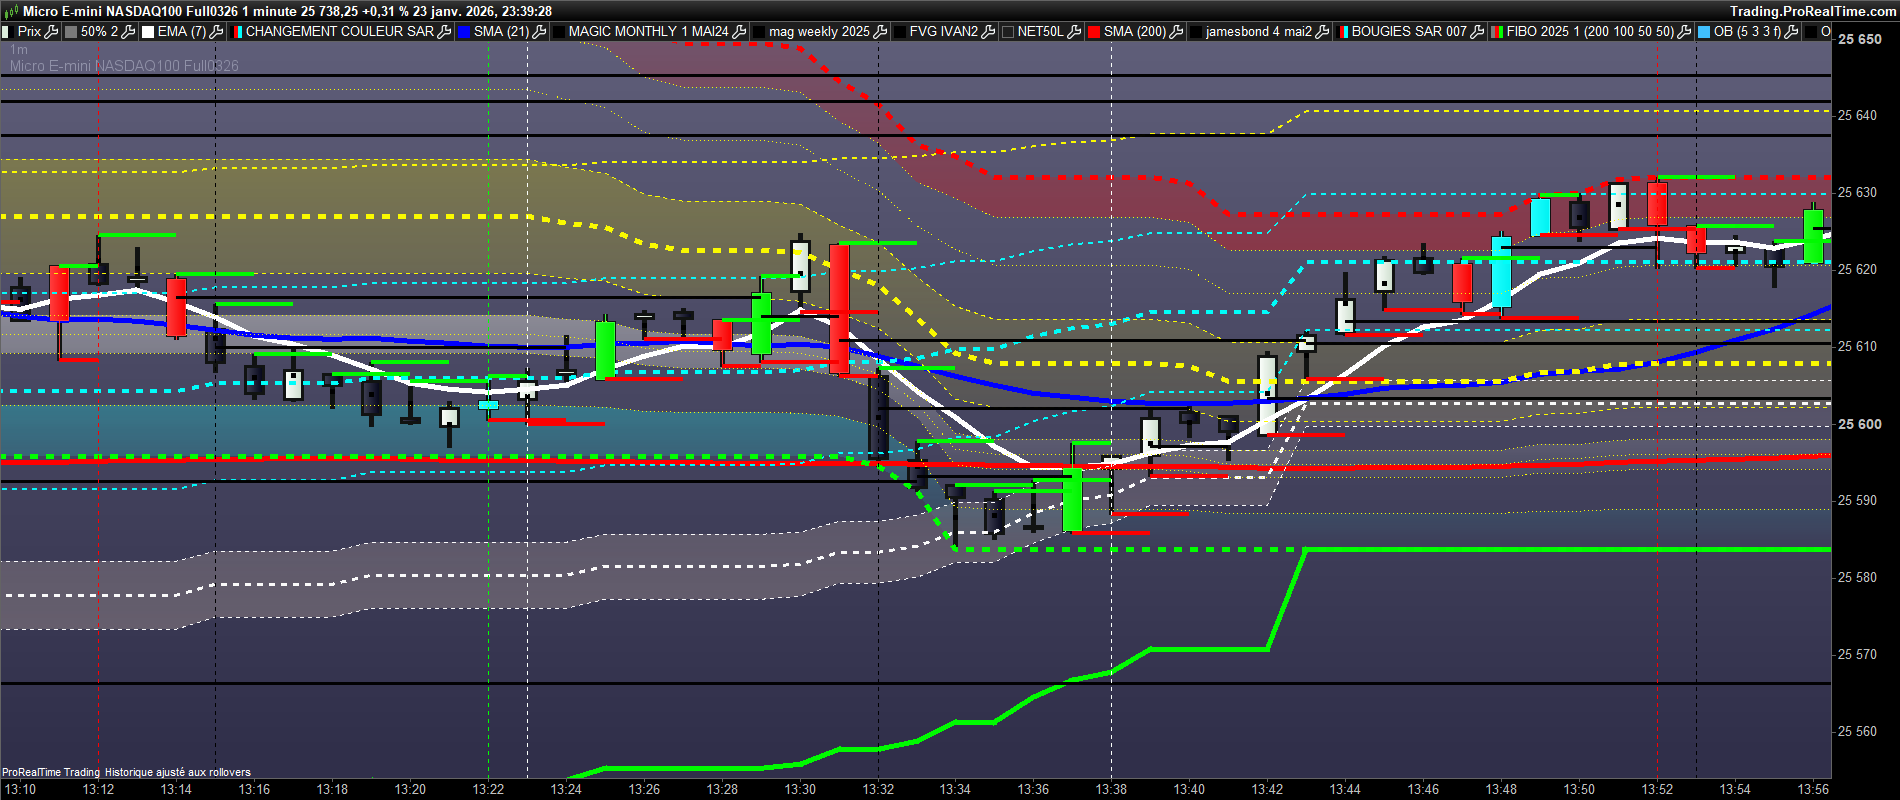
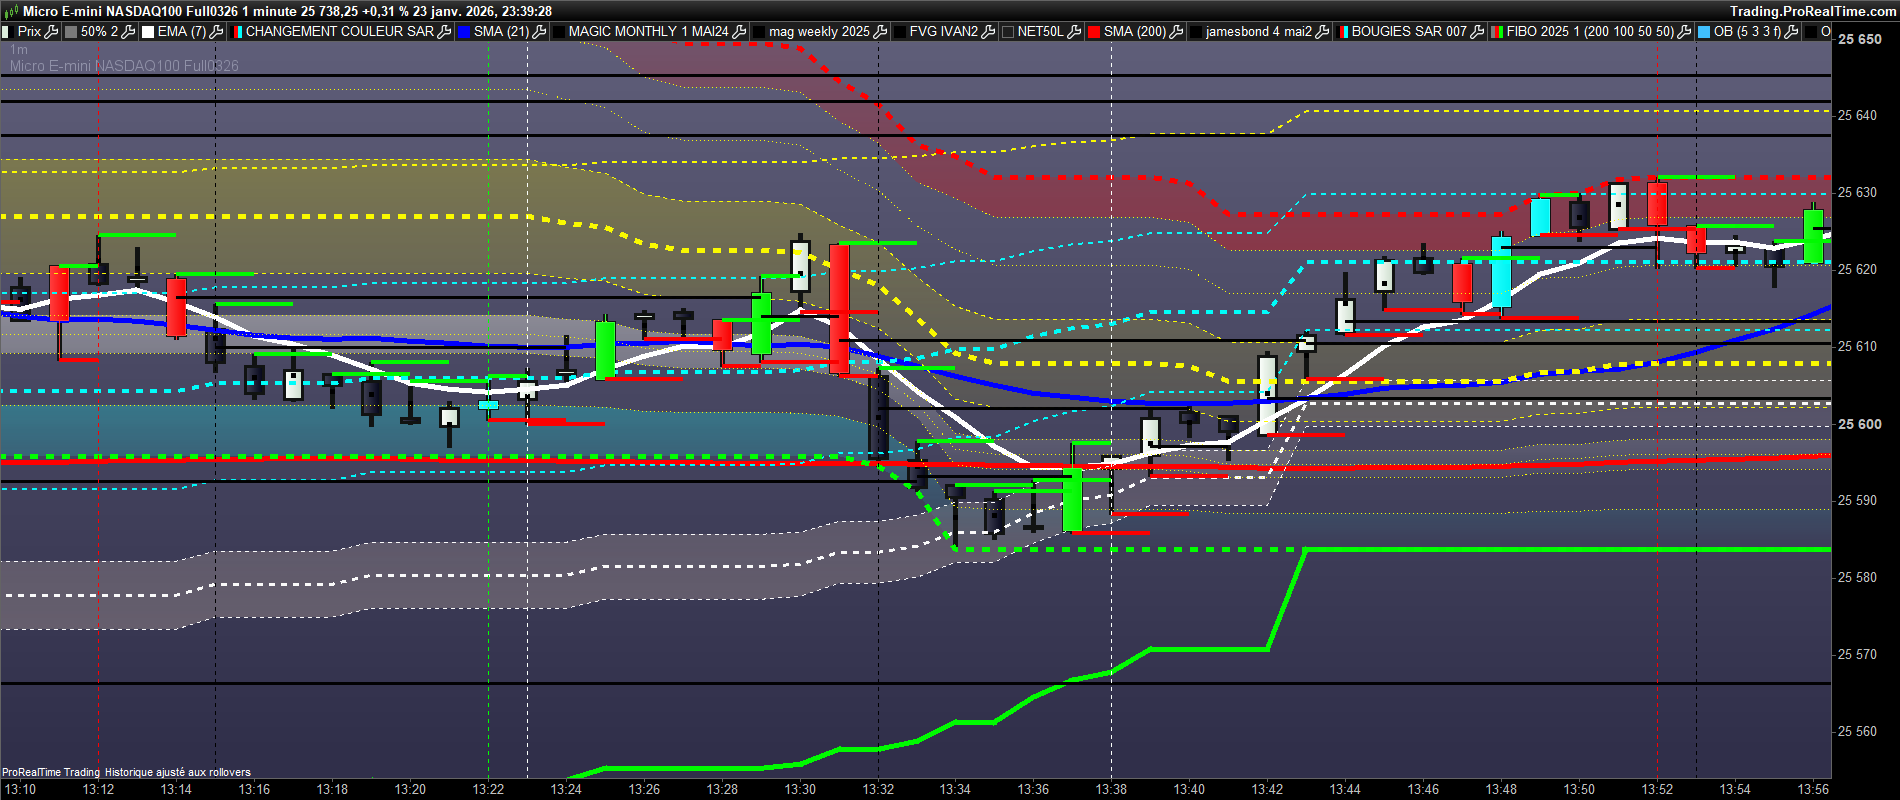
    super merci bien Jacques. Cela permet de confirmer des signaux James bond ( les traits vert et rouge: itf SAR 007) , de renforcer les trades. en hachuré vert et rouge , breakout stoch 5.3 x 15.9 et en blanc/noir le breakout sto 5.3 x 25.15

    mnq-23jan-m1.png mnq-23jan-m1.png mnq-23jan-m1-2.png mnq-23jan-m1-2.png GC-23JAN-M1-4.png GC-23JAN-M1-4.png
    #256889 quote
    geronimangeroniman
    Participant
    Average

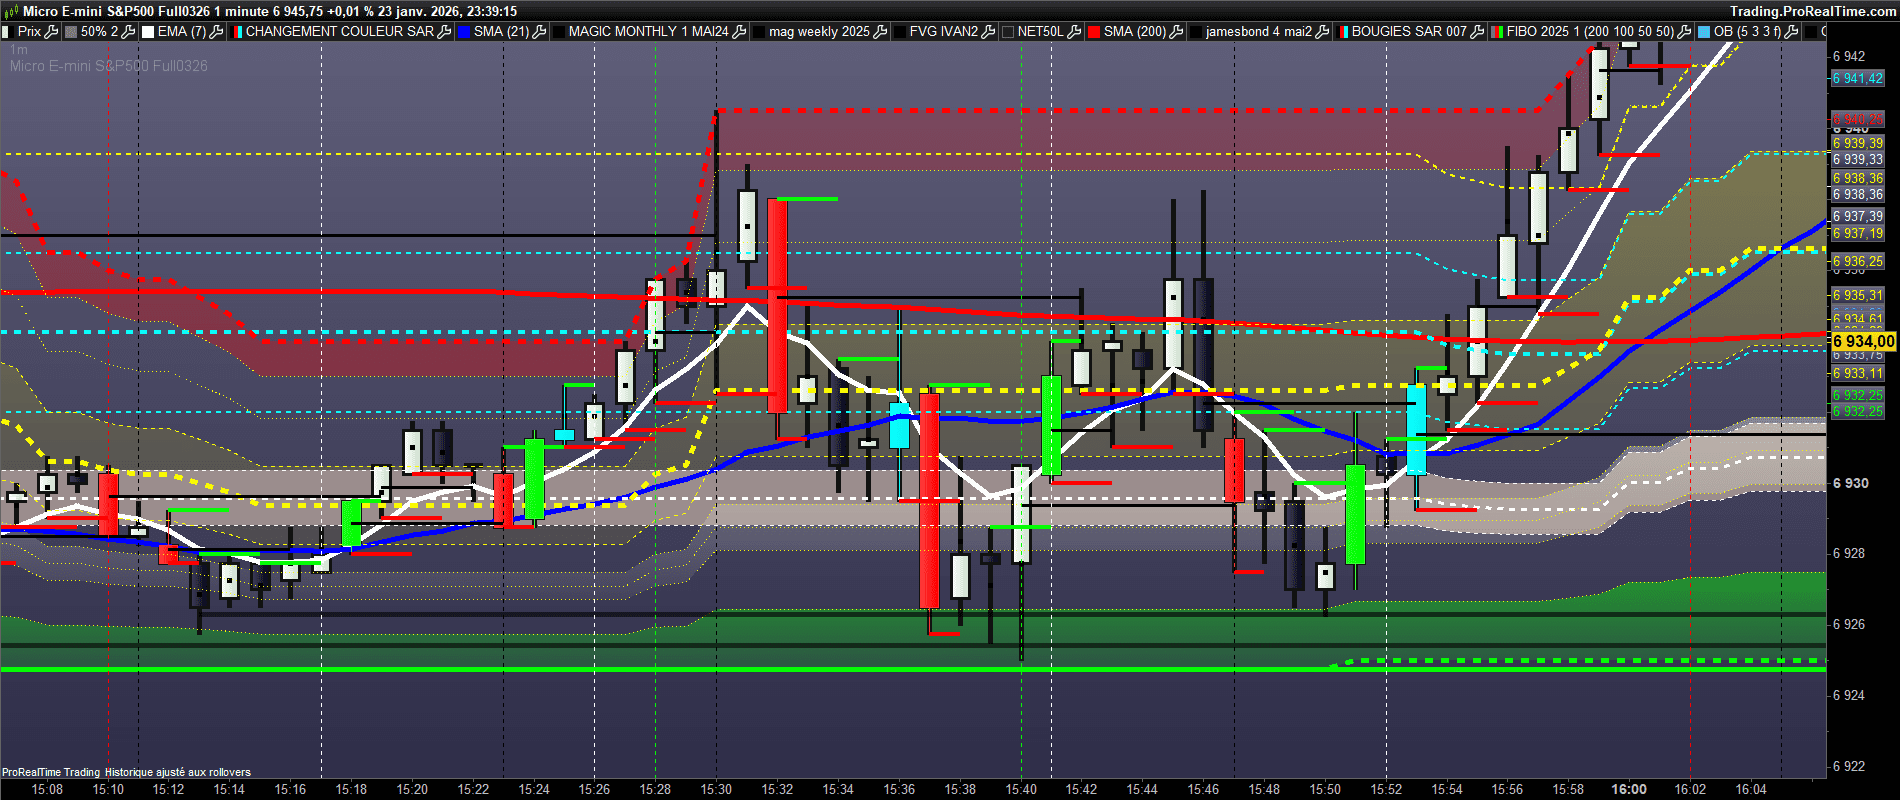
    les signaux stoch sont les suivants:

    1- BUY ou SL SELL> plus haut bougie avec trait blanc hachuré si prix>ema7 ( trait plein blanc) SELL ou SL BUY < plus bas si prix<ema7

    2- BUY>plus haut bougie avec trait vert hachuré et SELL ou SL< plus bas de cette bougie.

    3- SELL sous bougie rouge et BUY >bougie verte.

    bandeau vert = 89.3% /plus bas Court terme

    bandeau jaune 38.2/61.8 Court terme

    bandeau blanc OTE Court terme

    et bandeau bleu OTE Range Long terme

    Pas de renfort SELL dans le bandeau vert ( il y a eu forcément un signal SELL plus haut

    pas de renfort BUY dans le bandeau Rouge ( il y a eu un signal BUY plus bas

    mnq-23jan-m1-2-1.png mnq-23jan-m1-2-1.png mes-23jan-m1-1.png mes-23jan-m1-1.png
    #256890 quote
    geronimangeroniman
    Participant
    Average

    les traits noirs sont les 50% de FVG à nettoyer( encore merci Ivan)

Viewing 6 posts - 1 through 6 (of 6 total)
  • You must be logged in to reply to this topic.

ProRealAI ProRealAI New

Stuck on this ProBuilder code?

Describe what this topic is trying to build, in plain English, and ProRealAI writes the ProRealTime™ indicator, screener or system for you.

Available in 7 languages
Try ProRealAI

créer une fleche sur le graphe au breakout + de stochastique


ProBuilder : Indicateurs & Outils Personnalisés

New Reply
Author
author-avatar
geroniman @geroniman Participant
Summary

This topic contains 5 replies,
has 2 voices, and was last updated by geronimangeroniman
7 months, 3 weeks ago.

Topic Details
Forum: ProBuilder : Indicateurs & Outils Personnalisés
Language: French
Started: 01/25/2026
Status: Active
Attachments: 10 files
ProRealCode ProRealCode
Loading...