Bonjour,
J’ai fait une capture d’écran du rendu de ce que j’aimerai arriver à faire. Mais là, je sais pas par où commencer. Je crois que c’est trop compliqué pour moi. Je veux bien des pistes pour débuter le code.
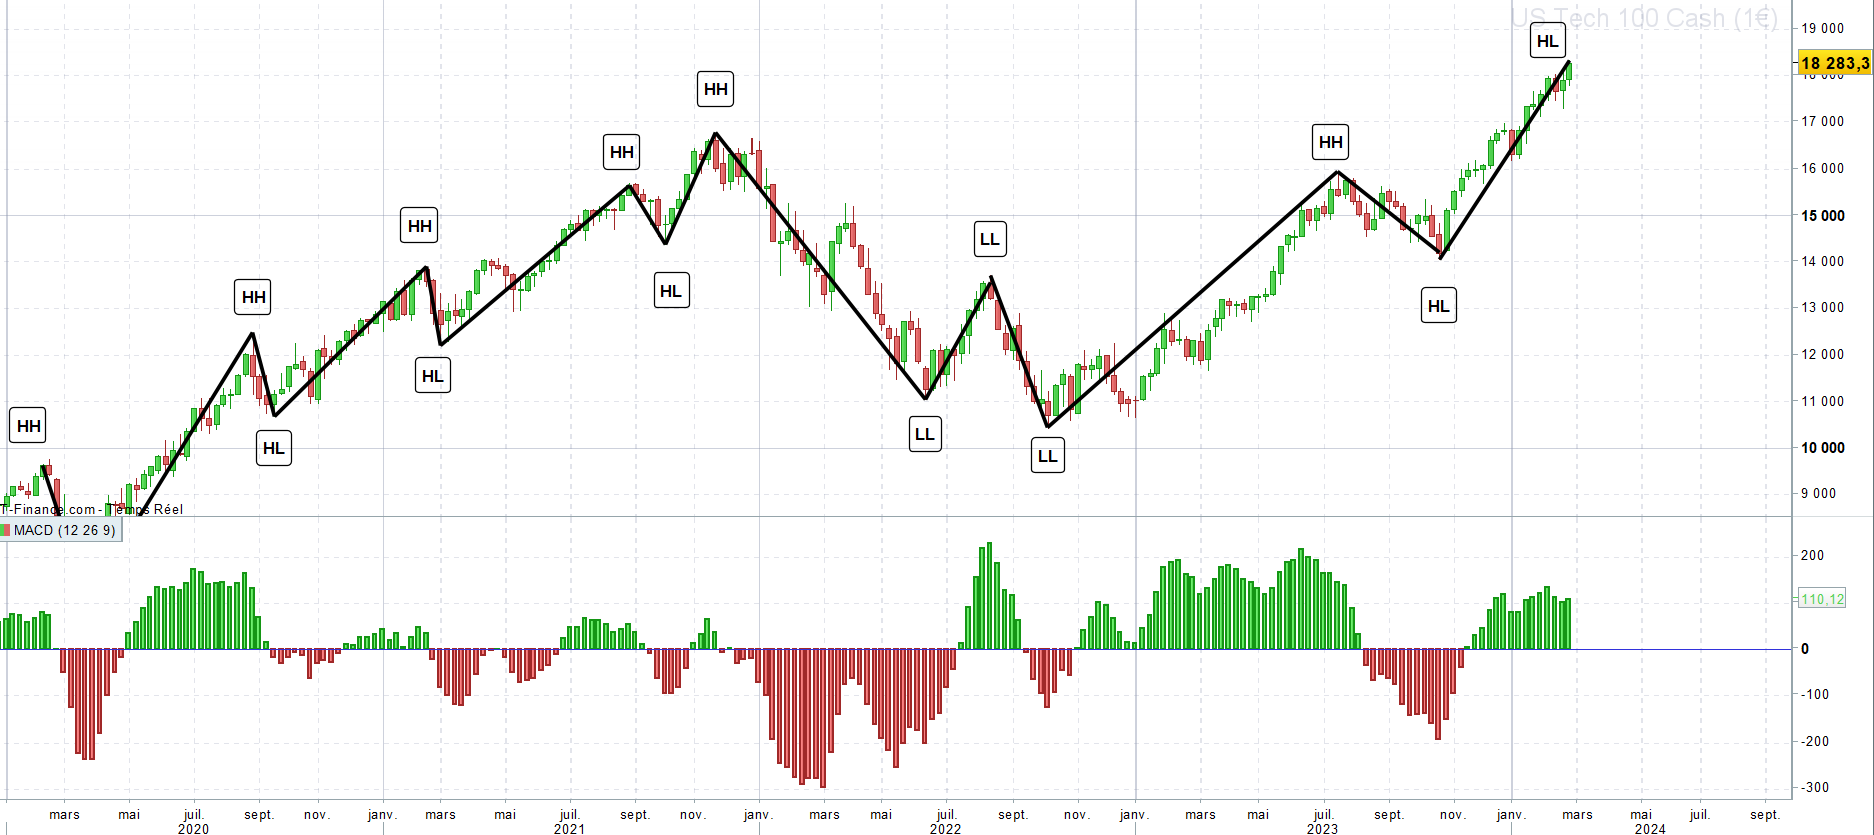
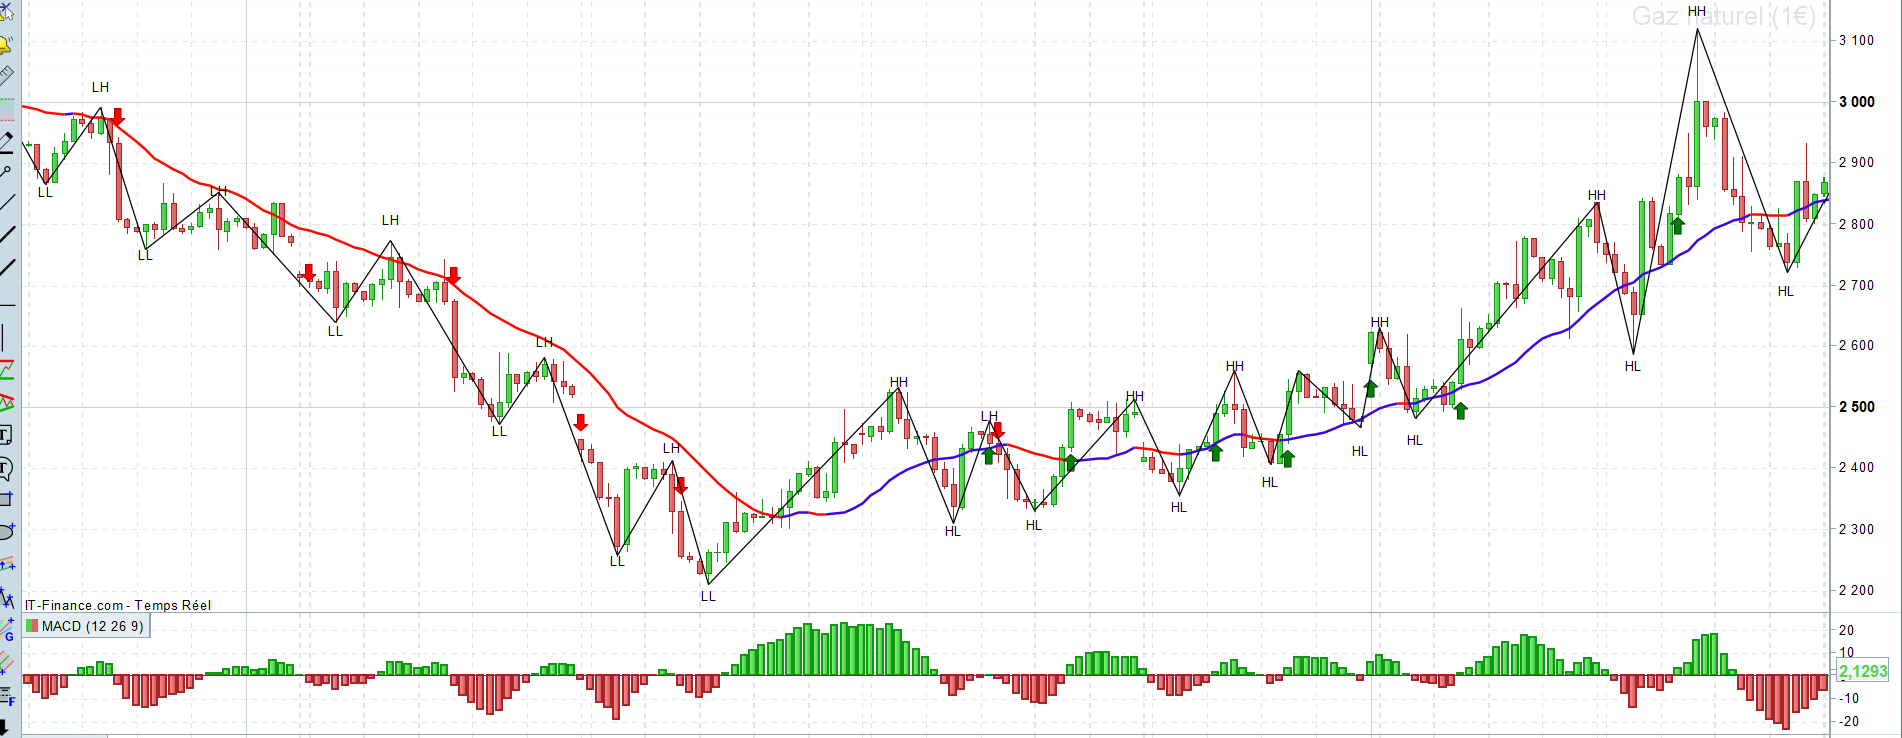
Je voudrais avoir l’équivalent d’un indicateur zigzag mais les + haut et les + bas seront déterminés à partir des + hauts et des + bas des cycles MACD. J’espère que mon exemple est assez explicite.
Merci d’avance pour votre lecture et votre aide
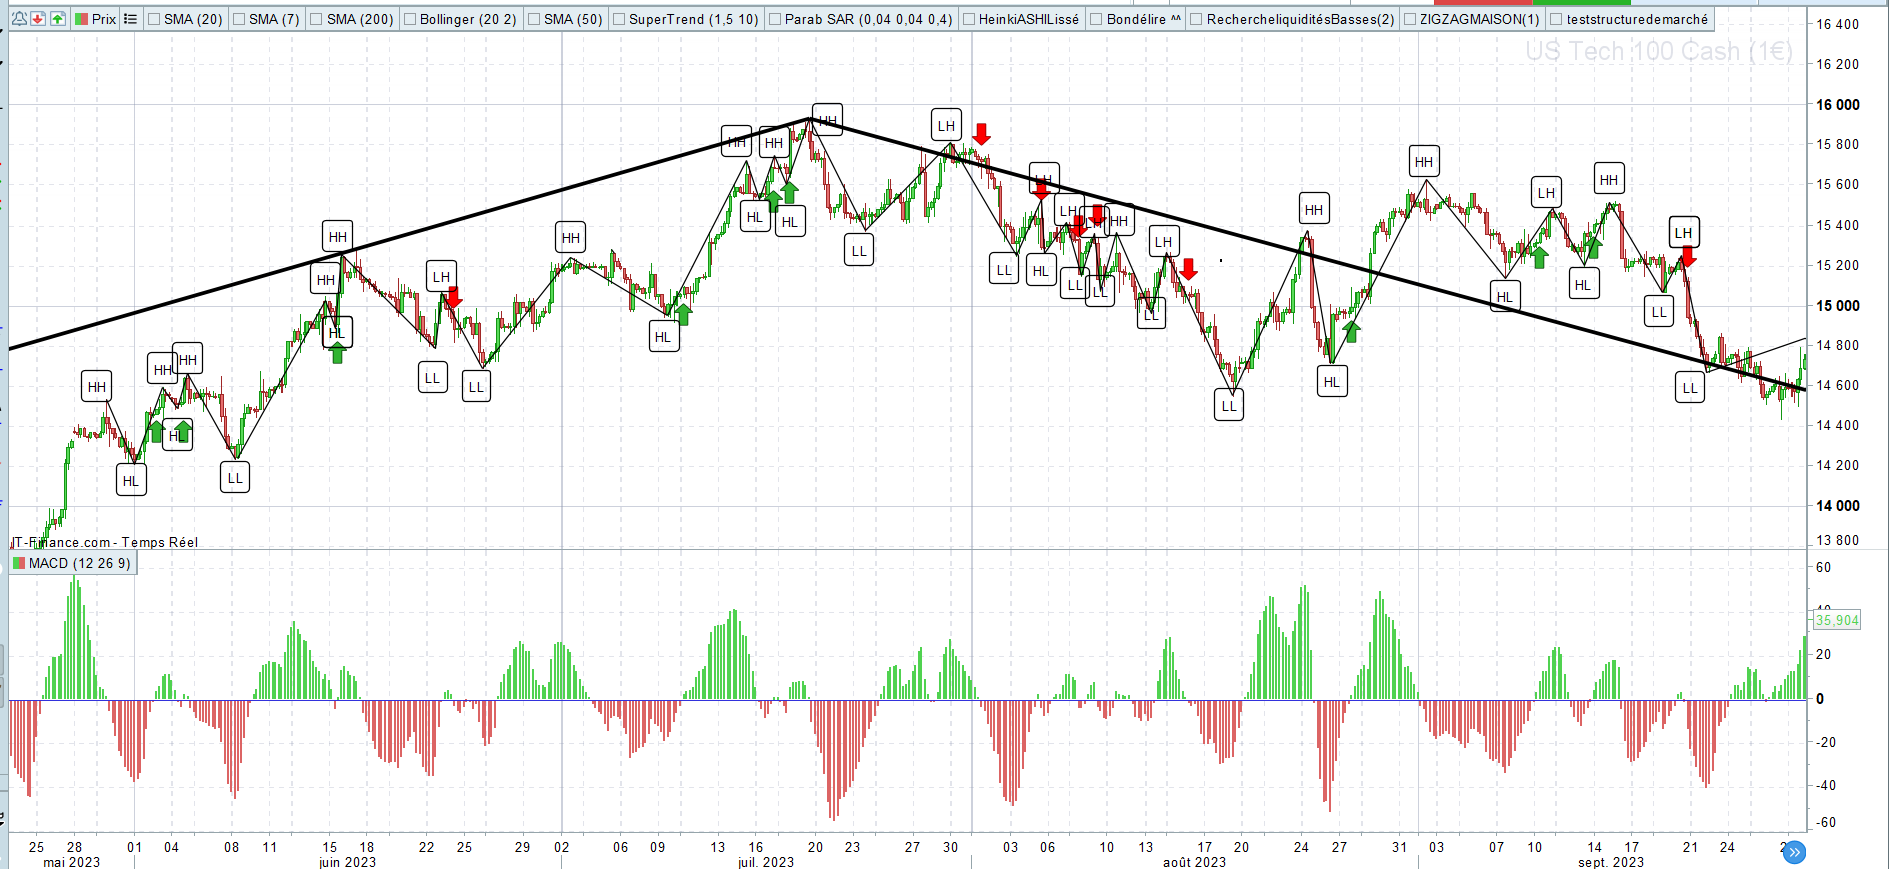
Si je vais au bout de mon idée, ça donne ça avec un signal. Bien entendu la MACD aurait besoin d’être lissé, les faux signaux peuvent perturber les bons niveaux de plus bas.
HH = higherHigh
LH = LowerHigh
LL = LowerLow
HL = HigherLow
Les signaux sont :
Si HH puis LL puis LH alors au prochain croisement de la MACD sous 0 = vente en espérant faire un LL
Si LL puis HH puis HL alors au prochain croisement de la MACD au dessus de 0 = achat en espérant avoir un HH
Pour moi là c’est trop compliqué :/ faisable ?
Hola Aquí a une première approximation.
// % zigzag
porcentaje=3
///Picos
if ultimopunto <=0 then
higher = max(higher,close)
if higher<>higher[1] then
highbar = barindex
endif
picoporcentaje = (higher-close)/higher
nuevopico = picoporcentaje >= porcentaje/100
if nuevopico then
if higher > ultimohigher then
ulthh = hh[1]
hh=1
hl=0
drawtext("HH",highbar,higher+0.25*tr)COLOURED("RED")
ELSE
ulthh = hh[1]
hh=0
hl=1
drawtext("HL",highbar,higher+0.25*tr)coloured("red")
endif
drawsegment(ultimolowerbar,ultimolower,highbar,higher)coloured(200,0,200)
DRAWPOINT(highbar, higher, 2)coloured(255,0,0)
ultimohighbar = highbar //coordenada X
ultimohigher = higher//coordenada y
higher=0
ultimopunto = 1
endif
endif
///valles
if ultimopunto >= 0 then
once lower=close
lower = min(lower,close)
if lower <>lower[1] then
lowerbar = barindex
endif
valleporciento = (close-lower)/lower
nuevovalle = valleporciento >= porcentaje/100
if nuevovalle then
if lower < ultimolower then
ultll=ll[1]
ll=1
lh=0
drawtext("LL",lowerbar,lower-0.25*tr)coloured("red")
else
ultll=ll[1]
ll=0
lh=1
drawtext("LH",lowerbar,lower-0.25*tr)coloured("red")
endif
drawsegment(ultimohighbar,ultimohigher,lowerbar,lower)coloured(0,255,255)
DRAWPOINT(lowerbar,lower,2)coloured(0,0,255)
ultimolowerbar = lowerbar//coordenada X
ultimolower = lower//coordenada y
lower=close*100
ultimopunto = -1
endif
endif
/////macd
ema12 = average[12,1](close)
ema26 = average[26,1](close)
miMACD = ema12-ema26
//////
if hl and miMACD crosses over 0 then
drawarrowup(barindex,low-0.25*tr)coloured("green")
elsif lh and miMACD crosses under 0 then
drawarrowdown(barindex,high+0.25*tr)coloured("red")
endif

return
Bonjour Ivan,
Un grand merci pour votre temps et votre aide, c’est vraiment appréciable. En jouant sur le pourcentage de la pente, j’arrive à faire correspondre les points bas du MACD avec ceux du zigzag. Ensuite, c’est top, grâce à vous je sais comment coder les signaux et marquer HH, LL … Donc, je peux déjà avoir une idée du rendu.
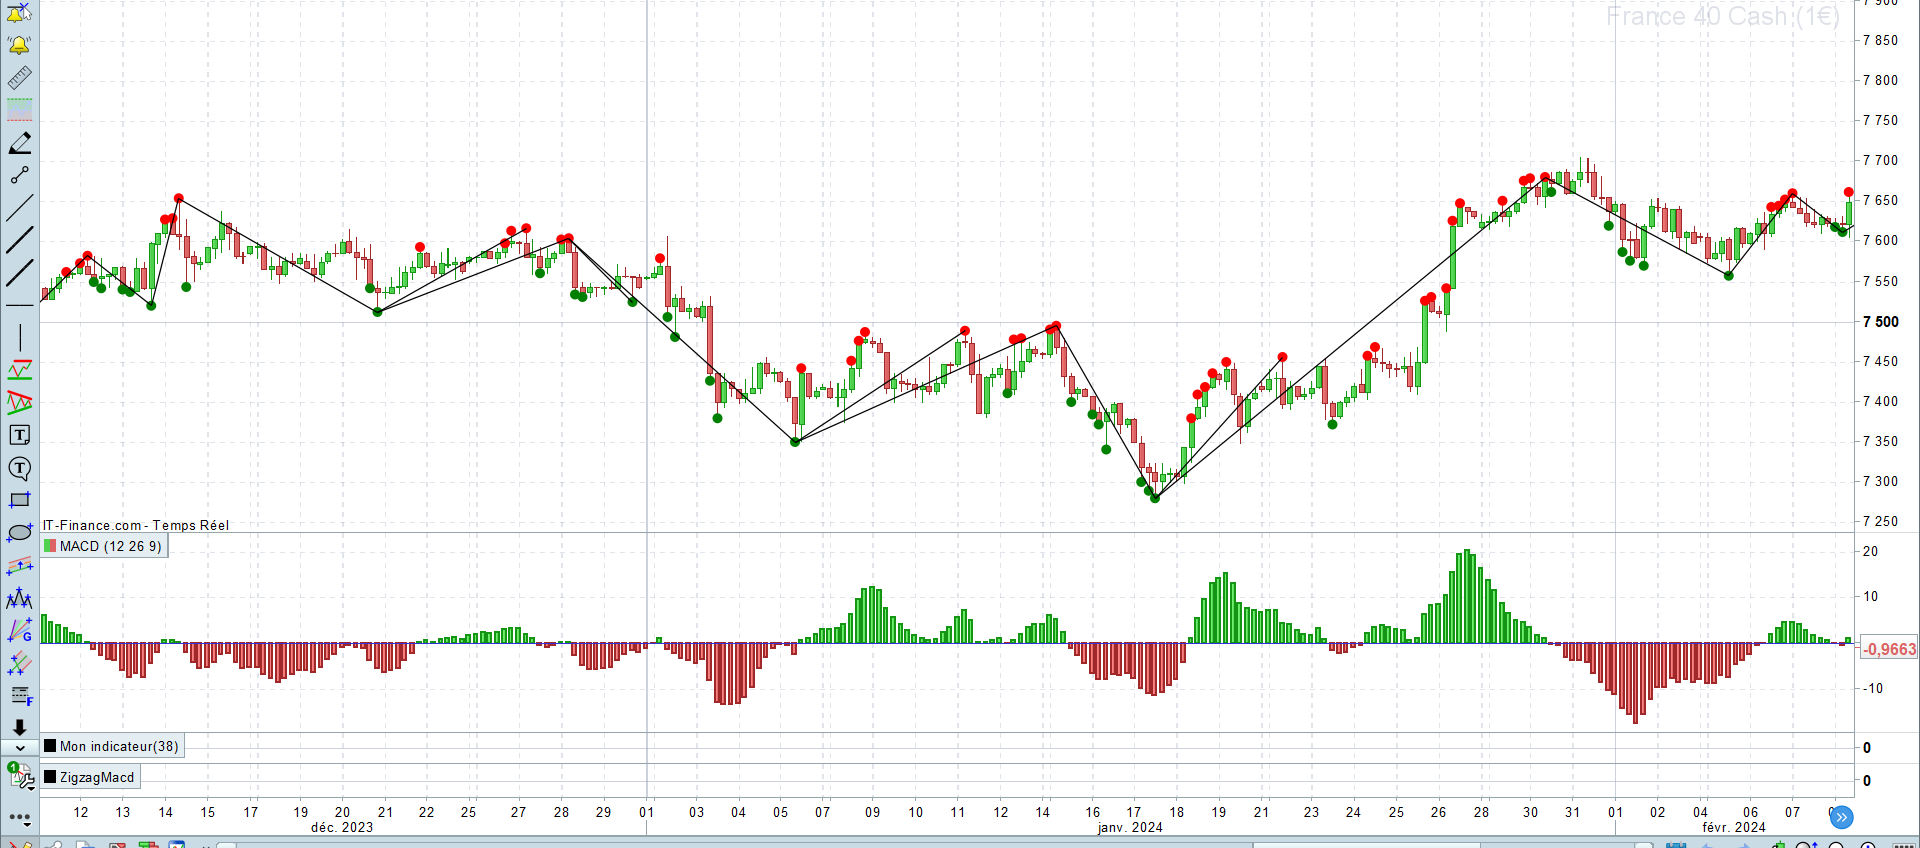
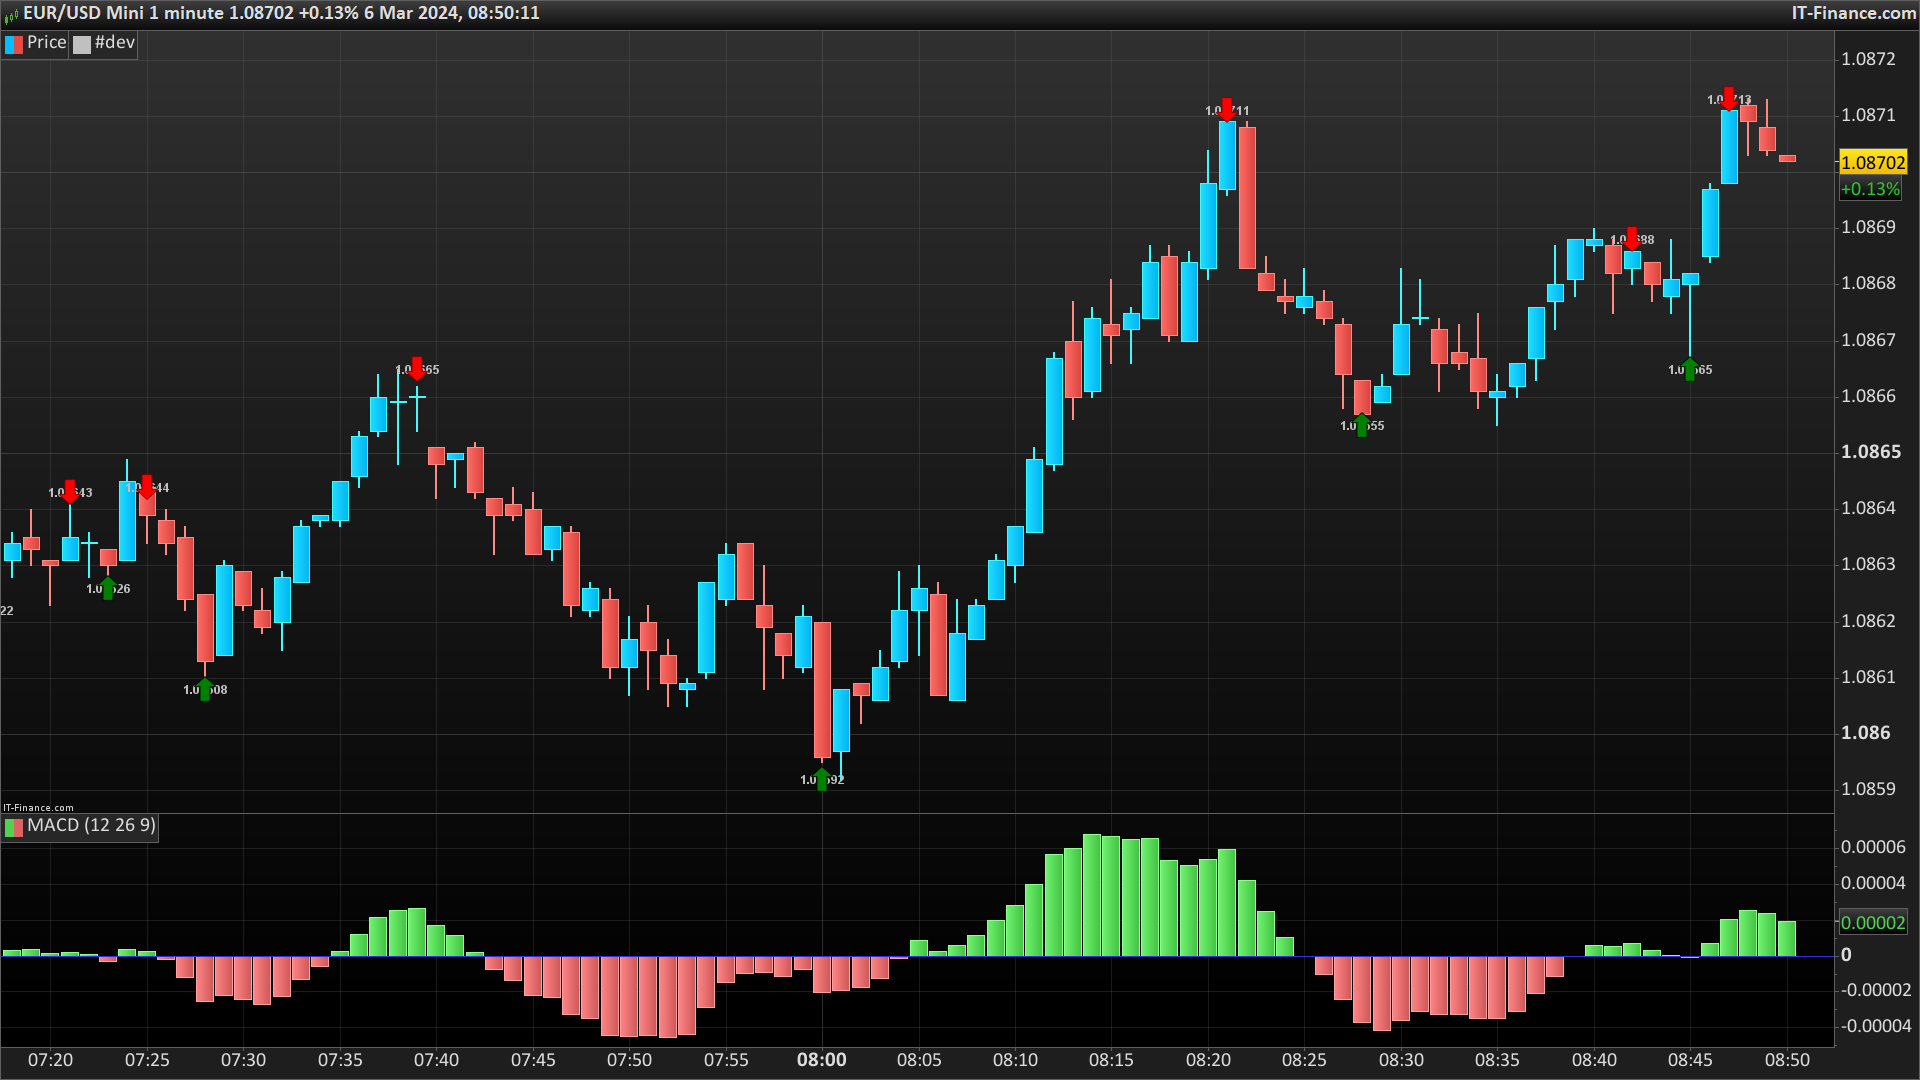
Je suis têtu. Donc, j’ai essayé de coder quelque chose réellement lié avec les valeurs de la MACD. J’ai réussi à faire ça. Mais j’ai un problème. Vu que j’enregistre une valeur de plus haut au croisement de la MACD et qu’ensuite j’enregistre des nouveaux “peak”. On voit que quand il y a un seul peak au moment du croisement et pas d’autres peak, du coup, mes coordonnées ne sont pas enregistrées pour tracer. Je n’arrive pas à le faire marcher correctement.
Si j’ai été compréhensible, avez vous une idée ?
Merci d’avance.
Voici mon code et en fichier joint le rendu de mon codage sur graphique.
// l'indicateur
mymacd=MACD[12,26,9](close)

//cycle haussier pour les peaks

if mymacd crosses over 0 then
higher = DHigh(0)
sens = 1
DRAWPOINT(barindex, high, 2) COLOURED("red")
ENDIF
if mymacd>0 and DHigh(0) > higher THEN
higher = DHigh(0)
highbar=barindex
lasthighbar = highbar
lasthigher = higher
lastpoint=1
DRAWPOINT(barindex, high, 2) COLOURED("red")
ENDIF

//calcul des points bas

If mymacd crosses under 0 THEN
lower = DLow(0)
sens = -1
DRAWPOINT(barindex, low, 2)COLOURED("green")
ENDIF
if mymacd<0 and DLow(0) < lower THEN
lower = DLow(0)
lowbar = BarIndex
lastlowbar = lowbar
lastlower = lower
DRAWPOINT(barindex, low, 2) COLOURED("green")
endif
if mymacd crosses under 0 then
DRAWSEGMENT(lastlowbar, lastlower, lasthighbar, lasthigher)
endif
if mymacd crosses over 0 then
DRAWSEGMENT(lastlowbar, lastlower, lasthighbar, lasthigher)
endif
return
C’est bon, je viens d’y arriver ! Merci. Je vais essayer de coder la suite en m’inspirant de votre code ^^
Bon, mission accomplie grâce à votre aide ! Merci
Voilà la photo du résultat, je suis trop content d’y être arrivé.
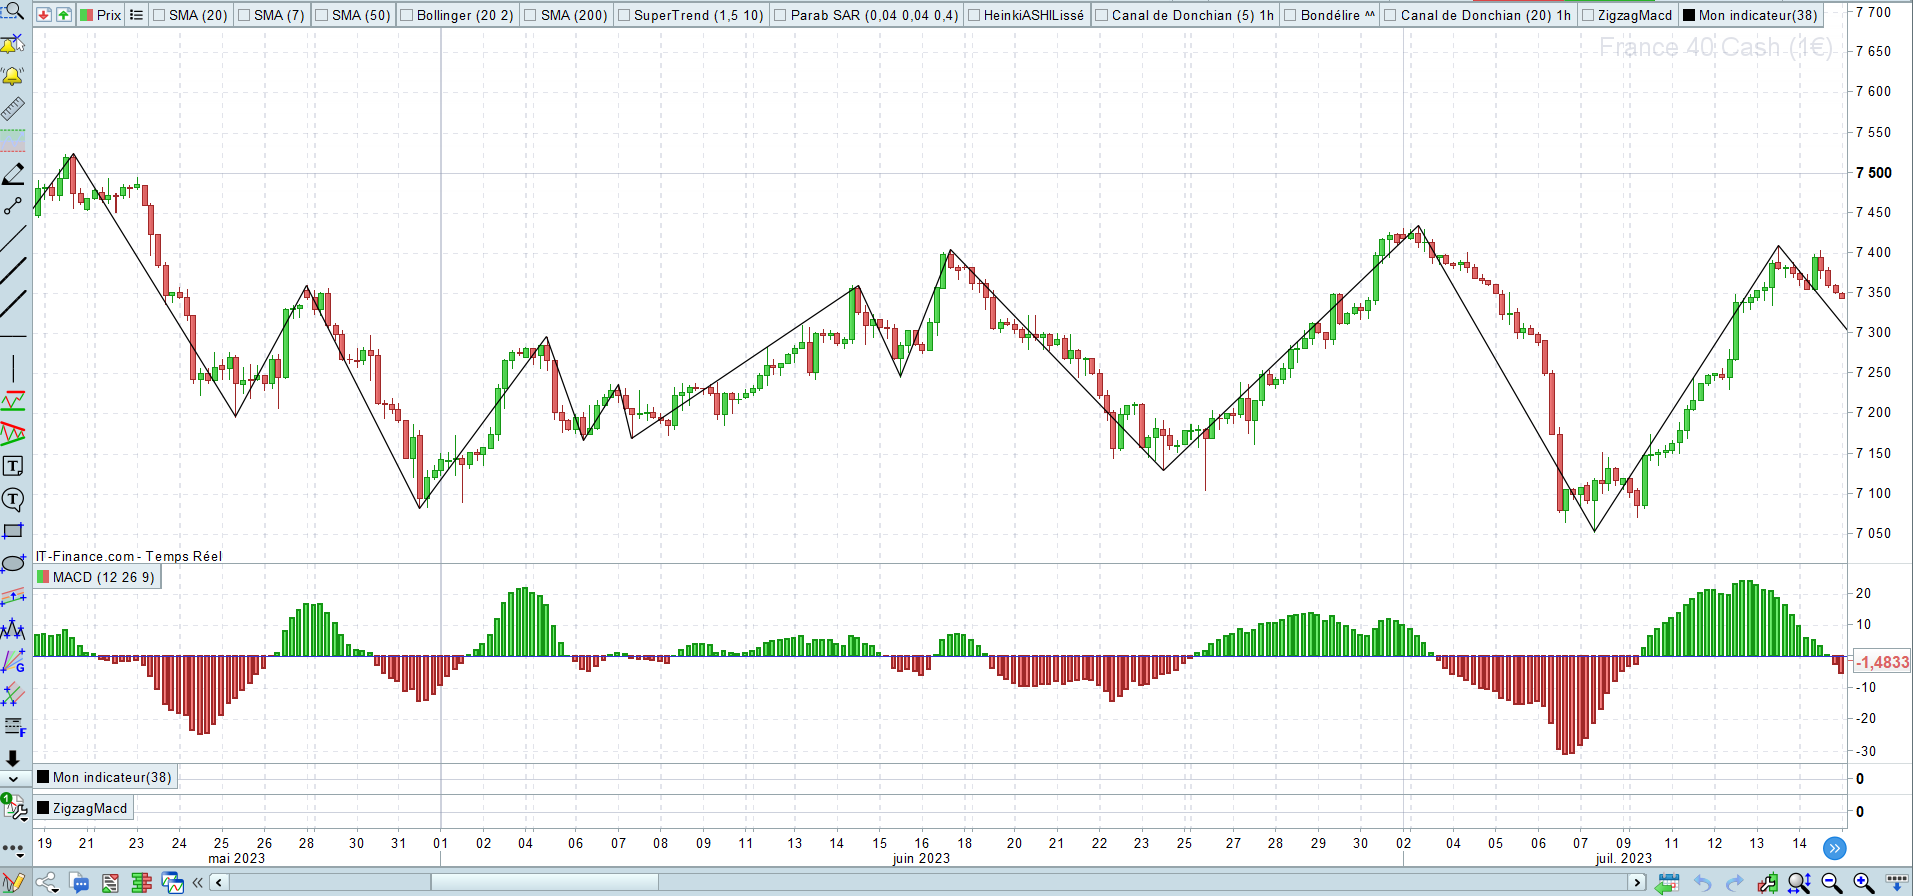
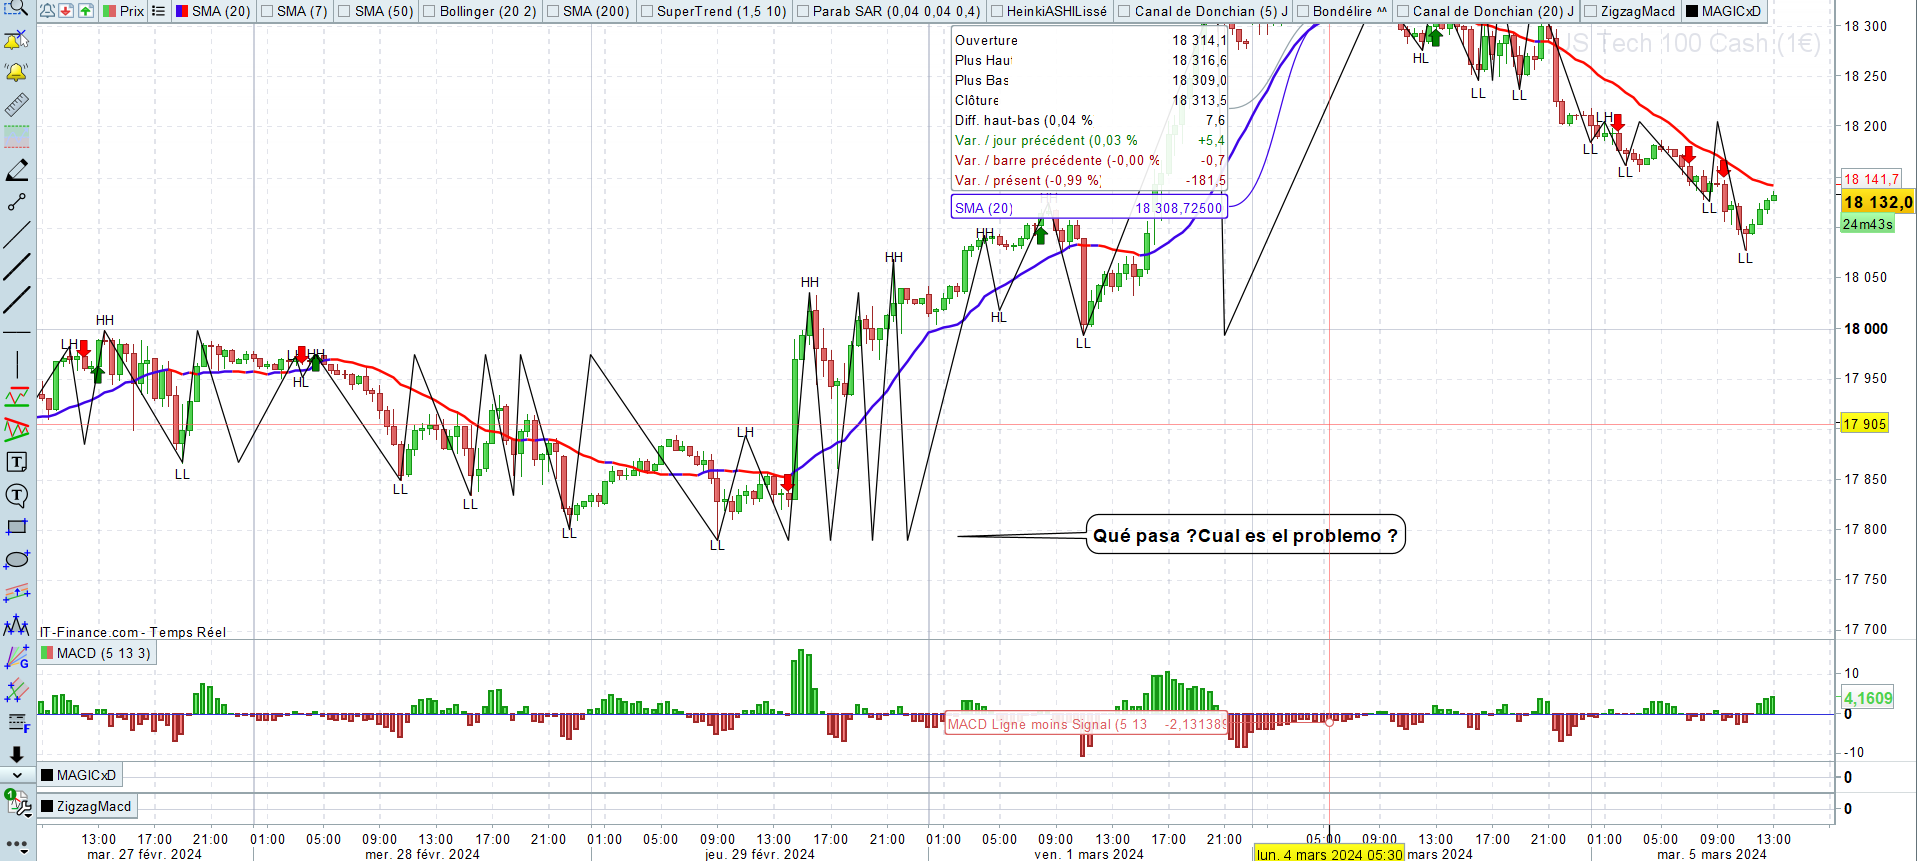
Bon, j’ai besoin d’aide encore je crois. Sur les unités de temps longues à partir de H1 et + H4, daily etc… ça a l’air de bien fonctionner. Mais sur les unités de temps plus petites, ça plante. Ou c’est mon code qui n’est pas bon :p.
Voici mon code et une illustration du bug en image.
Qu’en pensez vous ?
// l'indicateur
mymacd=MACD[12,26,9](close)

//higher = peak

if mymacd crosses over 0 then
higher = DHigh(0)
highbar=barindex
lasthighbar = highbar
lasthigher = higher
sens = 1
//DRAWPOINT(barindex, high, 2) COLOURED("red")
ENDIF
if mymacd>0 and DHigh(0) > higher THEN
higher = DHigh(0)
highbar=barindex
lasthighbar = highbar
lasthigher = higher
lastpoint=1
//DRAWPOINT(barindex, high, 2) COLOURED("red")
ENDIF
if mymacd crosses under 0 then
newpeak = lasthigher
if newpeak[1]<lasthigher THEN
//Ulthh= hh[1]
HH=1
LH=0
DRAWTEXT("HH", lasthighbar, lasthigher+0.25*tr)COLOURED("black")
ENDIF
if newpeak[1]>lasthigher then
hh=0
lh=1
DRAWTEXT("LH", lasthighbar, lasthigher+0.25*tr) COLOURED("black")
endif
endif


//calcul des points bas

If mymacd crosses under 0 THEN
lower = DLow(0)
lowbar = BarIndex
lastlowbar = lowbar
lastlower = lower
sens = -1
//DRAWPOINT(barindex, low, 2)COLOURED("green")
ENDIF
if mymacd<0 and DLow(0) < lower THEN
lower = DLow(0)
lowbar = BarIndex
lastlowbar = lowbar
lastlower = lower
//DRAWPOINT(barindex, low, 2) COLOURED("green")
endif
if mymacd crosses over 0 THEN
newcreux = lastlower
if lastlower<newcreux[1] THEN
LL=1
HL=0
DRAWTEXT("LL", lastlowbar, lastlower-0.25*tr)
ENDIF
if lastlower>newcreux[1] THEN
LL=0
Hl=1
DRAWTEXT("HL", lastlowbar, lastlower-0.25*tr)
endif
endif
if mymacd crosses over 0 then
DRAWSEGMENT(lasthighbar[1], lasthigher[1], lastlowbar[1], lastlower[1])
endif
if mymacd crosses under 0 then
DRAWSEGMENT(lastlowbar[1], lastlower[1], lasthighbar[1], lasthigher[1])
endif


//////Les signaux
if ((HH[1] and hl) or( LH[1] and HL)) and myMACD crosses over 0 then
drawarrowup(barindex,low-0.25*tr)coloured("green")
elsif ((LL[1] and LH) or (HL[1] and LH)) and myMACD crosses under 0 then
drawarrowdown(barindex,high+0.25*tr)coloured("red")
endif
return
Bonjour Vous devrez peut-être saisir l'option updateonclose pour qu'elle fasse le calcul à la fin de la barre (quotidiennement dans votre cas). Si vous souhaitez que les calculs soient effectués quotidiennement, entrez une ligne de code qui correspond à timeframe(daily,updateonclose)
Voici une autre façon de marquer les points hauts et bas selon la position du MACD vis à vis de sa ligne 0 :
defparam drawonlastbaronly=true

i = MACD[12,26,9](close)

if i crosses over 0 then
hhbar=barindex
j=j+1
elsif i crosses under 0 then
llbar=barindex
j=j+1
endif

if i > 0 then
hhperiod=max(1,barindex-hhbar)
$hhbar[j]=barindex[highestBars[hhperiod]]
$hh[j]=highest[hhperiod](high)
$dir[j]=1
endif
if i < 0 then
llperiod=max(1,barindex-llbar)
$llbar[j]=barindex[lowestBars[llperiod]]
$ll[j]=lowest[llperiod](low)
$dir[j]=-1
endif

if islastbarupdate then
for x=0 to j do
if $dir[x] = 1 then
drawtext($hh[x],$hhbar[x],$hh[x],dialog,bold, 12)
drawarrowdown($hhbar[x],$hh[x])  coloured("red")
endif
if $dir[x] = -1 then
drawtext($ll[x],$llbar[x],$ll[x],dialog,bold, 12)
drawarrowup($llbar[x],$ll[x])  coloured("green")
endif
next
endif

return
Bonjour Nicolas ^^
2 mots : Waouh !!! et un autre MERCI
Toute ma reconnaissance, au top !
Vraiment Merci à vous deux. En plus, j’apprends plein de trucs sur le codage grâce à vos codes ^^, bref, je suis méga content :).