Salut Nicolas,
I tried with my limited programming knowledge to create new indicators for CPR and Pivot points with formulas. It didn’t work out.
Appreciate your help in converting this code for CPR and Pivot points from TradingView.
For the pivot points only daily, weekly and monthly are enough. Please ignore other pivots in the code, as I was not sure which one to delete.
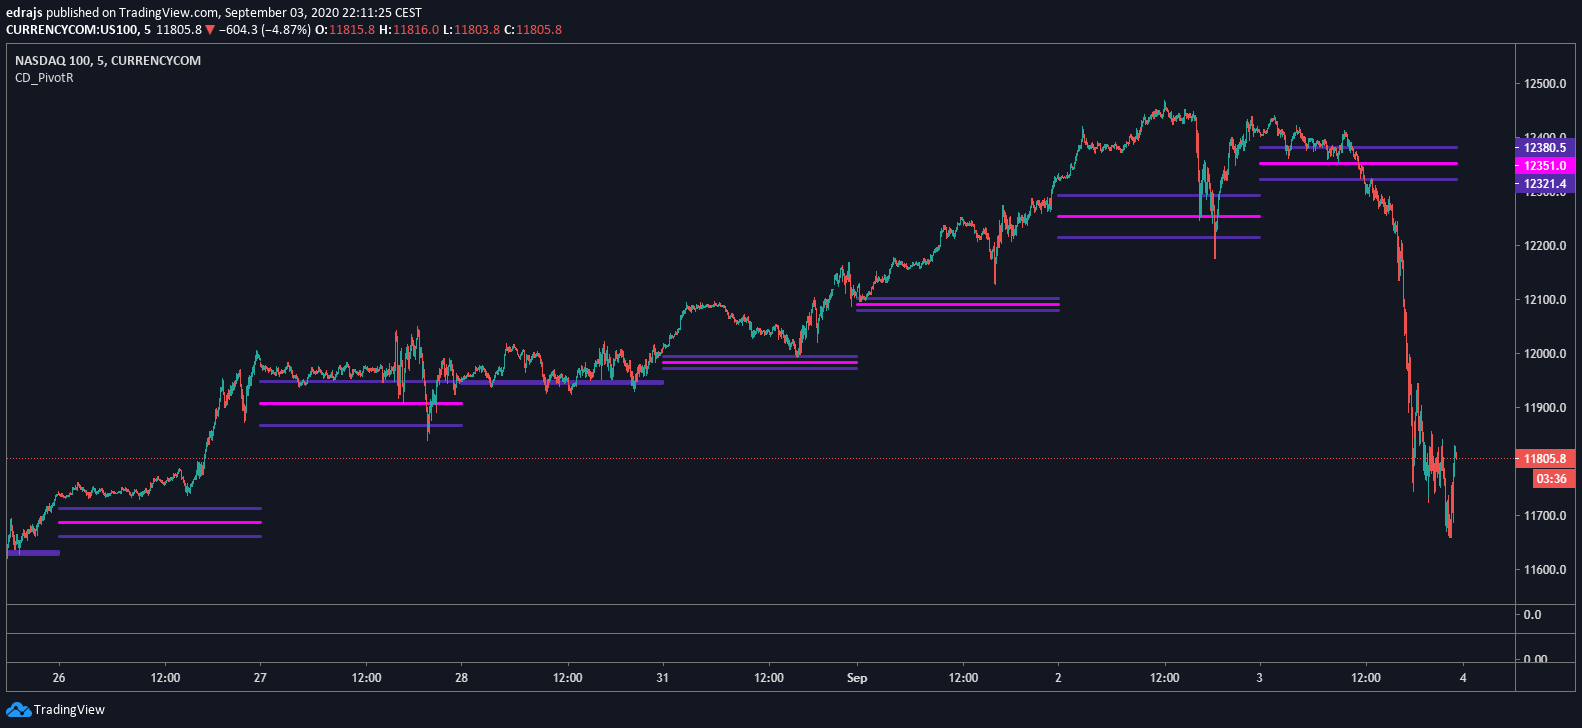
study(title="Pivot Range", shorttitle="CD_PivotR", overlay=true)
sd = input(true, title="Show Daily Pivots?")

//Pivot Range Calculations - Mark Fisher
pivot = (high + low + close ) / 3.0
bc = (high + low ) / 2.0
tc = (pivot - bc) + pivot

//Daily Pivot Range
dtime_pivot = security(tickerid, 'D', pivot[1])
dtime_bc = security(tickerid, 'D', bc[1])
dtime_tc = security(tickerid, 'D', tc[1])

offs_daily = 0
plot(sd and dtime_pivot ? dtime_pivot : na, title="Daily Pivot",style=circles, color=fuchsia,linewidth=3)
plot(sd and dtime_bc ? dtime_bc : na, title="Daily BC",style=circles, color=blue,linewidth=3)
plot(sd and dtime_tc ? dtime_tc : na, title="Daily TC",style=circles, color=blue,linewidth=3)
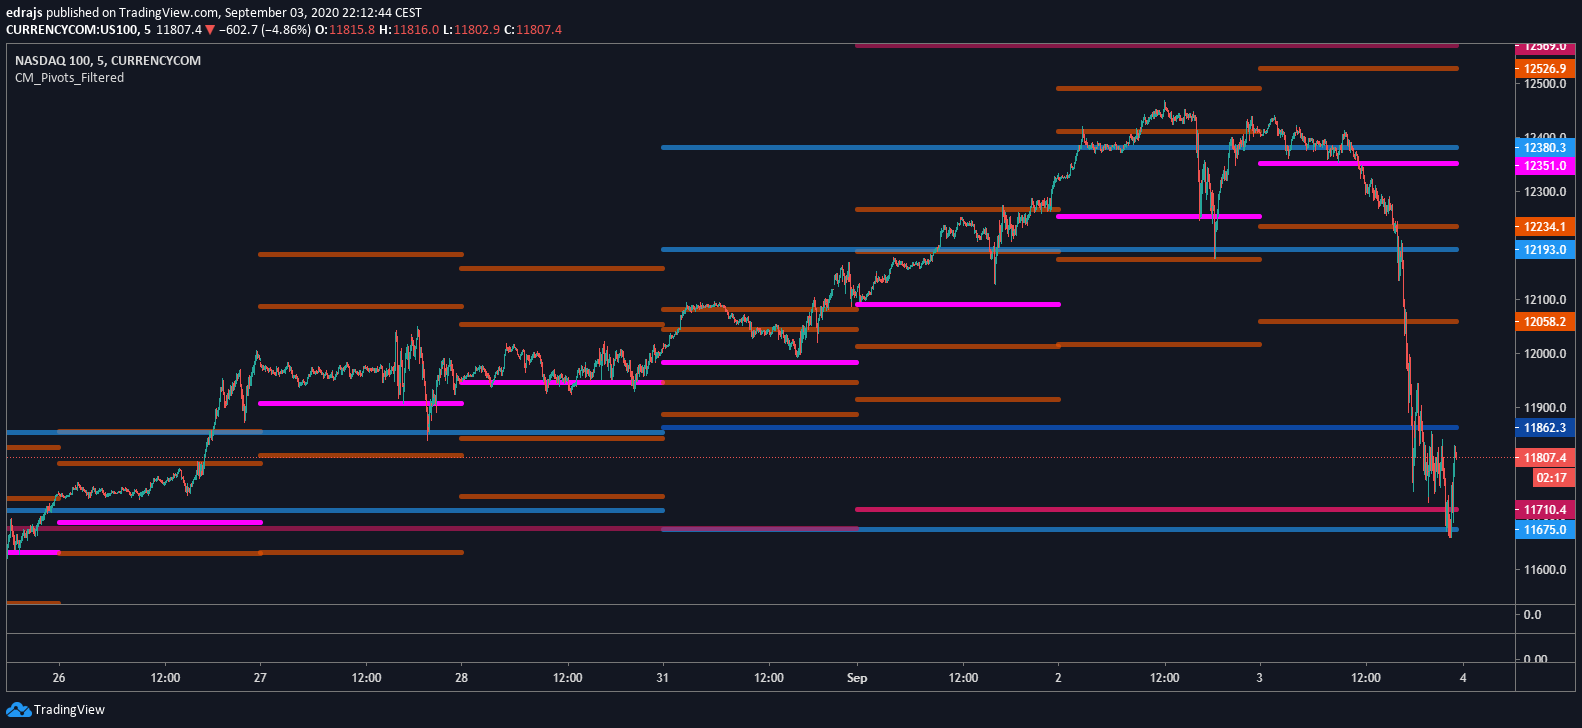
study(title="CM_Pivot Points_M-W-D_4H_1H_Filtered", shorttitle="CM_Pivots_Filtered", overlay=true)
pf = input(true,title="Show Filtered Pivots")
sa = input(true,title="Show Pivot Average")
sh = input(false, title="Show 1 Hour Pivots?")
sf = input(false, title="Show 4 Hour Pivots?")
sd = input(false, title="Show Daily Pivots?")
sw = input(false, title="Show Weekly Pivots?")
sm = input(true, title="Show Monthly Pivots?")
sy = input(false, title="Show Yearly Pivots?")
sh3 = input(false, title="Show R3 & S3 Only On 1 Hour & 4 Hour?")

// Classic Pivot
pivot = (high + low + close ) / 3.0
// Filter Cr
bull= pivot > (pivot + pivot[1]) / 2 + .0025
bear= pivot < (pivot + pivot[1]) / 2 - .0025
// Classic Pivots
r1 = pf and bear ? pivot + (pivot - low) : pf and bull ? pivot + (high - low) : pivot + (pivot - low)
s1 = pf and bull ? pivot - (high - pivot) : pf and bear ? pivot - (high - low) : pivot - (high - pivot)
r2 = pf ? na : pivot + (high - low)
s2 = pf ? na : pivot - (high - low)
r3 = sh3 and r1 + (high - low) ? r1 + (high - low) : na
s3 = sh3 and s1 - (high - low) ? s1 - (high - low) : na
//Pivot Average Calculation
smaP = sma(pivot, 3)

//1 Hour Pivots
htime_pivot = security(tickerid, '60', pivot[1])
htime_pivotAvg = security(tickerid, '60', smaP[1])
htime_R1 = security(tickerid, '60', r1[1])
htime_S1 = security(tickerid, '60', s1[1])
htime_R2 = security(tickerid, '60', r2[1])
htime_S2 = security(tickerid, '60', s2[1])
htime_R3 = security(tickerid, '60', r3[1])
htime_S3 = security(tickerid, '60', s3[1])

plot(sa and sh and htime_pivotAvg ? htime_pivotAvg : na, title="Hourly Pivot Average",style=cross, color=orange,linewidth=2)
plot(sh and htime_pivot ? htime_pivot : na, title="Hourly Pivot",style=circles, color=fuchsia,linewidth=2)
plot(sh and htime_R1 ? htime_R1 : na, title="Hourly R1",style=circles, color=#DC143C,linewidth=2)
plot(sh and htime_S1 ? htime_S1 : na, title="Hourly S1",style=circles, color=lime,linewidth=2)
plot(sh and htime_R2 ? htime_R2 : na, title="Hourly R2",style=circles, color=maroon,linewidth=2)
plot(sh and htime_S2 ? htime_S2 : na, title="Hourly S2",style=circles, color=#228B22,linewidth=2)
plot(sh and htime_R3 ? htime_R3 : na, title="Hourly R3",style=circles, color=#FA8072,linewidth=2)
plot(sh and htime_S3 ? htime_S3 : na, title="Hourly S3",style=circles, color=#CD5C5C,linewidth=2)

//4 Hour Pivots
ftime_pivot = security(tickerid, '240', pivot[1])
ftime_pivotAvg = security(tickerid, '240', smaP[1])
ftime_R1 = security(tickerid, '240', r1[1])
ftime_S1 = security(tickerid, '240', s1[1])
ftime_R2 = security(tickerid, '240', r2[1])
ftime_S2 = security(tickerid, '240', s2[1])
ftime_R3 = security(tickerid, '240', r3[1])
ftime_S3 = security(tickerid, '240', s3[1])

plot(sa and sf and ftime_pivotAvg ? ftime_pivotAvg : na, title="4 Hour Pivot Average",style=cross, color=orange,linewidth=2)
plot(sf and ftime_pivot ? ftime_pivot : na, title="4 Hour Pivot",style=circles, color=fuchsia,linewidth=3)
plot(sf and ftime_R1 ? ftime_R1 : na, title="4 Hour R1",style=circles, color=#DC143C,linewidth=3)
plot(sf and ftime_S1 ? ftime_S1 : na, title="4 Hour S1",style=circles, color=lime,linewidth=3)
plot(sf and ftime_R2 ? ftime_R2 : na, title="4 Hour R2",style=circles, color=maroon,linewidth=3)
plot(sf and ftime_S2 ? ftime_S2 : na, title="4 Hour S2",style=circles, color=#228B22,linewidth=3)
plot(sf and ftime_R3 ? ftime_R3 : na, title="4 Hour R3",style=circles, color=#FA8072,linewidth=3)
plot(sw and ftime_S3 ? ftime_S3 : na, title="4 Hour S3",style=circles, color=#CD5C5C,linewidth=3)

//Daily Pivots
dtime_pivot = security(tickerid, 'D', pivot[1])
dtime_pivotAvg = security(tickerid, 'D', smaP[1])
dtime_r1 = security(tickerid, 'D', r1[1])
dtime_s1 = security(tickerid, 'D', s1[1])
dtime_r2 = security(tickerid, 'D', r2[1])
dtime_s2 = security(tickerid, 'D', s2[1])

offs_daily = 0
plot(sa and sd and dtime_pivotAvg ? dtime_pivotAvg : na, title="Daily Pivot Average",style=cross, color=orange,linewidth=2)
plot(sd and dtime_pivot ? dtime_pivot : na, title="Daily Pivot",style=circles, color=fuchsia,linewidth=3)
plot(sd and dtime_r1 ? dtime_r1 : na, title="Daily R1",style=circles, color=#DC143C,linewidth=3)
plot(sd and dtime_s1 ? dtime_s1 : na, title="Daily S1",style=circles, color=lime,linewidth=3)
plot(sd and dtime_r2 ? dtime_r2 : na, title="Daily R2",style=circles, color=maroon,linewidth=3)
plot(sd and dtime_s2 ? dtime_s2 : na, title="Daily S2",style=circles, color=#228B22,linewidth=3)

//Weekly Pivots
wtime_pivot = security(tickerid, 'W', pivot[1])
wtime_pivotAvg = security(tickerid, 'W', smaP[1])
wtime_R1 = security(tickerid, 'W', r1[1])
wtime_S1 = security(tickerid, 'W', s1[1])
wtime_R2 = security(tickerid, 'W', r2[1])
wtime_S2 = security(tickerid, 'W', s2[1])

plot(sa and sw and wtime_pivotAvg ? wtime_pivotAvg : na, title="Weekly Pivot Average",style=cross, color=orange,linewidth=3)
plot(sw and wtime_pivot ? wtime_pivot : na, title="Weekly Pivot",style=circles, color=fuchsia,linewidth=4)
plot(sw and wtime_R1 ? wtime_R1 : na, title="Weekly R1",style=circles, color=#DC143C,linewidth=4)
plot(sw and wtime_S1 ? wtime_S1 : na, title="Weekly S1",style=circles, color=lime,linewidth=4)
plot(sw and wtime_R2 ? wtime_R2 : na, title="Weekly R2",style=circles, color=maroon,linewidth=4)
plot(sw and wtime_S2 ? wtime_S2 : na, title="Weekly S2",style=circles, color=#228B22,linewidth=4)

//Monthly Pivots
mtime_pivot = security(tickerid, 'M', pivot[1])
mtime_pivotAvg = security(tickerid, 'M', smaP[1])
mtime_R1 = security(tickerid, 'M', r1[1])
mtime_S1 = security(tickerid, 'M', s1[1])
mtime_R2 = security(tickerid, 'M', r2[1])
mtime_S2 = security(tickerid, 'M', s2[1])

plot(sa and sm and mtime_pivotAvg ? mtime_pivotAvg : na, title="Monthly Pivot Average",style=cross, color=orange,linewidth=4)
plot(sm and mtime_pivot ? mtime_pivot : na, title="Monthly Pivot",style=circles, color=fuchsia,linewidth=5)
plot(sm and mtime_R1 ? mtime_R1 : na, title="Monthly R1",style=circles, color=#DC145C,linewidth=5)
plot(sm and mtime_S1 ? mtime_S1 : na, title="Monthly S1",style=circles, color=lime,linewidth=5)
plot(sm and mtime_R2 ? mtime_R2 : na, title="Monthly R2",style=circles, color=maroon,linewidth=5)
plot(sm and mtime_S2 ? mtime_S2 : na, title="Monthly S2",style=circles, color=#228B22,linewidth=5)

//Yearly Pivots
ytime_pivot = security(tickerid, '12M', pivot[1])
ytime_pivotAvg = security(tickerid, '12M', smaP[1])
ytime_R1 = security(tickerid, '12M', r1[1])
ytime_S1 = security(tickerid, '12M', s1[1])
ytime_R2 = security(tickerid, '12M', r2[1])
ytime_S2 = security(tickerid, '12M', s2[1])

//Yearly Pivots Plots
plot(sa and sy and ytime_pivotAvg ? ytime_pivotAvg : na, title="Yearly Pivot Average",style=cross, color=orange,linewidth=4)
plot(sy and ytime_pivot ? ytime_pivot : na, title="Yearly Pivot",style=cross, color=fuchsia,linewidth=6)
plot(sy and ytime_R1 ? ytime_R1 : na, title="Yearly R1",style=cross, color=#DC143C,linewidth=6)
plot(sy and ytime_S1 ? ytime_S1 : na, title="Yearly S1",style=cross, color=lime,linewidth=6)
plot(sy and ytime_R2 ? ytime_R2 : na, title="Yearly R2",style=cross, color=maroon,linewidth=6)
plot(sy and ytime_S2 ? ytime_S2 : na, title="Yearly S2",style=cross, color=#228B22,linewidth=6)