Expert Services

No recent search

could you pleases covert this code from “Volumatic Variable Index Dynamic Aver
- Forums
- ProRealTime English Forum
- ProBuilder: Indicators & Custom Tools
- could you pleases covert this code from “Volumatic Variable Index Dynamic Aver
-
AuthorPosts
-
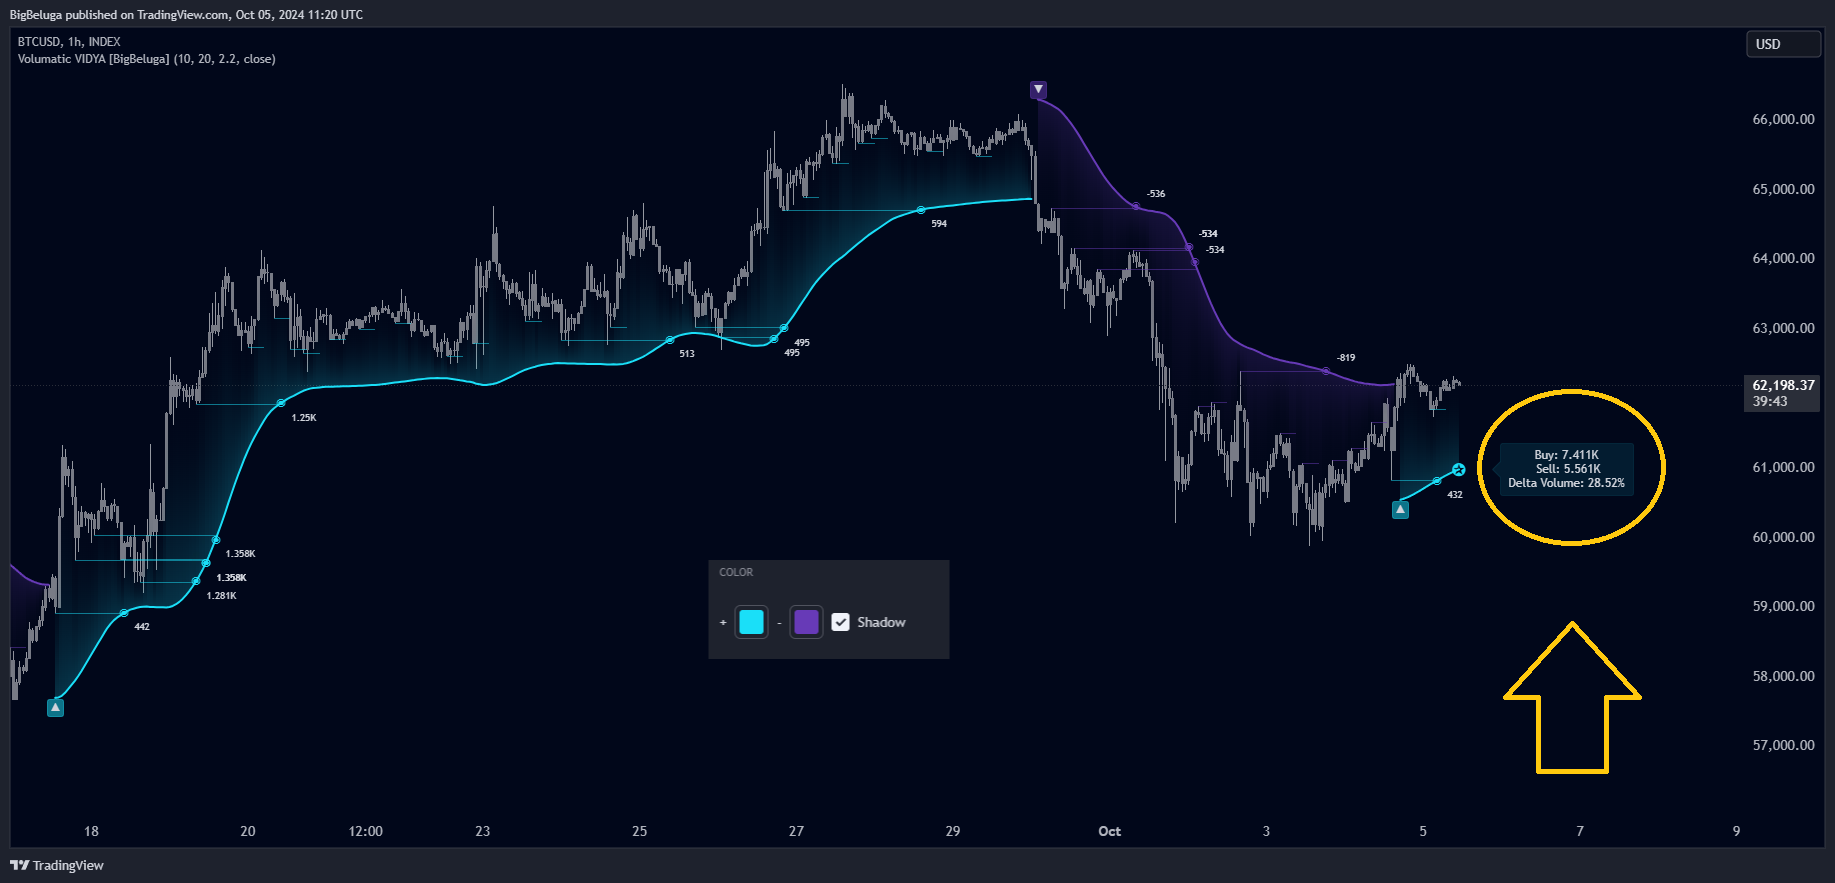
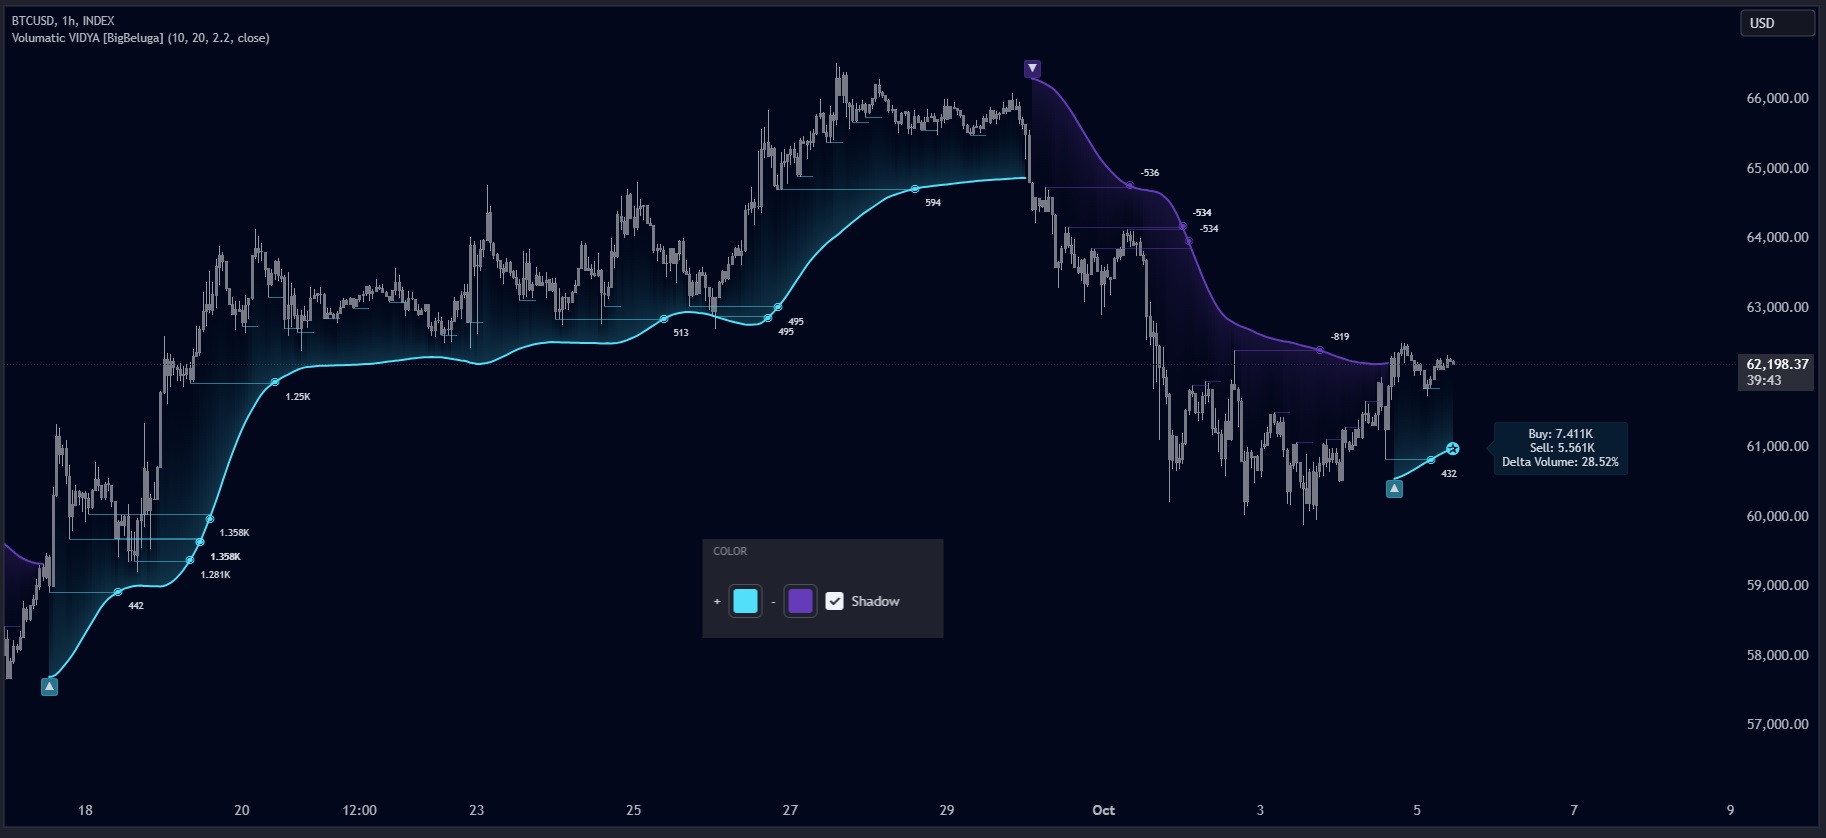
//@version=5 indicator("Volumatic Variable Index Dynamic Average [BigBeluga]", "Volumatic VIDYA [BigBeluga]", overlay = true, max_lines_count = 500, max_labels_count = 500) // INPUTS ――――――――――――――――――――――――――――――――――――――――――――――――――――――――――――――――――――――――――――――――――――――――――――――――――――――――{ // Input parameters for length, momentum, and source data int vidya_length = input.int(10, "VIDYA Length") // Length of the VIDYA calculation int vidya_momentum = input.int(20, "VIDYA Momentum") // Momentum length for VIDYA float band_distance = input.float(2, "Distance factor for upper/lower bands", step = 0.1) // Distance factor for upper/lower bands // Define pivot parameters int pivot_left_bars = 3 // Left side pivot bars int pivot_right_bars = pivot_left_bars // Right side pivot bars float source = input.source(close, "Source") // Source for VIDYA calculation // Define colors for up and down trends color up_trend_color = input(#17dfad, "+", group = "Color", inline = "c") // Color for uptrend color down_trend_color = input(#dd326b, "-", group = "Color", inline = "c") // Color for downtrend bool shadow = input.bool(true, "Shadow", group = "Color", inline = "c") // Initialize variables for line, volume, and trend state var line pivot_line = na // Variable for storing line references var float volume_value = na // Variable for storing volume data float smoothed_value = na // Smoothing variable for VIDYA trend levels var bool is_trend_up = na // Boolean variable for tracking trend direction // Initialize arrays for storing line and volume information var array<line> liquidity_lines_low = array.new<line>(500) // Array for storing lines for lows var array<line> liquidity_lines_high = array.new<line>(500) // Array for storing lines for highs var float up_trend_volume = na // Volume accumulated during uptrend var float down_trend_volume = na // Volume accumulated during downtrend // } // FUNCTIONS―――――――――――――――――――――――――――――――――――――――――――――――――――――――――――――――――――――――――――――――――――――――――――――――――――――――――――――{ // Define VIDYA (Variable Index Dynamic Average) function vidya_calc(src, vidya_length, vidya_momentum) => float momentum = ta.change(src) float sum_pos_momentum = math.sum((momentum >= 0) ? momentum : 0.0, vidya_momentum) float sum_neg_momentum = math.sum((momentum >= 0) ? 0.0 : -momentum, vidya_momentum) float abs_cmo = math.abs(100 * (sum_pos_momentum - sum_neg_momentum) / (sum_pos_momentum + sum_neg_momentum)) float alpha = 2 / (vidya_length + 1) var float vidya_value = 0.0 vidya_value := alpha * abs_cmo / 100 * src + (1 - alpha * abs_cmo / 100) * nz(vidya_value[1]) ta.sma(vidya_value, 15) // Method to extend lines and add labels for liquidity levels method extend_liquidity_lines(array<line> line_array, float price_level, bool is_cross, volume_val)=> if line_array.size() > 0 and last_bar_index - bar_index < 5000 for i = 0 to line_array.size()-1 if i < line_array.size() line liquidity_line = line_array.get(i) float current_line_level = line.get_y2(liquidity_line) bool price_cross = is_cross ? price_level < current_line_level and price_level[1] >= current_line_level : price_level > current_line_level and price_level[1] <= current_line_level bool is_short_line = bar_index - line.get_x1(liquidity_line) < 50 if price_cross and is_short_line line.set_x2(liquidity_line, bar_index) line_array.remove(i) // Add volume label to the liquidity zone label.new(bar_index-1, price_level[1], str.tostring(volume_val, format.volume), color = color.rgb(0, 0, 0, 99), style = is_cross ? label.style_label_lower_left : label.style_label_upper_left, textcolor = chart.fg_color, size = size.small) // Add a circle label to represent liquidity zone label.new(bar_index-1, price_level[1], text = "◉", color = #00000003, textcolor = is_cross ? down_trend_color : up_trend_color, style = label.style_label_center, size = size.normal) // } // CALCULATIONS――――――――――――――――――――――――――――――――――――――――――――――――――――――――――――――――――――――――――――――――――――――――――――――{ // Calculate the Average True Range (ATR) float atr_value = ta.atr(200) // ATR calculation with length of 200 // Calculate the VIDYA (Variable Index Dynamic Average) vidya_value = vidya_calc(source, vidya_length, vidya_momentum) // Calculate upper and lower bands based on VIDYA and ATR float upper_band = vidya_value + atr_value * band_distance float lower_band = vidya_value - atr_value * band_distance // Detect trend direction using crossovers of source with bands if ta.crossover(source, upper_band) is_trend_up := true if ta.crossunder(source, lower_band) is_trend_up := false // Set trend-based smoothing variable if is_trend_up smoothed_value := lower_band if not is_trend_up smoothed_value := upper_band if ta.change(is_trend_up) smoothed_value := na // Calculate pivot highs and lows for price action float pivot_high = ta.pivothigh(pivot_left_bars, pivot_right_bars) float pivot_low = ta.pivotlow(close, pivot_left_bars, pivot_right_bars) // Create and store lines for pivot lows (support zones) if low[pivot_right_bars] > smoothed_value and pivot_low pivot_line := line.new( bar_index[pivot_right_bars], low[pivot_right_bars], bar_index[pivot_right_bars]+5, low[pivot_right_bars], color = color.new(up_trend_color, 50) ) liquidity_lines_low.push(pivot_line) volume_value := math.sum(volume, pivot_right_bars + pivot_left_bars) / (pivot_right_bars + pivot_left_bars) // Create and store lines for pivot highs (resistance zones) if high[pivot_right_bars] < smoothed_value and pivot_high pivot_line := line.new( bar_index[pivot_right_bars], high[pivot_right_bars], bar_index[pivot_right_bars]+5, high[pivot_right_bars], color = color.new(down_trend_color, 50) ) liquidity_lines_high.push(pivot_line) volume_value := math.sum(-volume, pivot_right_bars + pivot_left_bars) / (pivot_right_bars + pivot_left_bars) // Extend lines to track price movements liquidity_lines_high.extend_liquidity_lines(smoothed_value, true, volume_value) liquidity_lines_low.extend_liquidity_lines(smoothed_value, false, volume_value) // Detect changes in the trend direction bool trend_cross_up = not is_trend_up[1] and is_trend_up bool trend_cross_down = not is_trend_up and is_trend_up[1] // Reset volume counters when trend changes if ta.change(trend_cross_up) or ta.change(trend_cross_down) up_trend_volume := 0 down_trend_volume := 0 // Accumulate volume during trends if not(ta.change(trend_cross_up) or ta.change(trend_cross_down)) up_trend_volume += (close > open ? volume : 0) down_trend_volume += (close < open ? volume : 0) // Calculate average volume float avg_volume_delta = (up_trend_volume + down_trend_volume) / 2 // Determine the color of the trend color trend_color = is_trend_up ? up_trend_color : not is_trend_up ? down_trend_color : chart.fg_color // Calculate delta volume percentage string delta_volume = str.tostring(((up_trend_volume - down_trend_volume) / avg_volume_delta) * 100, format.percent) == "NaN%" ? "0%" : str.tostring(((up_trend_volume - down_trend_volume) / avg_volume_delta) * 100, format.percent) // } // PLOT ――――――――――――――――――――――――――――――――――――――――――――――――――――――――――――――――――――――――――――――――――――――――――――――――――――――――――――{ // Display labels for volume and trend statistics on the last bar if barstate.islast label.delete( label.new(bar_index + 10, smoothed_value, "Buy: " + str.tostring(up_trend_volume, format.volume) + "\n Sell: " + str.tostring(down_trend_volume, format.volume) + "\nDelta Volume: " + delta_volume, color = color.new(trend_color, 90), style = label.style_label_left, textcolor = chart.fg_color )[1]) label.delete(label.new(bar_index, smoothed_value, text = "✪", color = #00000003, textcolor = trend_color, style = label.style_label_center, size = size.large)[1]) // Plot the VIDYA trend line p1 = plot(smoothed_value, color = trend_color, linewidth = 2, style = plot.style_linebr) p2 = plot(hl2, display = display.none) // Fill between the plot and the VIDYA line fill(p1, p2, smoothed_value, hl2, color.new(trend_color, shadow ? 80 : 100), na) // Plot trend change markers (up and down arrows) plotshape( series = trend_cross_up[1] ? smoothed_value[0] : na, title = "Trend Up", style = shape.labelup, location = location.absolute, color = color.new(up_trend_color, 50), text = "▲", textcolor = chart.fg_color ) plotshape( series = trend_cross_down[1] ? smoothed_value[0] : na, title = "Trend Down", style = shape.labeldown, location = location.absolute, color = color.new(down_trend_color, 50), text = "▼", textcolor = chart.fg_color ) // }// This work is licensed under Creative Commons Attribution-NonCommercial-ShareAlike 4.0 International // https://creativecommons.org/licenses/by-nc-sa/4.0/ // © BigBeluga //@version=5 indicator("Volumatic Variable Index Dynamic Average [BigBeluga]", "Volumatic VIDYA [BigBeluga]", overlay = true, max_lines_count = 500, max_labels_count = 500) // INPUTS ――――――――――――――――――――――――――――――――――――――――――――――――――――――――――――――――――――――――――――――――――――――――――――――――――――――――{ // Input parameters for length, momentum, and source data int vidya_length = input.int(10, "VIDYA Length") // Length of the VIDYA calculation int vidya_momentum = input.int(20, "VIDYA Momentum") // Momentum length for VIDYA float band_distance = input.float(2, "Distance factor for upper/lower bands", step = 0.1) // Distance factor for upper/lower bands // Define pivot parameters int pivot_left_bars = 3 // Left side pivot bars int pivot_right_bars = pivot_left_bars // Right side pivot bars float source = input.source(close, "Source") // Source for VIDYA calculation // Define colors for up and down trends color up_trend_color = input(#17dfad, "+", group = "Color", inline = "c") // Color for uptrend color down_trend_color = input(#dd326b, "-", group = "Color", inline = "c") // Color for downtrend bool shadow = input.bool(true, "Shadow", group = "Color", inline = "c") // Initialize variables for line, volume, and trend state var line pivot_line = na // Variable for storing line references var float volume_value = na // Variable for storing volume data float smoothed_value = na // Smoothing variable for VIDYA trend levels var bool is_trend_up = na // Boolean variable for tracking trend direction // Initialize arrays for storing line and volume information var array<line> liquidity_lines_low = array.new<line>(500) // Array for storing lines for lows var array<line> liquidity_lines_high = array.new<line>(500) // Array for storing lines for highs var float up_trend_volume = na // Volume accumulated during uptrend var float down_trend_volume = na // Volume accumulated during downtrend // } // FUNCTIONS―――――――――――――――――――――――――――――――――――――――――――――――――――――――――――――――――――――――――――――――――――――――――――――――――――――――――――――{ // Define VIDYA (Variable Index Dynamic Average) function vidya_calc(src, vidya_length, vidya_momentum) => float momentum = ta.change(src) float sum_pos_momentum = math.sum((momentum >= 0) ? momentum : 0.0, vidya_momentum) float sum_neg_momentum = math.sum((momentum >= 0) ? 0.0 : -momentum, vidya_momentum) float abs_cmo = math.abs(100 * (sum_pos_momentum - sum_neg_momentum) / (sum_pos_momentum + sum_neg_momentum)) float alpha = 2 / (vidya_length + 1) var float vidya_value = 0.0 vidya_value := alpha * abs_cmo / 100 * src + (1 - alpha * abs_cmo / 100) * nz(vidya_value[1]) ta.sma(vidya_value, 15) // Method to extend lines and add labels for liquidity levels method extend_liquidity_lines(array<line> line_array, float price_level, bool is_cross, volume_val)=> if line_array.size() > 0 and last_bar_index - bar_index < 5000 for i = 0 to line_array.size()-1 if i < line_array.size() line liquidity_line = line_array.get(i) float current_line_level = line.get_y2(liquidity_line) bool price_cross = is_cross ? price_level < current_line_level and price_level[1] >= current_line_level : price_level > current_line_level and price_level[1] <= current_line_level bool is_short_line = bar_index - line.get_x1(liquidity_line) < 50 if price_cross and is_short_line line.set_x2(liquidity_line, bar_index) line_array.remove(i) // Add volume label to the liquidity zone label.new(bar_index-1, price_level[1], str.tostring(volume_val, format.volume), color = color.rgb(0, 0, 0, 99), style = is_cross ? label.style_label_lower_left : label.style_label_upper_left, textcolor = chart.fg_color, size = size.small) // Add a circle label to represent liquidity zone label.new(bar_index-1, price_level[1], text = "◉", color = #00000003, textcolor = is_cross ? down_trend_color : up_trend_color, style = label.style_label_center, size = size.normal) // } // CALCULATIONS――――――――――――――――――――――――――――――――――――――――――――――――――――――――――――――――――――――――――――――――――――――――――――――{ // Calculate the Average True Range (ATR) float atr_value = ta.atr(200) // ATR calculation with length of 200 // Calculate the VIDYA (Variable Index Dynamic Average) vidya_value = vidya_calc(source, vidya_length, vidya_momentum) // Calculate upper and lower bands based on VIDYA and ATR float upper_band = vidya_value + atr_value * band_distance float lower_band = vidya_value - atr_value * band_distance // Detect trend direction using crossovers of source with bands if ta.crossover(source, upper_band) is_trend_up := true if ta.crossunder(source, lower_band) is_trend_up := false // Set trend-based smoothing variable if is_trend_up smoothed_value := lower_band if not is_trend_up smoothed_value := upper_band if ta.change(is_trend_up) smoothed_value := na // Calculate pivot highs and lows for price action float pivot_high = ta.pivothigh(pivot_left_bars, pivot_right_bars) float pivot_low = ta.pivotlow(close, pivot_left_bars, pivot_right_bars) // Create and store lines for pivot lows (support zones) if low[pivot_right_bars] > smoothed_value and pivot_low pivot_line := line.new( bar_index[pivot_right_bars], low[pivot_right_bars], bar_index[pivot_right_bars]+5, low[pivot_right_bars], color = color.new(up_trend_color, 50) ) liquidity_lines_low.push(pivot_line) volume_value := math.sum(volume, pivot_right_bars + pivot_left_bars) / (pivot_right_bars + pivot_left_bars) // Create and store lines for pivot highs (resistance zones) if high[pivot_right_bars] < smoothed_value and pivot_high pivot_line := line.new( bar_index[pivot_right_bars], high[pivot_right_bars], bar_index[pivot_right_bars]+5, high[pivot_right_bars], color = color.new(down_trend_color, 50) ) liquidity_lines_high.push(pivot_line) volume_value := math.sum(-volume, pivot_right_bars + pivot_left_bars) / (pivot_right_bars + pivot_left_bars) // Extend lines to track price movements liquidity_lines_high.extend_liquidity_lines(smoothed_value, true, volume_value) liquidity_lines_low.extend_liquidity_lines(smoothed_value, false, volume_value) // Detect changes in the trend direction bool trend_cross_up = not is_trend_up[1] and is_trend_up bool trend_cross_down = not is_trend_up and is_trend_up[1] // Reset volume counters when trend changes if ta.change(trend_cross_up) or ta.change(trend_cross_down) up_trend_volume := 0 down_trend_volume := 0 // Accumulate volume during trends if not(ta.change(trend_cross_up) or ta.change(trend_cross_down)) up_trend_volume += (close > open ? volume : 0) down_trend_volume += (close < open ? volume : 0) // Calculate average volume float avg_volume_delta = (up_trend_volume + down_trend_volume) / 2 // Determine the color of the trend color trend_color = is_trend_up ? up_trend_color : not is_trend_up ? down_trend_color : chart.fg_color // Calculate delta volume percentage string delta_volume = str.tostring(((up_trend_volume - down_trend_volume) / avg_volume_delta) * 100, format.percent) == "NaN%" ? "0%" : str.tostring(((up_trend_volume - down_trend_volume) / avg_volume_delta) * 100, format.percent) // } // PLOT ――――――――――――――――――――――――――――――――――――――――――――――――――――――――――――――――――――――――――――――――――――――――――――――――――――――――――――{ // Display labels for volume and trend statistics on the last bar if barstate.islast label.delete( label.new(bar_index + 10, smoothed_value, "Buy: " + str.tostring(up_trend_volume, format.volume) + "\n Sell: " + str.tostring(down_trend_volume, format.volume) + "\nDelta Volume: " + delta_volume, color = color.new(trend_color, 90), style = label.style_label_left, textcolor = chart.fg_color )[1]) label.delete(label.new(bar_index, smoothed_value, text = "✪", color = #00000003, textcolor = trend_color, style = label.style_label_center, size = size.large)[1]) // Plot the VIDYA trend line p1 = plot(smoothed_value, color = trend_color, linewidth = 2, style = plot.style_linebr) p2 = plot(hl2, display = display.none) // Fill between the plot and the VIDYA line fill(p1, p2, smoothed_value, hl2, color.new(trend_color, shadow ? 80 : 100), na) // Plot trend change markers (up and down arrows) plotshape( series = trend_cross_up[1] ? smoothed_value[0] : na, title = "Trend Up", style = shape.labelup, location = location.absolute, color = color.new(up_trend_color, 50), text = "▲", textcolor = chart.fg_color ) plotshape( series = trend_cross_down[1] ? smoothed_value[0] : na, title = "Trend Down", style = shape.labeldown, location = location.absolute, color = color.new(down_trend_color, 50), text = "▼", textcolor = chart.fg_color ) // }i know there one but not like this
CUSTOMIZATION
- VIDYA Length & Momentum: Control the sensitivity of the VIDYA line by adjusting the length and momentum settings, allowing traders to customize the smoothing effect to match their trading style.
- Volume Pivot Detection: Set the number of bars to consider for identifying pivots, which influences the calculation of the average volume at key levels.
- Band Distance: Adjust the band distance multiplier for controlling how far the upper and lower bands extend from the VIDYA line, based on the ATR (Average True Range).
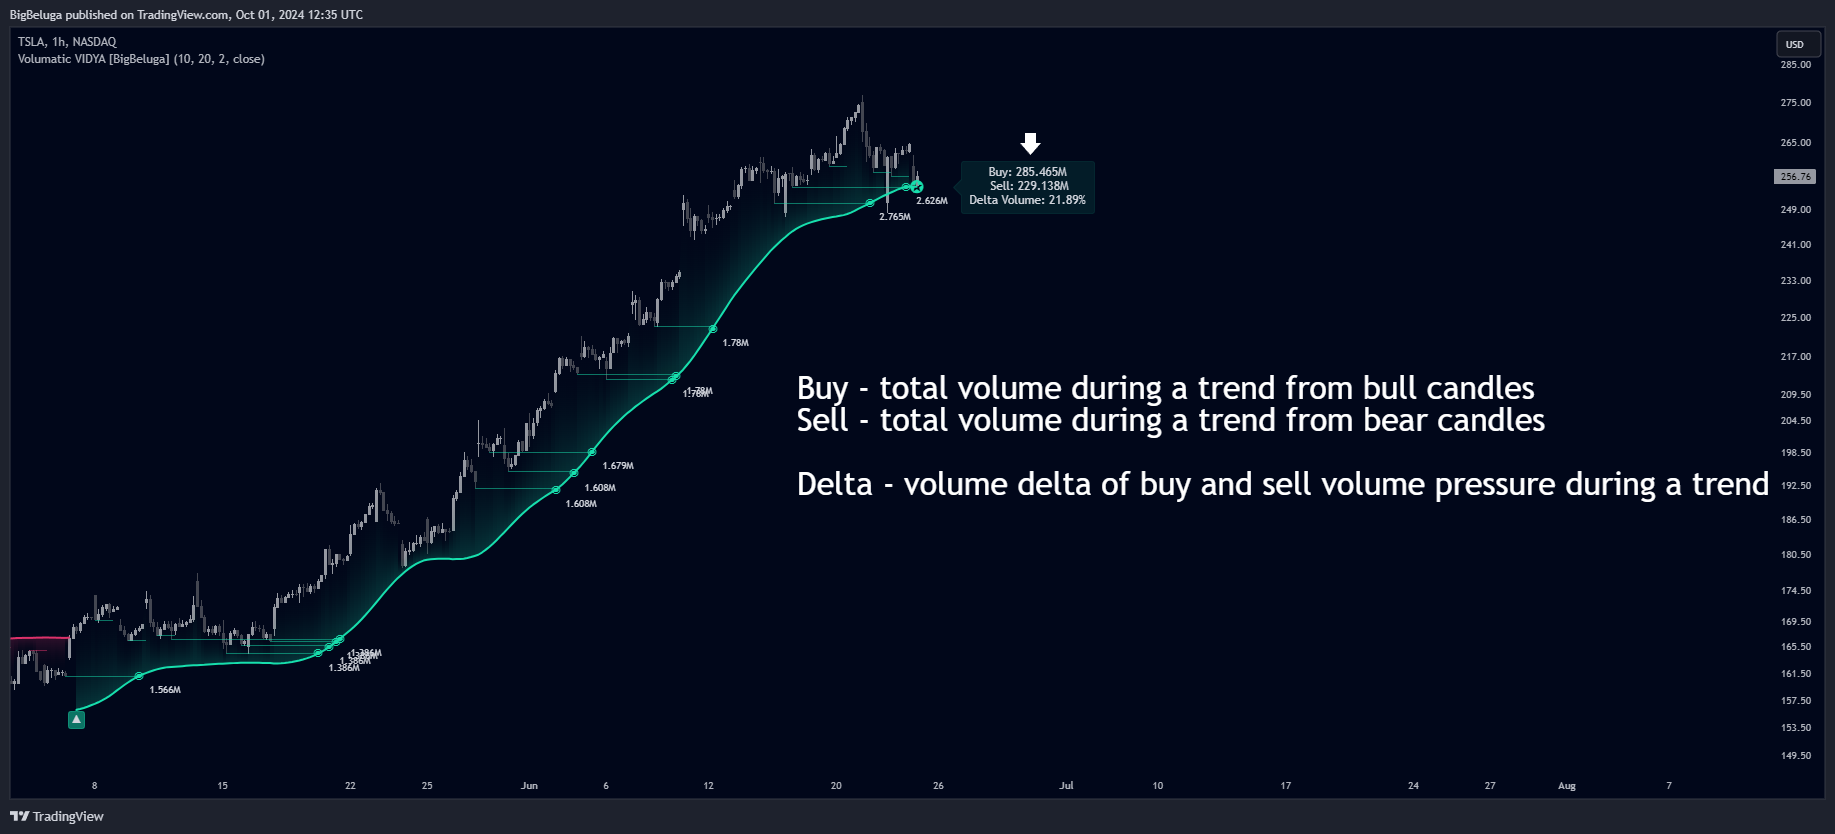
this is how the volume deltar work
// ProRealTime Code for Volumatic VIDYA with Adjustable Parameters // --- Input Parameters --- vidyaLength = 10 // VIDYA Length (lookback period for smoothing) vidyaMomentum = 20 // VIDYA Momentum (determines sensitivity to trend strength) bandMultiplier = 2 // Band distance multiplier based on ATR pivotLookback = 6 // Number of bars for identifying pivots // --- Initial Setup and Calculation --- // Calculate Chande Momentum Oscillator (CMO) //momentum = close - close[1] //sumPosMomentum = summation(max(momentum, 0), vidyaMomentum) //sumNegMomentum = summation(-min(momentum, 0), vidyaMomentum) cmo =Chandle[20](close) //abs((sumPosMomentum - sumNegMomentum) / (sumPosMomentum + sumNegMomentum) * 100) // Calculate the smoothing factor 'alpha' and apply VIDYA formula alpha = 2 / (vidyaLength + 1) vidya = alpha * cmo / 100 * close + (1 - alpha * cmo / 100) * vidya[1] // Calculate the Average True Range (ATR) for band distance atrValue = average[vidyaLength](high - low) upperBand = vidya + bandMultiplier * atrValue lowerBand = vidya - bandMultiplier * atrValue // --- Volume and Pivot Detection --- // Identify pivots (high and low) pivotHigh = highest[pivotLookback](high) pivotLow = lowest[pivotLookback](low) // Track uptrend and downtrend volume upVolume = 0 downVolume = 0 for i = 0 to pivotLookback - 1 do if close[i] > open[i] then upVolume = upVolume + volume[i] else downVolume = downVolume + volume[i] endif next // Calculate volume delta percentage avgVolume = (upVolume + downVolume) / 2 volumeDelta = ((upVolume - downVolume) / avgVolume) * 100 // --- Plotting --- // Display Volume Delta as a label at the last bar if barindex = 1 then drawtext("Volume Delta: " , barindex, close,SansSerif,bold,10)coloured(200,0,0) endif // --- RETURN Statement --- // The RETURN statement defines what is plotted on the chart. RETURN vidya AS "VIDYA Line", upperBand AS "Upper Band", lowerBand AS "Lower Band"i given it my best go
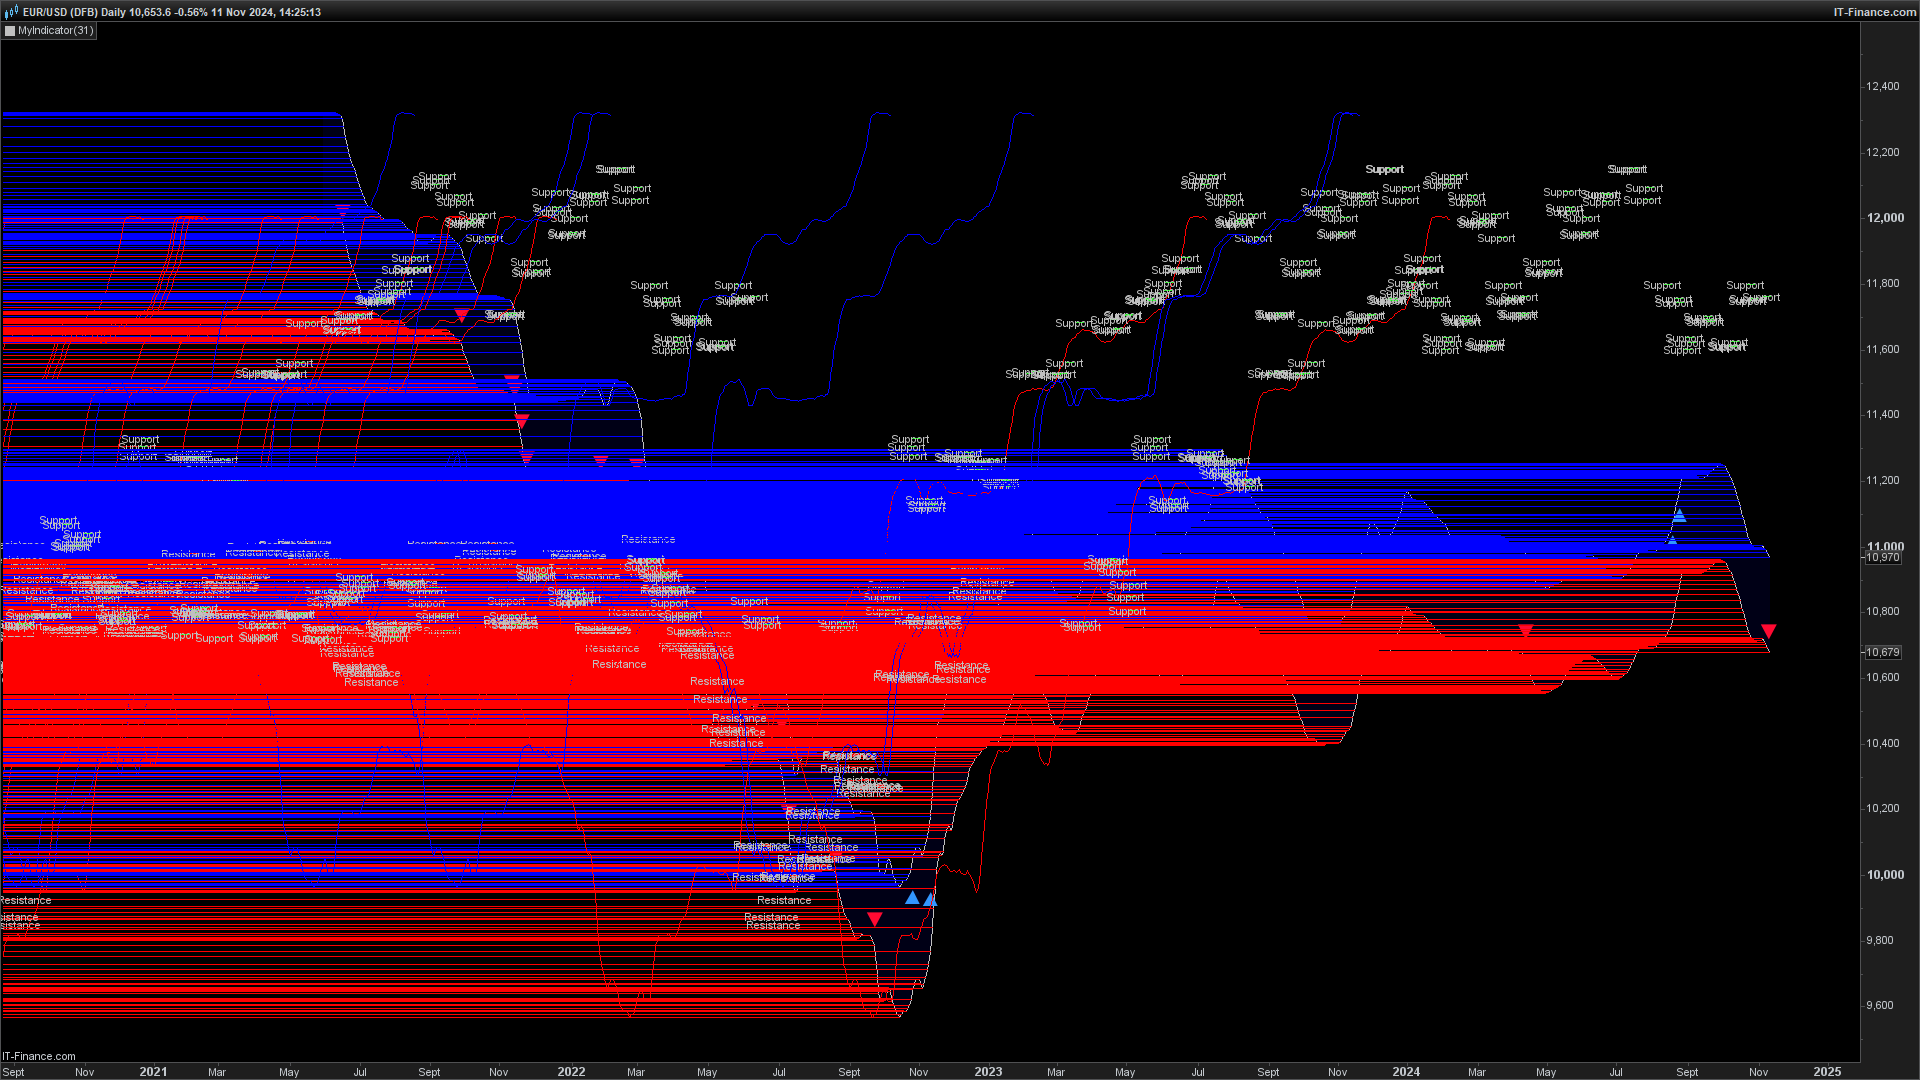
// Volumatic Variable Index Dynamic Average (VIDYA) // Parameters period = 14 vidyaLength = 10 // Length for VIDYA calculation vidyaMomentum = 20 // Momentum length for VIDYA bandDistance = 2 // Distance factor for bands pivotLeftBars = 6 // Left side pivot bars pivotRightBars = 6 // Right side pivot bars source = close // Source for VIDYA calculation CHAN = 20 // Chande Momentum Oscillator period // Initialize variables uptrend = 0 downtrend = 0 smoothedValue = 0 isTrendUp = 0 vidya = 0 // Initializing VIDYA with a default value // Calculate VIDYA if barindex > 100 then k = abs(Chandle[CHAN](close)) / 100 alfa = 2 / (period + 1) // Calculate VIDYA only if it's initialized, otherwise start it from the source if vidya = 0 then vidya = close // First calculation, set vidya to current close price else vidya = alfa * k * close + (1 - alfa * k) * vidya // Subsequent calculations endif endif // Calculate ATR and bands ATRValue = AverageTrueRange[200](close) upperBand = vidya + ATRValue * bandDistance lowerBand = vidya - ATRValue * bandDistance // Determine trend based on VIDYA bands IF close CROSSES OVER upperBand THEN isTrendUp = 1 ENDIF IF close CROSSES UNDER lowerBand THEN isTrendUp = 0 ENDIF // Calculate smoothedValue based on trend IF isTrendUp THEN smoothedValue = lowerBand ELSE smoothedValue = upperBand ENDIF // Calculate support and resistance levels using pivots supportLine = Lowest[2 * pivotLeftBars + 1](low) resistanceLine = Highest[2 * pivotLeftBars + 1](high) // Draw support and resistance lines IF low > supportLine THEN DRAWLINE(barindex[pivotRightBars], supportLine, barindex, supportLine) COLOURED(0,255,0) ENDIF IF high < resistanceLine THEN DRAWLINE(barindex[pivotRightBars], resistanceLine, barindex, resistanceLine) COLOURED(200,100,0) ENDIF // Plot trend direction arrows based on isTrendUp IF isTrendUp THEN DRAWTEXT("▲", barindex, smoothedValue - 10 * pointsize, Dialog, Bold, 10) COLOURED(200,200,0) ELSE DRAWTEXT("▼", barindex, smoothedValue + 10 * pointsize, Dialog, Bold, 10) COLOURED(200,100,0) ENDIF // Plot the VIDYA, bands, and smoothed trend line RETURN vidya AS "VIDYA", close AS "Close", upperBand AS "Upper Band", lowerBand AS "Lower Band", smoothedValue AS "Smoothed Trend Line"// Parameters period = 14 // VIDYA or moving average period for trend //vidyaMomentum = 20 // Momentum for VIDYA calculation source = close // Source for VIDYA calculation CHAN = 20 // Period for Chandle calculation bandDistance = 2.2 // Distance factor for upper/lower bands // --- Calculate the VIDYA (Variable Index Dynamic Average) --- // VIDYA Calculation IF barindex > 100 THEN k = abs(Std[CHAN](close)) / 100 alfa = 2 / (period + 1) vidya = (alfa * k * close + (1 - alfa * k) * vidya[1]) ENDIF // Calculate True Range (TR) for ATR bands TrueRange = TR (close) ATRValue = Average[200](TrueRange) // Calculate ATR for bands ATRValue = AverageTrueRange[200](close) upperBand = vidya + ATRValue * bandDistance lowerBand = vidya - ATRValue * bandDistance // Calculate cumulative volume and delta volume // Parameters for delta volume calculation upVolume = volume * (close > close[1]) // Volume for up bars downVolume = volume * (close < close[1]) // Volume for down bars cumulativeVolume = upVolume + downVolume // Calculate delta volume (percentage difference) IF cumulativeVolume <> 0 THEN deltaVolume = 100 * (upVolume - downVolume) / cumulativeVolume ELSE deltaVolume = 0 // If no volume, set deltaVolume to zero ENDIF // Draw delta volume as text on the chart if deltaVolume = 100 then DRAWTEXT("Delta",barindex,deltaVolume,SansSerif,Bold,5)coloured(0,153,0) ENDIF // Optionally, draw delta volume as a line if deltaVolume = 100 then DRAWLINE(barindex-10,deltaVolume,barindex,deltaVolume) coloured(153,0,0) ENDIF // Detect trend based on VIDYA bands trendisup = close CROSSES OVER upperBand trendisdown = close CROSSES UNDER lowerBand // Set smoothed value based on trend direction IF trendisup THEN smoothedValuel = lowerBand endif if trendisdown then smoothedValueu = upperBand ENDIF //draw mode FOR i = 0 TO barindex - 1 DO // Draw upper band segment if trend is up IF trendisup THEN DRAWSEGMENT(i, upperBand[i], i + 1, upperBand[i + 1]) COLOURED(0, 0, 255) // Blue for upper band ENDIF // Draw lower band segment if trend is down IF trendisdown THEN DRAWSEGMENT(i, lowerBand[i], i + 1, lowerBand[i + 1]) COLOURED(255, 0, 0) // Red for lower band ENDIF NEXT // Draw arrows at trend shifts IF trendisup THEN DRAWTEXT("▲", barindex, low - 12 * pointsize, SansSerif, Bold, 18) COLOURED(50, 150, 255) // Up arrow, blue ENDIF IF trendisdown THEN DRAWTEXT("▼", barindex, high + 12 * pointsize, SansSerif, Bold, 20) COLOURED(255, 10, 50) // Down arrow, red ENDIF RETURN vidya AS "VIDYA", trendisup as "tendup",trendisdown AS "trenddown" ,smoothedValuel AS "Smoothed Trend Linel",smoothedValueu AS "Smoothed Trend Lineu", upperBand AS "Upper Band", lowerBand AS "Lower Band"// Parameters for customization period = 14 CHAN = 20 // Period for Chandle calculation bandDistance = 2.0 pivotRightBars = 3 // Number of bars for the pivot point lookback lineLength = 5 // Length of the support line // Length of the support line // Initialize VIDYA (Variable Index Dynamic Average) IF barindex > 100 THEN k = ABS(Std[CHAN](close)) / 100 alfa = 2 / (period + 1) IF barindex = 1 THEN vidya = close // Initialize vidya at the first bar ELSE vidya = alfa * k * close + (1 - alfa * k) * vidya[1] ENDIF ENDIF // Calculate True Range (TR) for ATR bands TrueRange = TR(close) ATRValue = AverageTrueRange[200](close) // Calculate ATR for bands upperBand = vidya + ATRValue * bandDistance lowerBand = vidya - ATRValue * bandDistance // Conditions to enter long positions indicator1 = CALL "MyIndicator(27)" c1 = (indicator1 CROSSES under 0) // Debugging: Check if c1 is ever true IF c1 THEN DRAWTEXT("Crossed over", barindex, high) ENDIF // Iterate through each bar to find pivot lows and draw support lines when c1 is true IF c1 THEN FOR i = pivotRightBars TO barindex - pivotRightBars DO // Check if this is a pivot low (support level) IF LOW[i] < MIN(LOW[i - pivotRightBars], LOW[i + pivotRightBars]) THEN upperBand = AVERAGE[pivotRightBars](CLOSE) // Example smoothing calculation IF LOW[i] > upperBand THEN // Draw a support line at the pivot low point DRAWSEGMENT(i, LOW[i], i + lineLength, LOW[i]) COLOURED(0, 255, 0) // Green for support zone ENDIF ENDIF NEXT ENDIF // The return statement should be placed at the end RETURN upperBand as "Upper Band", lowerBand AS "Lower Band"pleses save me from this mad ness
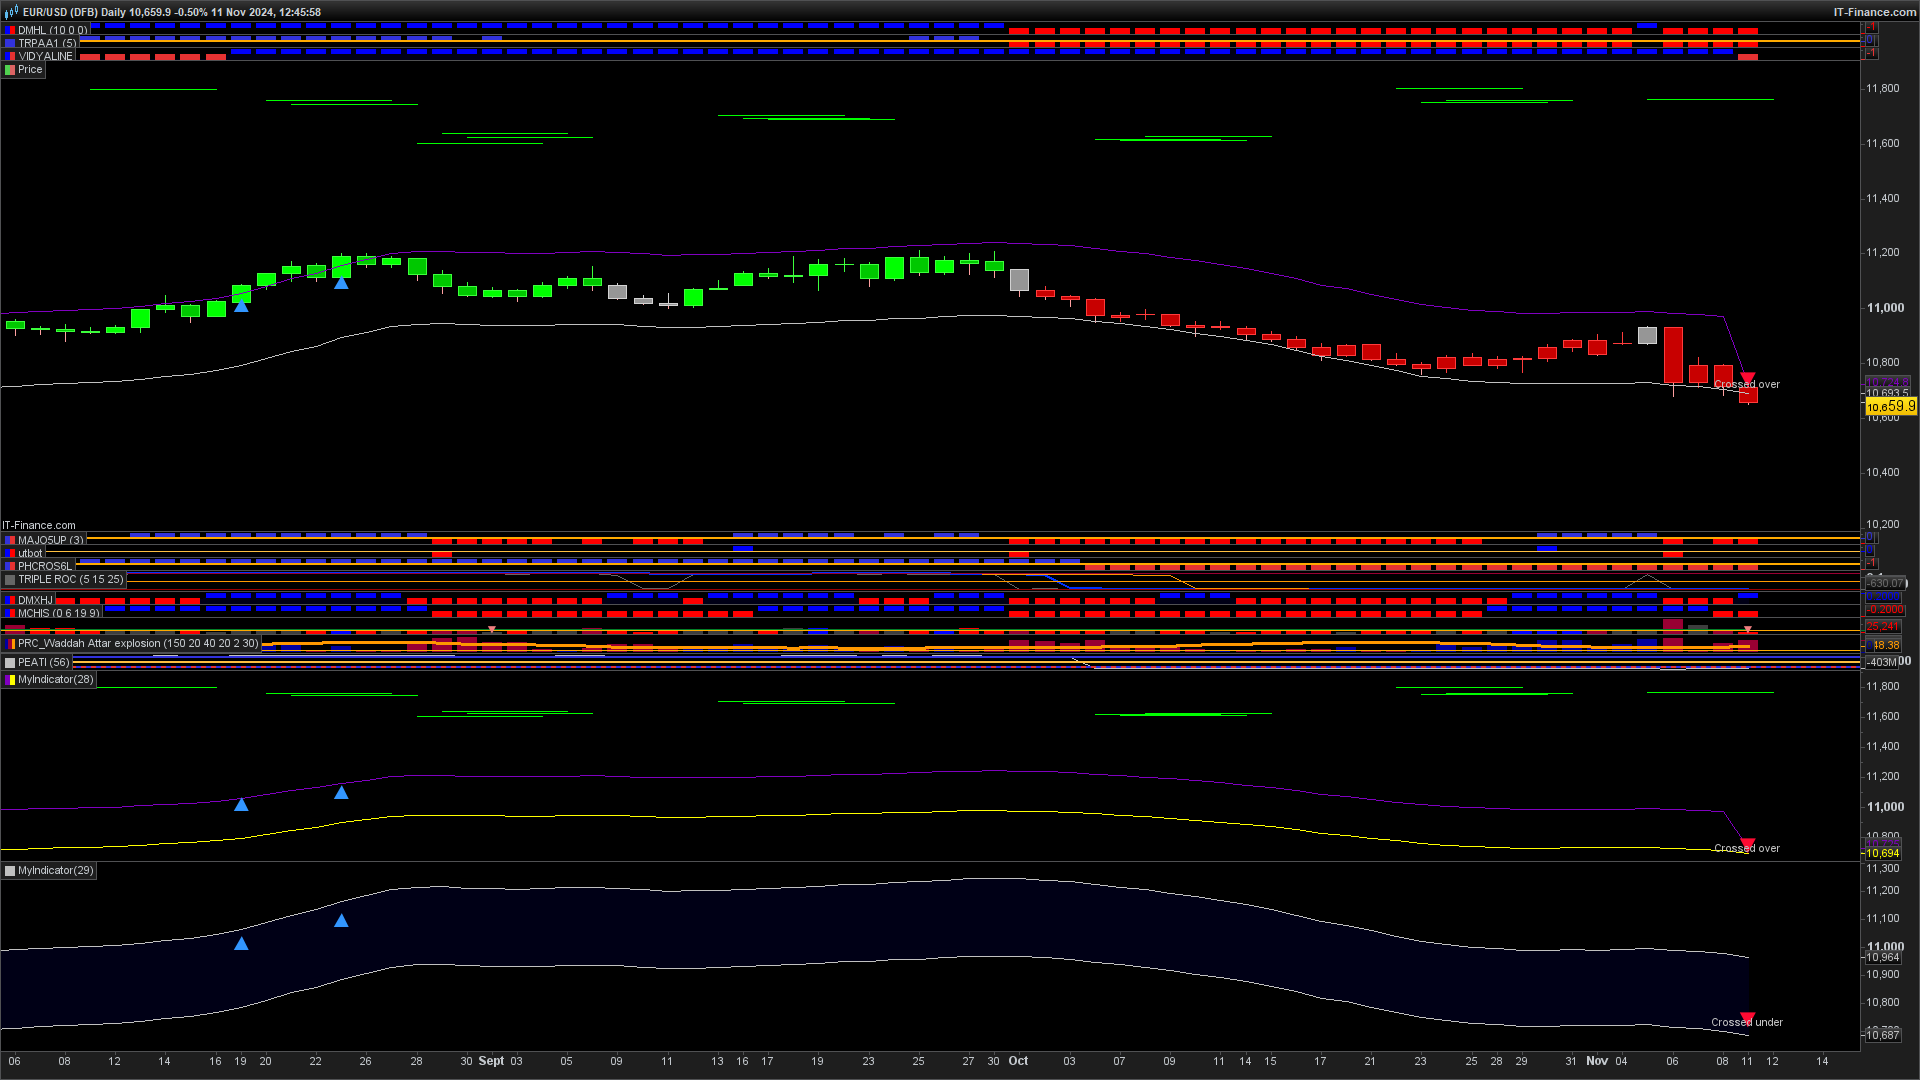
defparam drawonlastbaronly=truedefparam calculateonlastbars=1000what does that do pleses (like a child please)
defparam drawonlastbaronly=truedefparam calculateonlastbars=1000// Parameters for customization
period = 14CHAN = 20 // Period for Chandle calculationbandDistance = 2.0pivotRightBars = 3 // Number of bars for the pivot point lookbacklineLength = 5 // Length of the support line// Length of the support line// Initialize VIDYA (Variable Index Dynamic Average)IF barindex > 100 THENk = ABS(Std[CHAN](close)) / 100alfa = 2 / (period + 1)IF barindex = 1 THENvidya = close // Initialize vidya at the first barELSEvidya = alfa * k * close + (1 – alfa * k) * vidya[1]ENDIFENDIF// Calculate True Range (TR) for ATR bandsTrueRange = TR(close)ATRValue = AverageTrueRange[200](close)// Calculate ATR for bandsupperBand = vidya + ATRValue * bandDistancelowerBand = vidya – ATRValue * bandDistance// Conditions to enter long positionsindicator1 = CALL “MyIndicator(27)”c1 = (indicator1 CROSSES under 0)// Debugging: Check if c1 is ever trueIF c1 THENDRAWTEXT(“Crossed over”, barindex, high)ENDIF// Iterate through each bar to find pivot lows and draw support lines when c1 is trueIF c1 THENFOR i = pivotRightBars TO barindex – pivotRightBars DO// Check if this is a pivot low (support level)IF LOW[i] < MIN(LOW[i – pivotRightBars], LOW[i + pivotRightBars]) THENupperBand = AVERAGE[pivotRightBars](CLOSE) // Example smoothing calculationIF LOW[i] > upperBand THEN// Draw a support line at the pivot low pointDRAWSEGMENT(i, LOW[i], i + lineLength, LOW[i]) COLOURED(0, 255, 0) // Green for support zoneENDIFENDIFNEXTENDIF// The return statement should be placed at the endRETURN upperBand as “Upper Band”, lowerBand AS “Lower Band”If you put this at the beginning of the code it prevents your last photo from being unreadable:
defparam drawonlastbaronly=true
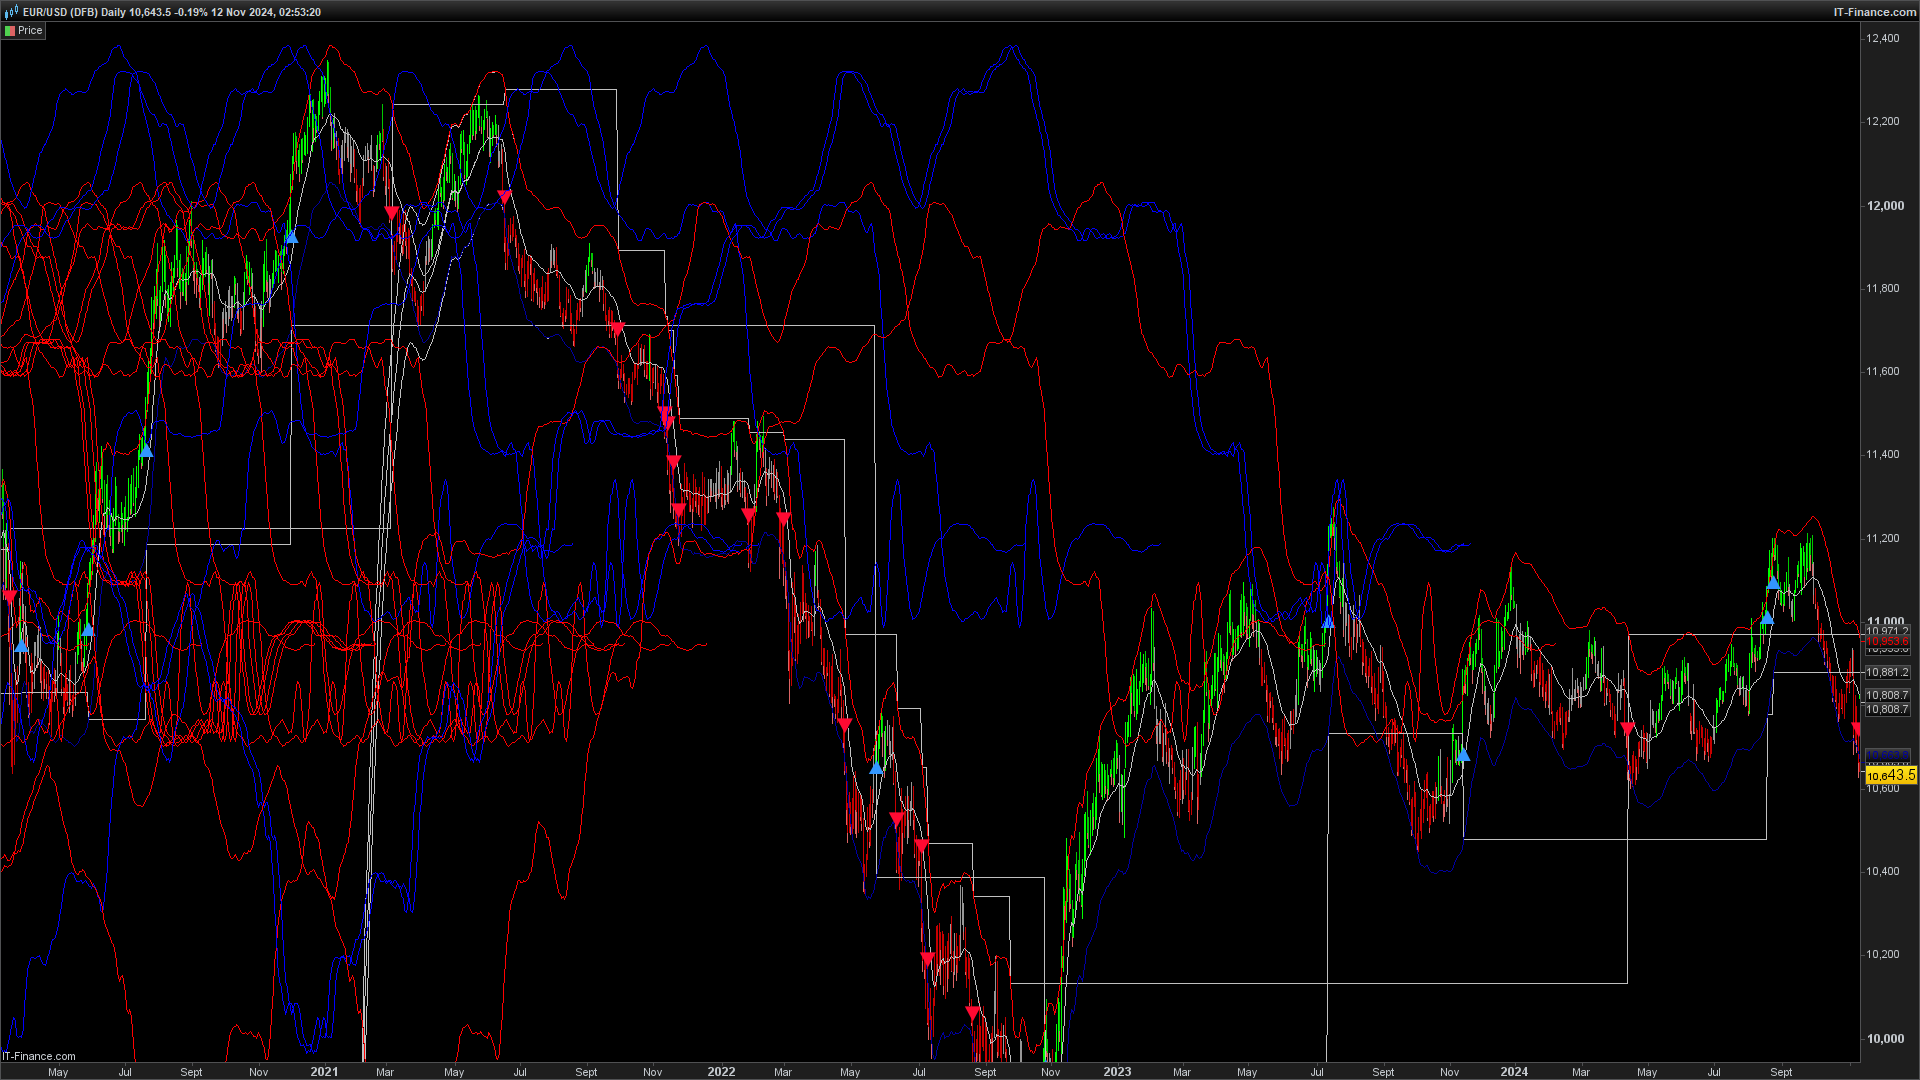
defparam calculatedlastbars=1000Patrick K Templar thanked this post// Parameters DEFPARAM drawonlastbaronly = TRUE DEFPARAM calculateonlastbars = 1000 period = 14 // VIDYA smoothing period source = close // Source for VIDYA calculation CHAN = 20 // Period for Chandle calculation bandDistance = 2.2 // Distance factor for upper/lower bands // --- Calculate the VIDYA (Variable Index Dynamic Average) --- IF barindex > 100 THEN k = abs(Std[CHAN](close)) / 100 alfa = 2 / (period + 1) vidya = (alfa * k * close + (1 - alfa * k) * vidya[1]) ENDIF // Calculate ATR for bands ATRValue = AverageTrueRange[200] upperBand = vidya + ATRValue * bandDistance lowerBand = vidya - ATRValue * bandDistance // Detect trend direction and crossovers with bands IF (close > upperBand AND close[1] <= upperBand[1]) THEN b1 = 1 b2 = 0 ELSE if close < lowerBand AND close[1] >= lowerBand[1] THEN b1 = 0 b2 = 1 ELSE b1 = 0 b2 = 0 ENDIF ENDIF // Determine the trend status (A1, A2, A3) based on crossover detection IF b1 = 1 THEN A1 = upperBand A2 = 0 A3 = 0 ELSE if b2 = 1 THEN A1 = 0 A2 = lowerBand A3 = 0 ELSE A1 = 0 A2 = 0 A3 = vidya // Set A3 to vidya when in between bands ENDIF ENDIF // Draw the VIDYA band with color for trend direction // Draw the upper and lower bands with color fills IF A1 <> 0 THEN DRAWSEGMENT(barindex - 1, upperBand[1], barindex, upperBand) COLOURED(255, 10, 10) ENDIF IF A2 <> 0 THEN DRAWSEGMENT(barindex - 1, lowerBand[1], barindex, lowerBand) COLOURED(10, 10, 255) ENDIF IF A3 <> 0 THEN DRAWSEGMENT(barindex - 1, vidya[1], barindex, vidya) COLOURED(10, 255, 10) ENDIF // Attempt to add color fill between the upper and lower bands IF upperBand <> 0 AND lowerBand <> 0 THEN //DRAWsegment {lowerBand} upperBand, COLOURED(50, 50, 150, 50) // Faint color fill ENDIF // Final RETURN statement to display the calculated trend line and bands RETURN upperBand AS "Upper Band", lowerBand AS "Lower Band", vidya AS "VIDYA"i know it can be done i just dont know how or what some things are doing
IF cumulativeVolume <> 0 THEN deltaVolume = 100 * (upVolume - downVolume) / cumulativeVolume ELSE deltaVolume = 0 // If no volume, set deltaVolume to zero ENDIF // Draw delta volume as text on the chart if deltaVolume = 100 then DRAWTEXT("Delta",barindex,deltaVolume,SansSerif,Bold,5)coloured(0,153,0) ENDIF // Optionally, draw delta volume as a line if deltaVolume = 100 then DRAWLINE(barindex-10,deltaVolume,barindex,deltaVolume) coloured(153,0,0) ENDIF // Detect trend based on VIDYA bands trendisup = close CROSSES OVER upperBand trendisdown = close CROSSES UNDER lowerBand // Set smoothed value based on trend direction IF trendisup THEN smoothedValuel = lowerBand endif if trendisdown then smoothedValueu = upperBand ENDIF //draw mode FOR i = 0 TO barindex - 1 DO // Draw upper band segment if trend is up IF trendisup THEN DRAWSEGMENT(i, upperBand[i], i + 1, upperBand[i + 1]) COLOURED(0, 0, 255) // Blue for upper band ENDIF // Draw lower band segment if trend is down IF trendisdown THEN DRAWSEGMENT(i, lowerBand[i], i + 1, lowerBand[i + 1]) COLOURED(255, 0, 0) // Red for lower band ENDIF NEXT // Draw arrows at trend shifts IF trendisup THEN DRAWTEXT("▲", barindex, low - 12 * pointsize, SansSerif, Bold, 18) COLOURED(50, 150, 255) // Up arrow, blue ENDIF IF trendisdown THEN DRAWTEXT("▼", barindex, high + 12 * pointsize, SansSerif, Bold, 20) COLOURED(255, 10, 50) // Down arrow, red ENDIF RETURN vidya AS "VIDYA", trendisup as "tendup",trendisdown AS "trenddown" ,smoothedValuel AS "Smoothed Trend Linel",smoothedValueu AS "Smoothed Trend Lineu", upperBand AS "Upper Band", lowerBand AS "Lower Band"Hola. Os paso mi versión:Hi. Here is my version:
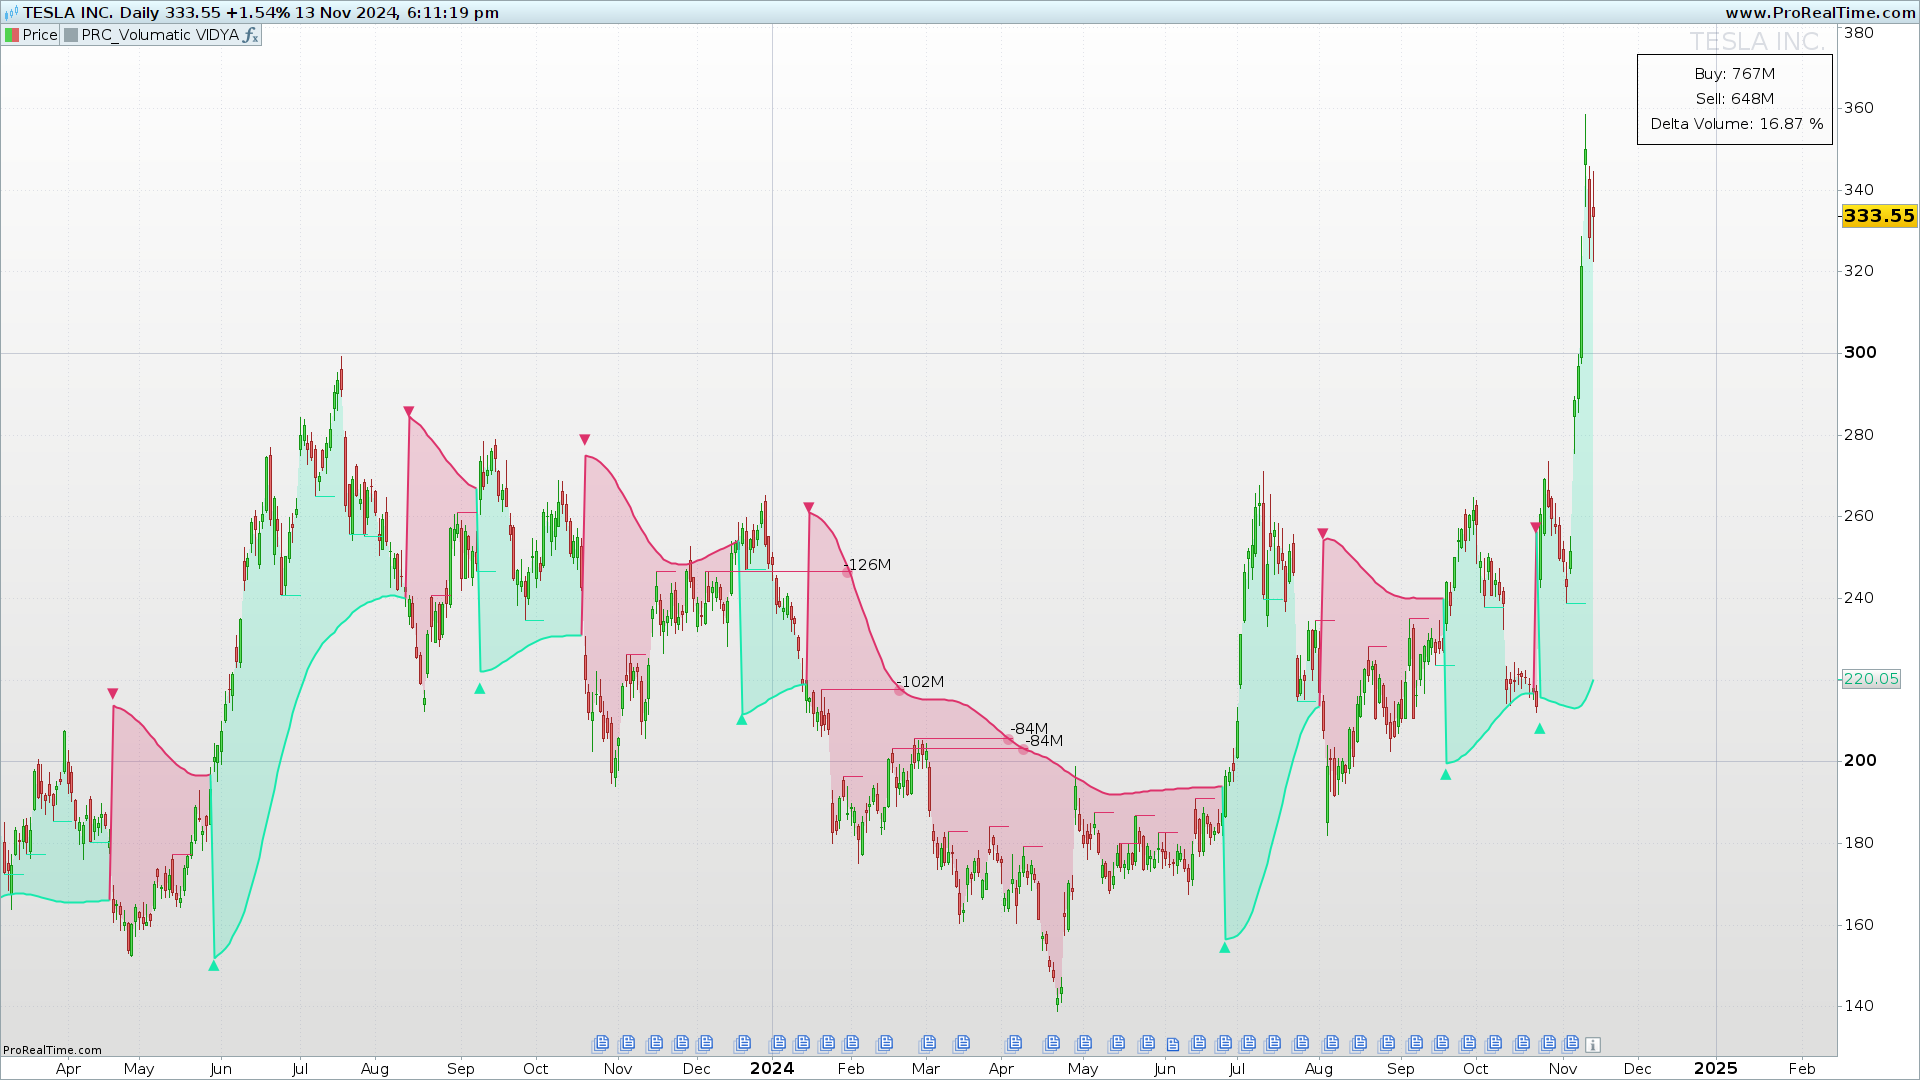
//------------------------------------------//
//PRC_Volumatic VIDYA
//version = 0
//13.11.2024
//Iván González @ www.prorealcode.com
//Sharing ProRealTime knowledge
//------------------------------------------//
//Inputs
//------------------------------------------//
vidyaLength=10
vidyaMomentum=20
bandDistance=2
prd=3
src=close
//------------------------------------------//
// ATR
//------------------------------------------//
atrvalue=averagetruerange[200](close)
//------------------------------------------//
// VIDYA - Variable INdex Dynamic Average
//------------------------------------------//
mom=src-src[1]
PosMon=mom>=0
NegMon=mom<0
sumPosMom=summation[vidyaMomentum](mom*PosMon)
sumNegMom=summation[vidyaMomentum](-mom*NegMon)
once vidyaValue=src
if barindex>20 then
absCmo=abs(100*(sumPosMom-sumNegMom)/(sumPosMom+sumNegMom))
alpha=2/(vidyaLength+1)
vidyaValue=alpha*absCmo/100*src+(1-alpha*abscmo/100)*(vidyaValue[1])
SMAvidyaValue=average[15](vidyaValue)
endif
//------------------------------------------//
// Upper & Lower Bands
//------------------------------------------//
upperBand=SMAvidyaValue+atrvalue*bandDistance
lowerBand=SMAvidyaValue-atrvalue*bandDistance
//------------------------------------------//
// Trend Direction
//------------------------------------------//
if src crosses over upperband then
r=23
g=233
b=173
isTrendUp=1
elsif src crosses under lowerband then
r=221
g=50
b=107
isTrendUp=0
endif
//Set Trend-based smoothing variable
if isTrendUp then
SmoothedValue=lowerBand
if isTrendUp<>isTrendUp[1] then
drawtext("▲",barindex,SmoothedValue-0.15*tr)coloured(r,g,b)
endif
elsif isTrendUp=0 then
SmoothedValue=upperBand
if isTrendUp<>isTrendUp[1] then
drawtext("▼",barindex,SmoothedValue+0.15*tr)coloured(r,g,b)
endif
endif
//------------------------------------------//
// Pivot Highs & Low
//------------------------------------------//
//Pivot high
src1=high
ph1 = src1 < src1[prd]
ph2 = highest[prd](src1) < src1[prd]
ph3 = src1[prd] > highest[prd](src1)[prd+1]
if ph1 and ph2 and ph3 then
$pivotH[t+1] = src1[prd]
$pivotHx[t+1] = barindex[prd]
t=t+1
endif
//Pivot Low
src2=close
pl1 = src2 > src2[prd]
pl2 = lowest[prd](src2) > src2[prd]
pl3 = src2[prd] < lowest[prd](src2)[prd+1]
if pl1 and pl2 and pl3 then
$pivotL[z+1] = src2[prd]
$pivotLx[z+1] = barindex[prd]
z=z+1
endif
//------------------------------------------//
// Lines for Support Zones
//------------------------------------------//
if low[prd]>smoothedValue and z<>z[1] then
rr=23
gg=233
bb=173
drawsegment(barindex[prd],low[prd],barindex[prd]+5,low[prd])coloured(rr,gg,bb)
volumeValue=summation[prd+prd](volume)/(prd+prd)
$LineLowx1[n+1]=barindex[prd]
$LineLowy1[n+1]=low[prd]
n=n+1
endif
if n>0 then
for i=0 to n-1 do
priceCross=smoothedValue>$LineLowy1[i] and smoothedValue[1]<=$LineLowy1[i]
isShortLine=barindex-$LineLowx1[i]<50
if priceCross and isShortLine and isTrendUp=isTrendUp[1] then
$LineLowx2[i]=barindex
drawtext("●",barindex[1],$LineLowy1[i])coloured(rr,gg,bb,100)
drawsegment($LineLowx1[i],$LineLowy1[i],$LineLowx2[i],$LineLowy1[i])coloured(rr,gg,bb)
drawtext("#VolumeValue#",barindex+5,$LineLowy1[i]-0.25*tr)
endif

next
endif
//------------------------------------------//
// Lines for Resistance Zones
//------------------------------------------//
if high[prd]<smoothedValue and t<>t[1] then
rr=221
gg=50
bb=107
drawsegment(barindex[prd],high[prd],barindex[prd]+5,high[prd])coloured(rr,gg,bb)
volumeValue=summation[prd+prd](-volume)/(prd+prd)
$LineHighx1[p+1]=barindex[prd]
$LineHighy1[p+1]=high[prd]
p=p+1
endif
if p>0 then
for i=0 to p-1 do
priceCross=smoothedValue<$LineHighy1[i] and smoothedValue[1]>=$LineHighy1[i]
isShortLine=barindex-$LineHighx1[i]<50
if priceCross and isShortLine and isTrendUp=isTrendUp[1] then
$LineHighx2[i]=barindex
drawtext("●",barindex[1],$LineHighy1[i])coloured(rr,gg,bb,100)
drawsegment($LineHighx1[i],$LineHighy1[i],$LineHighx2[i],$LineHighy1[i])coloured(rr,gg,bb)
drawtext("#VolumeValue#",barindex+5,$LineHighy1[i]+0.25*tr)
endif

next
endif
colorbetween((high+low)/2,smoothedValue,r,g,b,50)
//------------------------------------------//
// Plot Volume and trend on the last bar
//------------------------------------------//
trendCrossUp=isTrendUp[1]=0 and isTrendUp
trendCrossDown=isTrendUp[1] and isTrendUp=0

if trendCrossUp<>trendCrossUp[1] or trendCrossDown<>trendCrossDown[1] then
upTrendVolume=0
downTrendVolume=0
else
if close>open then
upTrendVolume=volume+upTrendVolume
else
upTrendVolume=upTrendVolume
endif
if close<open then
downTrendVolume=volume+downTrendVolume
else
downTrendVolume=downTrendVolume
endif
endif
avgVolumeDelta=(upTrendVolume+downTrendVolume)/2

//Calculate delta Volume percentage
if avgVolumeDelta<>0 then
deltaVolume=round((upTrendVolume-downTrendVolume)/avgVolumeDelta*100,2)
endif
if islastbarupdate then

drawtext("Buy: #upTrendVolume#",-100,-50)anchor(topright,xshift,yshift)
drawtext("Sell: #downTrendVolume#",-100,-75)anchor(topright,xshift,yshift)
drawtext("Delta Volume: #deltaVolume#%",-100,-100)anchor(topright,xshift,yshift)
drawrectangle(-200,-30,-5,-120)anchor(topright,xshift,yshift)

endif
//------------------------------------------//
return SmoothedValue coloured(r,g,b)style(line,2)
Patrick K Templar and Nicolas thanked this post -
AuthorPosts


- You must be logged in to reply to this topic.
could you pleases covert this code from “Volumatic Variable Index Dynamic Aver
ProBuilder: Indicators & Custom Tools
Author
Summary
This topic contains 17 replies,
has 5 voices, and was last updated by ![]() roccafragius
roccafragius
1 year, 2 months ago.
Topic Details
| Forum: | ProBuilder: Indicators & Custom Tools |
| Language: | English |
| Started: | 11/10/2024 |
| Status: | Active |
| Attachments: | 11 files |
About personal data collected
The information collected on this form is stored in a computer file by ProRealCode to create and access your ProRealCode profile. This data is kept in a secure database for the duration of the member's membership. They will be kept as long as you use our services and will be automatically deleted after 3 years of inactivity. Your personal data is used to create your private profile on ProRealCode. This data is maintained by SAS ProRealCode, 407 rue Freycinet, 59151 Arleux, France. If you subscribe to our newsletters, your email address is provided to our service provider "MailChimp" located in the United States, with whom we have signed a confidentiality agreement. This company is also compliant with the EU/Swiss Privacy Shield, and the GDPR. For any request for correction or deletion concerning your data, you can directly contact the ProRealCode team by email at privacy@prorealcode.com If you would like to lodge a complaint regarding the use of your personal data, you can contact your data protection supervisory authority.