Dear ProRealCode,
I was wondering if it’s possible to code a correlation coefficient between volume and price?
My first thought was to code some kind of loop for getting (x[i]-avereage[n](x)).
Unfortunately I keep getting wrong result in relation to my own manual work.
Can somebody please help me with what I think is a relative simple code. 🙂
Hi Lars,
Yes it’s possible, but quite difficult to find how if you don’t already have made a formula for it. Since Volume and price don’t share the same “scale”.. Are you talking about Pearson R Correlation?
Hi Nicolas,
It was exactly what I was having in mind. My first thought was to take development in price correlated with development in volume. It could be % increase/ decrease in price correlated with % increase/decrease in volume.
I think you are looking for things that already exist. You should have a look at indicators already made that use volumes in their own calculations: OBV, volume ROC, etc..
For me there is a difference between those indicators you mention. ROC behave in a similar way but doesn’t take volume into consideration. I will be grateful if you can help me code the Pearson correlation coefficient! 🙂
Well, this is 2 very different time series. Price never reset to zero as Volume do each day. So I assume the best way to do would be to reckon up price as long as volumes, average these 2 values and then doing comparison with a pseudo correlation coefficient formula. IMO, I don’t believe we are going somewhere, but we could give it a try.
I tried it on Tradingview, and my simple code seems to work. Their platform have the function correlation built-in so it was easy relative to PRT which doesn’t have it.
x = close/close[1]-1
y = volume/volume[1]-1
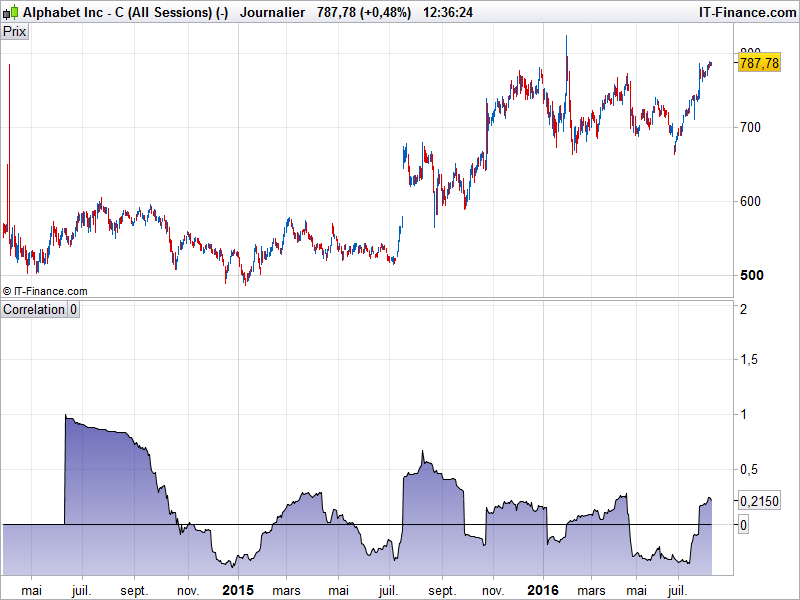
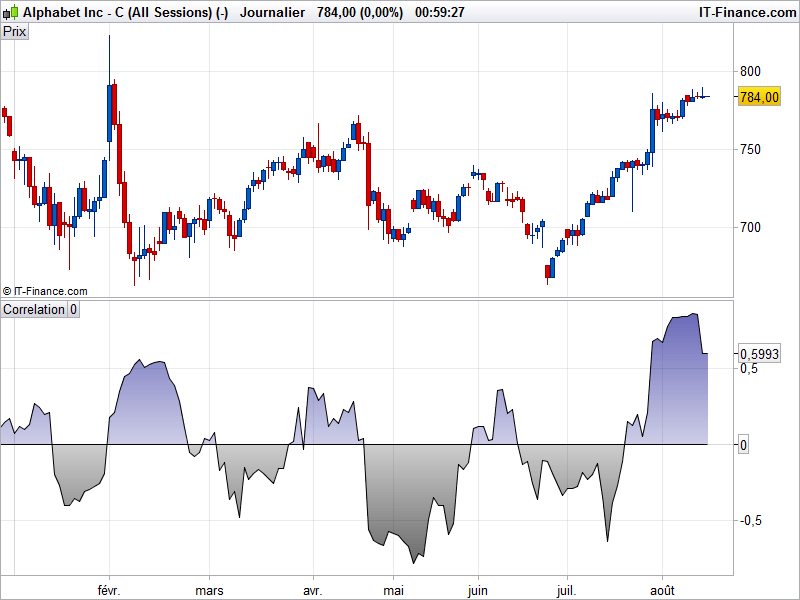
The interpretation of the correlation between x and y:
Positive correlation – sign of stregnth
Negative correlation – sign of weakness
It was my first thought of this indicator.
Hi Lars,
I’ll do my best to make a function for correlation calculation. That way it would be helpful to re-use it for future purposes. It involved a lot of work and I’m actually very busy with my prog services customers. I’ll get back to you ASAP.
Hi,
Maybe something like this would do the trick. It’s far from a direct calculation though..
Please not that you need to change the period of lookback for calculation of the correlation coefficient at the beginning of the code (50 periods by default).
period = 50

if barindex>period then

 X = ABS(close/close[1])
 Y = ABS(volume/volume[1])

 meanX = average[period](x)
 meanY = average[period](y)

 a = X-meanX
 b = Y-meanY

 sqA = summation[period](square(a))
 sqB = summation[period](square(b))

 R = summation[period](a*b)/sqrt(sqA*sqB)
endif

RETURN R as "Correlation", 0 as "0"
Actually I have coded something similar but as you correctly stated it is not the correct way of calculation. It gives some lagging signals compared to the indicator in Tradingview.
After your post I got the idea to rewrite the Pearson correlation equation and I might have come up with the correct way of calculation. Can you confirm my assertion?
period = 20

if barindex>period then

X = close/close[1]-1
Y = volume/volume[1]-1

meanX = average[period](x)
meanY = average[period](y)
meanXY = average[period](x*y)


meanSqX = average[period](square(X))
meanSqY = average[period](square(Y))

R = ((meanXY-meanX*meanY)/(sqrt(meanSqX-square(meanX))*sqrt(meanSqY-square(meanY))))
endif

RETURN R as "Correlation", 0 as "0"
I don’t think you make it the correct way. It needs standard deviation calculation (a and b variables from my formula). I also don’t understand why you are using average instead of summation of the whole datas?
Well, I’ll try differently later, I’m done for today 🙂
My formula is based on the attached image but I don’t know if I have put it together the right way.
Looking forward to hear from you 🙂
I think I finally got it right now. Seems that TV has a wrong formula explanation in its own documentation.. Well here is the code:
period = 12

if barindex>period then

 X = (close/close[1])
 Y = (volume/volume[1])

 sqX = square(X)
 sqY = square(Y)

 varianceX = average[period](sqX)-(average[period](X)*average[period](X))
 varianceY = average[period](sqY)-(average[period](Y)*average[period](Y))

 covariance = (summation[period]((X-average[period](X))*(Y-average[period](Y))))/period

 correlation = covariance/SQRT(varianceX*varianceY)

endif

RETURN correlation as "Correlation", 0 as "0"
Do you have any example for comparing with the TV result on the same instrument/timeframe?
Sorry for the late answer which is caused by my vacation. The way you calculate the correlation does not provide my with the correct result compared to me manual calculation. The way I ended up with gives me almost the correct result despite from some decimals.
Hi Nicholas, I’m Domenico. The Pearson R Correlation is a measure of the linear correlation between two variables Xand Y. It has a value between +1 and −1, where 1 is total positive linear correlation, 0 is no linear correlation, and −1 is total negative linear correlation. But I have tryed your code and it has values greater than 1. Can you help me, please?