Bonjour à tous
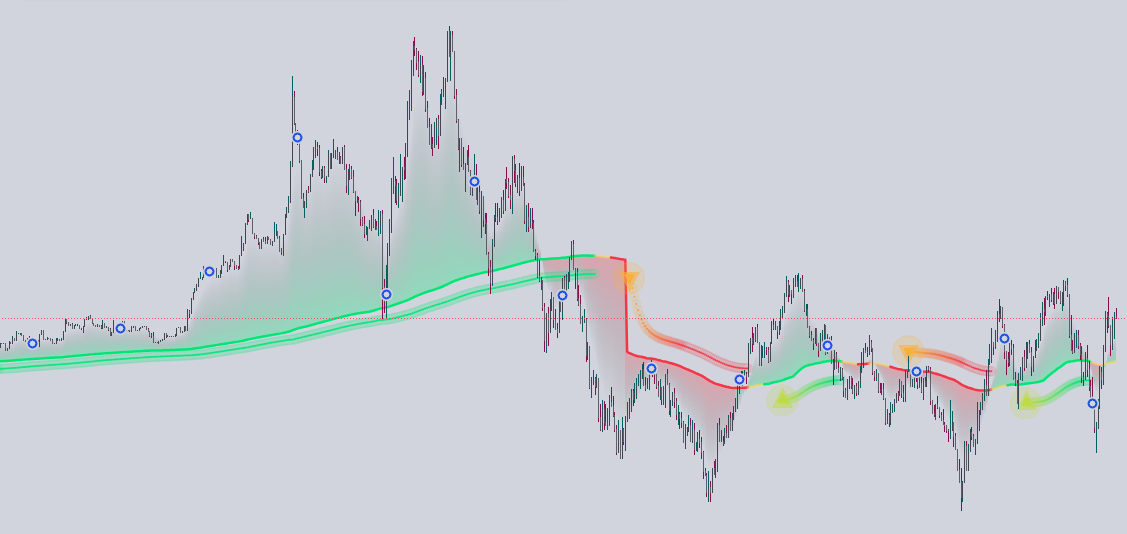
Je souhaiterais convertir cette indicateur tradingvew ” Auto-length moving average + trend signal” merci pour votre aide 🙂
voici le code originale:
// This work is licensed under a Attribution-NonCommercial-ShareAlike 4.0 International (CC BY-NC-SA 4.0) https://creativecommons.org/licenses/by-nc-sa/4.0/
// © Zeiierman {
//@version=6
indicator(“Auto-Length Moving Average + Trend Signals (Zeiierman)”, overlay=true, max_lines_count=500, max_bars_back=500, max_boxes_count=500)
//~~}
// ~~ Tooltips {
var string tt_baseLen = “Controls the starting length of the moving average. A smaller value reacts faster to price changes, while a smallr value provides smoother results.”
var string tt_maxDynLen = “Limits how much the dynamic moving average can expand. A smallr value allows more flexibility in trend adaptation, while a smaller value keeps it more rigid.”
var string tt_counterbreak = “Defines the maximum count before triggering a trend reset. If ‘Reverse Counter After Break’ is enabled, the counter starts decreasing after reaching this value.”
var string tt_reverseCounter = “If enabled, the counter will reverse direction when it reaches the ‘Counter Break’ threshold, causing the MA length to contract instead of continuously expanding.”
var string tt_trending_col = “Specifies the minimum number of consecutive bars required to confirm a trend. A higher value filters out short-term fluctuations, ensuring only sustained trends are recognized.”
var string tt_resetConditionType = “Determines when the dynamic moving average resets based on market conditions. Options include slope change, RSI thresholds, volume spikes, Bollinger band breaks, MACD crossovers, Stochastic levels, CCI deviations, momentum shifts, or no reset at all.”
var string tt_slopeOB = “Specifies how many bars back to compare the MA slope for resets. A higher value smooths out short-term fluctuations, while a lower value makes resets more frequent.”
var string tt_rsiLength = “Defines the number of bars for the RSI calculation. A higher value produces a smoother RSI, while a lower value makes it more reactive.”
var string tt_rsiOB = “Sets the overbought and oversold levels for RSI-based resets. If RSI exceeds this level, the trend is considered strong and may trigger a reset.”
var string tt_volSmaLength = “Defines the length of the volume moving average. Used to detect volume-based resets when price activity increases significantly.”
var string tt_bbLength = “Defines the lookback period for Bollinger Bands. A higher value results in smoother bands, reducing sensitivity to short-term fluctuations.”
var string tt_bbMult = “Controls the width of the Bollinger Bands. A smallr multiplier creates wider bands, capturing more price movement.”
var string tt_macdFast = “Specifies the length of the fast-moving EMA in the MACD calculation. A shorter length increases responsiveness.”
var string tt_macdSlow = “Specifies the length of the slow-moving EMA in the MACD calculation. A longer length provides a smoother trend signal.”
var string tt_macdSignal = “Defines the signal line length for MACD crossovers, affecting how quickly signals respond to price changes.”
var string tt_stochLength = “Sets the lookback period for the Stochastic oscillator. A shorter period increases sensitivity, while a longer one smooths out signals.”
var string tt_stochOB = “Defines the overbought/oversold levels for Stochastic-based resets. If the indicator exceeds these levels, a reset may be triggered.”
var string tt_cciLength = “Specifies the period for the Commodity Channel Index (CCI). A higher value produces smoother results, while a lower value increases responsiveness.”
var string tt_cciOB = “Sets the threshold for CCI-based resets. If CCI moves beyond this level, the trend strength is considered extreme.”
var string tt_momentumLength = “Defines the period for momentum calculations. A shorter value reacts more quickly to trend shifts, while a longer value provides more stability.”
var string tt_showLabels = “Toggles whether numerical labels are displayed for key levels on the chart.”
var string tt_showLines = “Enables or disables the visualization of dynamic lines in the indicator.”
var string tt_labelOffset = “Adjusts the vertical position of labels to prevent overlap with price action.”
var string tt_upColor = “Sets the color for bullish signals and uptrends.”
var string tt_dnColor = “Sets the color for bearish signals and downtrends.”
var string tt_length = “Defines the length of the smoothing function for the moving average. A higher value results in smoother data, filtering out short-term fluctuations.”
var string tt_trendSmoothing = “Controls how much past values influence the moving average’s responsiveness to price changes. A higher value creates a smoother trend line, reducing short-term noise.”
var string trending_fal = “Determines how many bars are required to classify a trend as trending. Higher values reduce noise, but may delay trend detection.”
var string tt_up_col = “Specifies the color for bullish trend signals.”
var string tt_dn_col = “Specifies the color for bearish trend signals.”
var string tt_neutral_col = “Specifies the color for neutral or ranging conditions.”
//~~~~~~~~~~~~~~~~~~~~~~~~~~~~~~~~~~~~~~~~~~~~~~~~~~~~~~~~~~~~~~~~~~~~~~~~~~~~~~}
// ~~ INPUTS {
// ~~ DYNAMIC MA INPUTS {
src = close
baseLen = input.int(50, title=”Base MA Length”, minval=1, group=”Dynamic MA”, tooltip=tt_baseLen)
maxDynLen = input.int(350, title=”Max Dynamic Length”, minval=1, group=”Dynamic MA”, tooltip=tt_maxDynLen)
counterbreak = input.int(70, title=”Counter Break (Reverse Threshold)”, minval=1, group=”Dynamic MA”, tooltip=tt_counterbreak)
reverseCounter = input.bool(false, title=”Reverse Counter After Break”, group=”Dynamic MA”, tooltip=tt_reverseCounter)
trending_col = input.int(10, title=”Trend Confirmation Length”, minval=1, group=”Dynamic MA”, tooltip=tt_trending_col)
upcol = input.color(color.lime, title=””, inline=”dyn”,group=”Dynamic MA”)
dncol = input.color(color.red, title=””, inline=”dyn”,group=”Dynamic MA”)
neucol = input.color(color.new(color.yellow,50), title=””, inline=”dyn”,group=”Dynamic MA”)
//~~}
// ~~ DYNAMIC RESET MODE {
resetConditionType = input.string(“Slope”, “Reset Condition Type”,
options=[“Slope”, “RSI”, “Volume”, “Bollinger”, “MACD”, “Stochastic”, “CCI”, “Momentum”, “None”],
group=”Dynamic Reset Mode”, tooltip=tt_resetConditionType)
//~~}
// ~~ SLOPE SETTINGS {
slopeOB = input.int(50, title=”Slope Length”, minval=1, group=”Slope”, tooltip=tt_slopeOB)
//~~}
// ~~ RSI SETTINGS {
rsiLength = input.int(14, title=”RSI Length”, minval=1, group=”RSI”, tooltip=tt_rsiLength)
rsiOB = input.float(60, title=”RSI Overbought/Oversold”, minval=1, inline=”rsi”,group=”RSI”)
rsiOS = input.float(40, title=””, minval=1, inline=”rsi”, group=”RSI”, tooltip=tt_rsiOB)
//~~}
// ~~ VOLUME SETTINGS {
volSmaLength = input.int(20, title=”Volume SMA Length”, minval=1, group=”Volume”, tooltip=tt_volSmaLength)
//~~}
// ~~ BOLLINGER BANDS SETTINGS {
bbLength = input.int(200, title=”Bollinger Length”, minval=1, group=”Bollinger”, tooltip=tt_bbLength)
bbMult = input.float(1.1, title=”Bollinger Multiplier”, minval=0.1, group=”Bollinger”, tooltip=tt_bbMult)
//~~}
// ~~ MACD SETTINGS {
macdFast = input.int(50, title=”MACD Fast Length”, minval=1, group=”MACD”, tooltip=tt_macdFast)
macdSlow = input.int(100,title= “MACD Slow Length”, minval=1, group=”MACD”, tooltip=tt_macdSlow)
macdSignal = input.int(25, title=”MACD Signal Length”, minval=1, group=”MACD”, tooltip=tt_macdSignal)
//~~}
// ~~ STOCHASTIC SETTINGS {
stochLength = input.int(50, title=”Stochastic Length”, minval=1, group=”Stochastic”, tooltip=tt_stochLength)
stochOB = input.float(60, title=”Stochastic Overbought/Oversold”, minval=1, inline=”Stochastic”, group=”Stochastic”)
stochOS = input.float(40, title=””, group=”Stochastic”, minval=1, inline=”Stochastic”, tooltip=tt_stochOB)
//~~}
// ~~ CCI SETTINGS {
cciLength = input.int(100, title=”CCI Length”, minval=1, group=”CCI”, tooltip=tt_cciLength)
cciOB = input.float(10, title=”CCI Overbought/Oversold”, minval=1, inline=”CCI”, group=”CCI”)
cciOS = input.float(-10,title= “”, minval=-500, group=”CCI”, inline=”CCI”, tooltip=tt_cciOB)
//~~}
// ~~ MOMENTUM SETTINGS {
momentumLength = input.int(140, title=”Momentum Length”, minval=1, group=”Momentum”, tooltip=tt_momentumLength)
//~~}
// ~~ TREND SETTINGS {
length = input.int(20, title=”Trend smoother”, minval=1, group=”Trend & Signals”, tooltip=tt_length)
trendSmoothing = input.float(0.8, title=”Smoothing Weight”, minval=0.1, maxval=1.0, step=0.01, group=”Trend & Signals”,tooltip=tt_trendSmoothing)
trending = input.int(20, title=”Trending Periods”, minval=1, group=”Trend & Signals”, tooltip=trending_fal)
trendUp_col = input.color(color.lime, title=””, inline=”color”, group=”Trend & Signals”,tooltip=tt_up_col)
trendDn_col = input.color(color.red, title=””, inline=”color”, group=”Trend & Signals”,tooltip=tt_dn_col)
grad_col = input.color(color.yellow,title= “”, inline=”color”, group=”Trend & Signals”,tooltip=tt_neutral_col)
//~~}
// ~~ TABLE SETTINGS {
showGuidanceTable = input.bool(true, title=”Show Reset Mode Guidance Table”, group=”Table Display Settings”)
trendStrengthTable = input.bool(true, title=”Show Trend Strength Table”, group=”Table Display Settings”)
//~~~~~~~~~~~~~~~~~~~~~~~~~~~~~~~~~~~~~~~~~~~~~~~~~~~~~~~~~~~~~~~~~~~~~~~~~~~~~~}
// ~~ CALCULATE INDICATORS {
// RSI
rsiValue = ta.rsi(src, rsiLength)
// Volume SMA
volSMA = ta.wma(volume, volSmaLength)
// MACD
[macdLine, signalLine, _] = ta.macd(src, macdFast, macdSlow, macdSignal)
// Stochastic
stochK = ta.stoch(high, low, close, stochLength)
// CCI
cciValue = ta.cci(src, cciLength)
// Momentum (Rate of Change)
momentum = ta.roc(src, momentumLength)
// Bollinger Bands
basis_bb = ta.sma(src, bbLength)
bbStd = ta.stdev(src, bbLength)
bbUpper = basis_bb + bbMult * bbStd
bbLower = basis_bb – bbMult * bbStd
//~~~~~~~~~~~~~~~~~~~~~~~~~~~~~~~~~~~~~~~~~~~~~~~~~~~~~~~~~~~~~~~~~~~~~~~~~~~~~~}
// DYNAMIC MA & COUNTER VARIABLES {
var int counter = 1
var int prevState = 0 // Previous bar’s directional state
dynLen = math.min(baseLen + (counter – 1), maxDynLen)
ma = ta.sma(src, dynLen)
//~~~~~~~~~~~~~~~~~~~~~~~~~~~~~~~~~~~~~~~~~~~~~~~~~~~~~~~~~~~~~~~~~~~~~~~~~~~~~~}
// ~~ FUNCTION: GET THE CURRENT CONDITION STATE {
f_getState() =>
var int state = 0
if resetConditionType == “Slope”
state := not na(ma[slopeOB]) ? (ma > ma[slopeOB] ? 1 : ma < ma[slopeOB] ? -1 : 0) : 0
else if resetConditionType == "RSI"
state := rsiValue > rsiOB ? 1 : rsiValue < rsiOS ? -1 : 0
else if resetConditionType == "Volume"
state := ta.sma(volume,20) > volSMA ? 1 : ta.sma(volume,20) < volSMA ? -1 : 0
else if resetConditionType == "Bollinger"
state := close > bbUpper ? 1 : close < bbLower ? -1 : 0
else if resetConditionType == "MACD"
state := macdLine > signalLine ? 1 : macdLine < signalLine ? -1 : 0
else if resetConditionType == "Stochastic"
state := stochK > stochOB ? 1 : stochK < stochOS ? -1 : 0
else if resetConditionType == "CCI"
state := cciValue > cciOB ? 1 : cciValue < cciOS ? -1 : 0
else if resetConditionType == "Momentum"
state := momentum > 0 ? 1 : momentum < 0 ? -1 : 0
else
state := 0
state
currentState = f_getState()
//~~~~~~~~~~~~~~~~~~~~~~~~~~~~~~~~~~~~~~~~~~~~~~~~~~~~~~~~~~~~~~~~~~~~~~~~~~~~~~}
// ~~ UPDATE THE COUNTER WITH REVERSE COUNTING OPTION {
var bool counterIncreasing = true
if currentState != 0
if currentState != prevState
// New directional event: reset counter and mode.
counter := 1
counterIncreasing := true
else
if reverseCounter
if counterIncreasing
if counter < counterbreak
counter += 1
else
counterIncreasing := false
counter -= 1
else
if counter > 1
counter -= 1
else
counterIncreasing := true
counter += 1
else
counter += 1
else
counter := 1
counterIncreasing := true
prevState := currentState
//~~~~~~~~~~~~~~~~~~~~~~~~~~~~~~~~~~~~~~~~~~~~~~~~~~~~~~~~~~~~~~~~~~~~~~~~~~~~~~}
// ~~ Recalculate the dynamic MA based on the updated counter {
dynLen := math.min(baseLen + (counter – 1), maxDynLen)
ma := ta.sma(src, dynLen)
//~~~~~~~~~~~~~~~~~~~~~~~~~~~~~~~~~~~~~~~~~~~~~~~~~~~~~~~~~~~~~~~~~~~~~~~~~~~~~~}
// ~~ Trend Detection {
var bool trend = false
if ta.crossover(close, ma)
trend := true
if ta.crossunder(close, ma)
trend := false
trend_change = trend != trend[1]
//~~~~~~~~~~~~~~~~~~~~~~~~~~~~~~~~~~~~~~~~~~~~~~~~~~~~~~~~~~~~~~~~~~~~~~~~~~~~~~}
// ~~ Adaptive Trend Calculations {
atrThreshold = ta.atr(200)
adaptivePoleFilter(float source, int length, float dampFactor) =>
float freq = 2.0 * math.pi / length
float smoothFactor = dampFactor * freq
float responseFactor = math.exp(-smoothFactor)
var float primaryFilter = na
var float secondaryFilter = na
primaryFilter := nz(primaryFilter[1]) + smoothFactor * (source – nz(primaryFilter[1]))
secondaryFilter := nz(secondaryFilter[1]) * responseFactor + (1.0 – responseFactor) * primaryFilter
math.avg(primaryFilter,secondaryFilter)
filteredTrend = adaptivePoleFilter(ma,length,trendSmoothing)
//~~~~~~~~~~~~~~~~~~~~~~~~~~~~~~~~~~~~~~~~~~~~~~~~~~~~~~~~~~~~~~~~~~~~~~~~~~~~~~}
// ~~ Track trend strength changes {
var trendUp = 0
var trendDown = 0
isUptrend = filteredTrend > filteredTrend[2]
isDowntrend = filteredTrend < filteredTrend[2]
// Reset trend counters when direction changes
if isUptrend
trendUp += 1
trendDown := 0
if isDowntrend
trendUp := 0
trendDown += 1
//~~~~~~~~~~~~~~~~~~~~~~~~~~~~~~~~~~~~~~~~~~~~~~~~~~~~~~~~~~~~~~~~~~~~~~~~~~~~~~}
// ~~ coloring {
trendColor = isUptrend ? color.from_gradient(trendUp, 10, 50, grad_col, trendUp_col) : isDowntrend ?
color.from_gradient(trendDown, 10, 50, grad_col, trendDn_col) : grad_col
confirmedUptrend = trendDown>= trending
confirmedDowntrend = trendUp >= trending
confirmedUptrend_col = trendUp >= trending_col
confirmedDowntrend_col = trendDown >= trending_col
circleup = filteredTrend + atrThreshold
circledn = filteredTrend – atrThreshold
//~~~~~~~~~~~~~~~~~~~~~~~~~~~~~~~~~~~~~~~~~~~~~~~~~~~~~~~~~~~~~~~~~~~~~~~~~~~~~~}
// ~~ PLOTS {
dayncolor = confirmedUptrend_col?upcol:confirmedDowntrend_col?dncol:neucol
visualclose = ta.ema(close,10)
dynma = plot(ma, color=dayncolor, title=”Dynamic MA”, linewidth = 2)
visualclose_ = plot(visualclose, color=color.new(color.blue,100), title=”visualclose”, editable = false)
fill(dynma, visualclose_, ma, visualclose, trend==true?color.new(upcol, 70):color.new(dncol,70), na, title=”Fill”)
plotshape(confirmedDowntrend? circledn : na, title=”Trending Up”, location=location.absolute, color=trendColor, style=shape.circle)
plotshape(confirmedDowntrend? circledn : na, “Trending Up – visual only”, shape.circle, location.absolute, color = color.new(trendColor,90), size=size.tiny)
plotshape(confirmedUptrend? circleup : na, title=”Trending Down”, location=location.absolute, color=trendColor, style=shape.circle)
plotshape(confirmedUptrend? circleup: na, “Trending Down – visual only”, shape.circle, location.absolute, color = color.new(trendColor,90), size=size.tiny)
PosTrendStart = confirmedUptrend and not confirmedUptrend[1]
NegTrendStart = confirmedDowntrend and not confirmedDowntrend[1]
plotshape(PosTrendStart? circleup : na, “Trend Up”, shape.triangledown, location.absolute, color = trendColor, size = size.tiny, offset = -1)
plotshape(PosTrendStart? circleup : na, “Trend Up – visual only”, shape.triangledown, location.absolute, color = color.new(trendColor,50), size = size.small, offset = -1)
plotshape(PosTrendStart? circleup : na, “Trend Up – visual only”, shape.circle, location.absolute, color = color.new(trendColor,80), size = size.normal, offset = -1)
plotshape(NegTrendStart? circledn : na, “Trend Dn”, shape.triangleup, location.absolute, color = trendColor, size = size.tiny, offset = -1)
plotshape(NegTrendStart? circledn : na, “Trend Dn – visual only”, shape.triangleup, location.absolute, color = color.new(trendColor,50), size = size.small, offset = -1)
plotshape(NegTrendStart? circledn : na, “Trend Dn – visual only”, shape.circle, location.absolute, color = color.new(trendColor,80), size = size.normal, offset = -1)
//~~~~~~~~~~~~~~~~~~~~~~~~~~~~~~~~~~~~~~~~~~~~~~~~~~~~~~~~~~~~~~~~~~~~~~~~~~~~~~}
// ~~ Normalize the Counter Value to a 0-100 Trend Score {
var float highestTrendScore = na
var float totalTrendScore = na
var int trendCount = na
trendScore = ((counter – 1) / (counterbreak – 1)) * 100
highestTrendScore := na(highestTrendScore) ? trendScore : math.max(highestTrendScore, trendScore)
totalTrendScore := na(totalTrendScore) ? trendScore : totalTrendScore + trendScore
trendCount := na(trendCount) ? 1 : trendCount + 1
averageTrendScore = totalTrendScore / trendCount
//~~~~~~~~~~~~~~~~~~~~~~~~~~~~~~~~~~~~~~~~~~~~~~~~~~~~~~~~~~~~~~~~~~~~~~~~~~~~~~}
// ~~ Table {
var table infoTable = table.new(position = position.top_right, columns = 4, rows = 6, bgcolor = color.new(color.blue,100), border_width = 1)
var table resetModeTable = table.new(position = position.bottom_right, columns = 3, rows = 2, bgcolor = color.new(color.black, 80), border_width = 1)
if barstate.islast and trendStrengthTable
table.cell(infoTable, column=0, row=0, text=”Reset Condition”, text_color=color.white, bgcolor=color.rgb(80, 118, 255))
table.cell(infoTable, column=1, row=0, text=resetConditionType, text_color=color.yellow)
table.cell(infoTable, column=0, row=1, text=”Counter Value”, text_color=color.white, bgcolor=color.rgb(80, 118, 255))
table.cell(infoTable, column=1, row=1, text=str.tostring(counter), text_color=color.orange)
table.cell(infoTable, column=0, row=2, text=”Trend Strength”, text_color=color.white, bgcolor=color.rgb(80, 118, 255))
table.cell(infoTable, column=1, row=2, text=str.tostring(trendScore, “#”), text_color=trendColor)
table.cell(infoTable, column=0, row=4, text=”Highest Trend Score”, text_color=color.white, bgcolor=color.rgb(80, 118, 255))
table.cell(infoTable, column=1, row=4, text=str.tostring(highestTrendScore, “#”), text_color=color.green)
table.cell(infoTable, column=0, row=5, text=”Average Trend Score”, text_color=color.white, bgcolor=color.rgb(80, 118, 255))
table.cell(infoTable, column=1, row=5, text=str.tostring(averageTrendScore, “#”), text_color=color.blue)
// Reset Mode Descriptions
var string modeBestFor = “”
var string modeBenefit = “”
if resetConditionType == “Slope”
modeBestFor := “Trend traders”
modeBenefit := “Follows major trend shifts”
else if resetConditionType == “RSI”
modeBestFor := “Reversal traders”
modeBenefit := “Identifies overbought/oversold extremes”
else if resetConditionType == “Volume”
modeBestFor := “Breakout traders”
modeBenefit := “Detects institutional activity”
else if resetConditionType == “Bollinger”
modeBestFor := “Volatility traders”
modeBenefit := “Captures extreme price deviations”
else if resetConditionType == “MACD”
modeBestFor := “Momentum traders”
modeBenefit := “Signals acceleration vs. exhaustion”
else if resetConditionType == “Stochastic”
modeBestFor := “Short-term traders”
modeBenefit := “Fast reaction to price swings”
else if resetConditionType == “CCI”
modeBestFor := “Cycle traders”
modeBenefit := “Detects overextended price deviations”
else if resetConditionType == “Momentum”
modeBestFor := “Trend traders”
modeBenefit := “Identifies acceleration/deceleration”
else
modeBestFor := “N/A”
modeBenefit := “No reset mode selected”
// Table
if barstate.islast and showGuidanceTable
table.cell(resetModeTable, column=0, row=0, text=”Reset Mode”, text_color=color.white, bgcolor=color.rgb(80, 118, 255))
table.cell(resetModeTable, column=1, row=0, text=”Best For”, text_color=color.white, bgcolor=color.rgb(80, 118, 255))
table.cell(resetModeTable, column=2, row=0, text=”Key Benefit”, text_color=color.white, bgcolor=color.rgb(80, 118, 255))
table.cell(resetModeTable, column=0, row=1, text=resetConditionType, text_color=color.yellow)
table.cell(resetModeTable, column=1, row=1, text=modeBestFor, text_color=chart.fg_color)
table.cell(resetModeTable, column=2, row=1, text=modeBenefit, text_color=chart.fg_color)
//~~~~~~~~~~~~~~~~~~~~~~~~~~~~~~~~~~~~~~~~~~~~~~~~~~~~~~~~~~~~~~~~~~~~~~~~~~~~~~}
Merci pour votre aide 🙂
Laetitia