Bonjour
Je suis toute nouvelle dans le codage , en vrais j’y comprend rien , j’ais beau essaye mais rien ne fonctionne , pourriez vous m’aider ? En fait un y aurais même 2 indicateur que je ne retrouve pas chez prorealtime , ils portent peut etre un autre nom !
Je souhaiterais avoir ces indicateurs sur prorealtime , je ne l’est pas trouver mais il y est sur tradingview
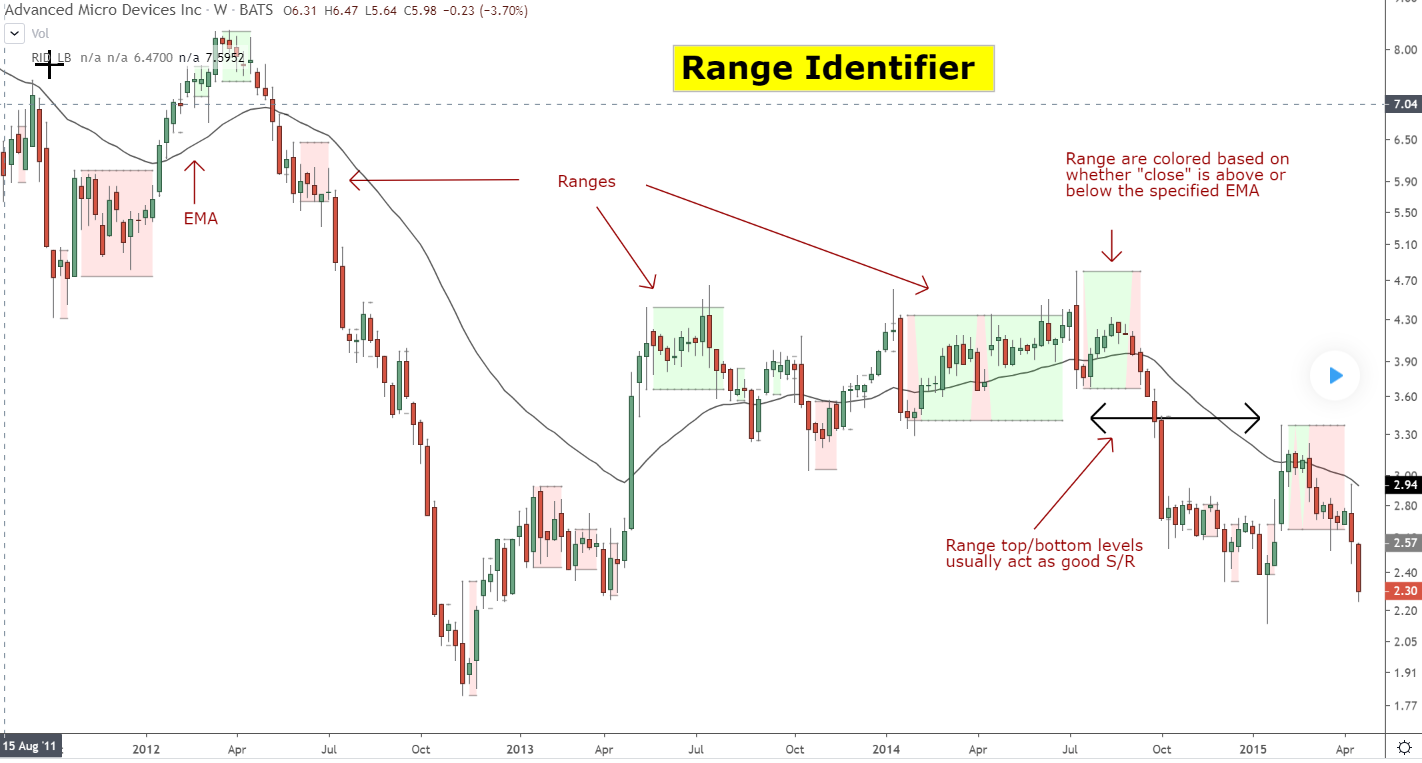
il y a ” Range Identifier [LazyBear] par LazyBear ” et le code tradingview est
//
// @author LazyBear
//
//
//
study("Range Identifier [LazyBear]", shorttitle="RID_LB", overlay=true)
connectRanges=input(false, title="Connect Ranges")
showMidLine=input(false, title="Show MidLine")
lengthEMA=input(34, title="EMA Length")
showEMA=input(true, title="Show EMA")
hc=input(true, title="Highlight Consolidation")
e=ema(close,lengthEMA)
up = close<nz(up[1]) and close>down[1] ? nz(up[1]) : high
down = close<nz(up[1]) and close>down[1] ? nz(down[1]) : low
mid = avg(up,down)
ul=plot(connectRanges?up:up==nz(up[1])?up:na, color=gray, linewidth=2, style=linebr, title="Up")
ll=plot(connectRanges?down:down==nz(down[1])?down:na, color=gray, linewidth=2, style=linebr, title="Down")
dummy=plot(hc?close>e?down:up:na, color=gray, style=circles, linewidth=0, title="Dummy")
fill(ul,dummy, color=lime)
fill(dummy,ll, color=red)
plot(showMidLine?mid:na, color=gray, linewidth=1, title="Mid")
plot(showEMA?e:na, title="EMA", color=black, linewidth=2)
Et l’autre c’est ” Divergence Indicator ”
et le code c’est
//@version=4
study(title="Divergence Indicator", format=format.price)

len = input(title="RSI Period", minval=1, defval=14)
src = input(title="RSI Source", defval=close)
lbR = input(title="Pivot Lookback Right", defval=5)
lbL = input(title="Pivot Lookback Left", defval=5)
rangeUpper = input(title="Max of Lookback Range", defval=60)
rangeLower = input(title="Min of Lookback Range", defval=5)
plotBull = input(title="Plot Bullish", defval=true)
plotHiddenBull = input(title="Plot Hidden Bullish", defval=false)
plotBear = input(title="Plot Bearish", defval=true)
plotHiddenBear = input(title="Plot Hidden Bearish", defval=false)

bearColor = color.red
bullColor = color.green
hiddenBullColor = color.new(color.green, 80)
hiddenBearColor = color.new(color.red, 80)
textColor = color.white
noneColor = color.new(color.white, 100)

osc = rsi(src, len)

plot(osc, title="RSI", linewidth=2, color=#8D1699)
hline(50, title="Middle Line", linestyle=hline.style_dotted)
obLevel = hline(70, title="Overbought", linestyle=hline.style_dotted)
osLevel = hline(30, title="Oversold", linestyle=hline.style_dotted)
fill(obLevel, osLevel, title="Background", color=#9915FF, transp=90)

plFound = na(pivotlow(osc, lbL, lbR)) ? false : true
phFound = na(pivothigh(osc, lbL, lbR)) ? false : true

_inRange(cond) =>
bars = barssince(cond == true)
rangeLower <= bars and bars <= rangeUpper

//------------------------------------------------------------------------------
// Regular Bullish

// Osc: Higher Low
oscHL = osc[lbR] > valuewhen(plFound, osc[lbR], 1) and _inRange(plFound[1])

// Price: Lower Low
priceLL = low[lbR] < valuewhen(plFound, low[lbR], 1)

bullCond = plotBull and priceLL and oscHL and plFound

plot(
plFound ? osc[lbR] : na,
offset=-lbR,
title="Regular Bullish",
linewidth=2,
color=(bullCond ? bullColor : noneColor),
transp=0
)

plotshape(
bullCond ? osc[lbR] : na,
offset=-lbR,
title="Regular Bullish Label",
text=" Bull ",
style=shape.labelup,
location=location.absolute,
color=bullColor,
textcolor=textColor,
transp=0
)

//------------------------------------------------------------------------------
// Hidden Bullish

// Osc: Lower Low
oscLL = osc[lbR] < valuewhen(plFound, osc[lbR], 1) and _inRange(plFound[1])

// Price: Higher Low
priceHL = low[lbR] > valuewhen(plFound, low[lbR], 1)

hiddenBullCond = plotHiddenBull and priceHL and oscLL and plFound

plot(
plFound ? osc[lbR] : na,
offset=-lbR,
title="Hidden Bullish",
linewidth=2,
color=(hiddenBullCond ? hiddenBullColor : noneColor),
transp=0
)

plotshape(
hiddenBullCond ? osc[lbR] : na,
offset=-lbR,
title="Hidden Bullish Label",
text=" H Bull ",
style=shape.labelup,
location=location.absolute,
color=bullColor,
textcolor=textColor,
transp=0
)

//------------------------------------------------------------------------------
// Regular Bearish

// Osc: Lower High
oscLH = osc[lbR] < valuewhen(phFound, osc[lbR], 1) and _inRange(phFound[1])

// Price: Higher High
priceHH = high[lbR] > valuewhen(phFound, high[lbR], 1)

bearCond = plotBear and priceHH and oscLH and phFound

plot(
phFound ? osc[lbR] : na,
offset=-lbR,
title="Regular Bearish",
linewidth=2,
color=(bearCond ? bearColor : noneColor),
transp=0
)

plotshape(
bearCond ? osc[lbR] : na,
offset=-lbR,
title="Regular Bearish Label",
text=" Bear ",
style=shape.labeldown,
location=location.absolute,
color=bearColor,
textcolor=textColor,
transp=0
)

//------------------------------------------------------------------------------
// Hidden Bearish

// Osc: Higher High
oscHH = osc[lbR] > valuewhen(phFound, osc[lbR], 1) and _inRange(phFound[1])

// Price: Lower High
priceLH = high[lbR] < valuewhen(phFound, high[lbR], 1)

hiddenBearCond = plotHiddenBear and priceLH and oscHH and phFound

plot(
phFound ? osc[lbR] : na,
offset=-lbR,
title="Hidden Bearish",
linewidth=2,
color=(hiddenBearCond ? hiddenBearColor : noneColor),
transp=0
)

plotshape(
hiddenBearCond ? osc[lbR] : na,
offset=-lbR,
title="Hidden Bearish Label",
text=" H Bear ",
style=shape.labeldown,
location=location.absolute,
color=bearColor,
textcolor=textColor,
transp=0
)
Merci d’avance pour votre aide 🙂