Hello, would it be possible to convert this to ProRealTime?
Thanks, Jeroen
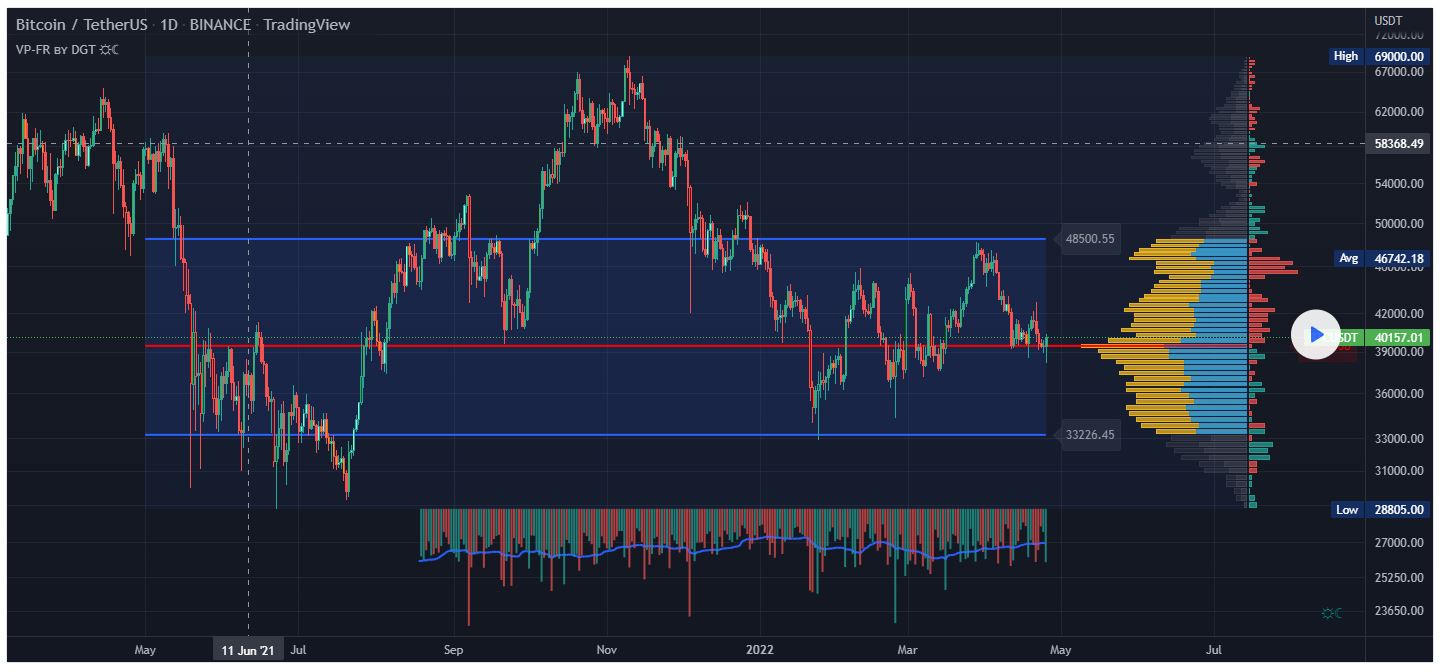
Volume Profile (also known as Price by Volume) from https://www.tradingview.com/script/Qwj6TO5I-Volume-Profile-and-Volume-Indicator-by-DGT/ is an charting study that displays trading activity over a specified time period at specific price levels. It is plotted as a horizontal histogram on the finacial isntrumnet’s chart that highlights the trader’s interest at specific price levels.
The histogram is used by traders to predict areas of support and resistance . Price levels where the traded volume is high could be assumed as support and resistance levels.
Price may experience difficulty moving above or below areas with large bars. Usually there is a great deal of activity on both the buy and sell side and the market stays at that price level for a great deal of time
with bull/bear volume strength histogram, aims to emphasis the price levels in terms of buying or selling trading activity over the specified period of time.
green rows indicates higher bull trading activities and conversely red rows indicate higher bear trading activities.
the code;
//@version=5
// ══════════════════════════════════════════════════════════════════════════════════════════════════ //
//# * ══════════════════════════════════════════════════════════════════════════════════════════════
//# *
//# * Study : Volume Profile / Price by Volume – Fixed Ragne
//# * Author : © dgtrd
//# *
//# * Revision History
//# * Release : Feb 23, 2022
//# * Update : Feb 27, 2022 : added volume indicator (histogram)
//# * Update : Feb 28, 2022 : volume indicator now has a moving average option
//# * Update : Mar 10, 2022 : horizontal offset option added, applicable for volume profile placed on right side
//# * Update : Mar 15, 2022 : added bull/bear volume dominace histogram
//# * Update : Apr 09, 2022 : aesthetic tweaks
//# * Update : Apr 25, 2022 : value area addition
//# *
//# * ══════════════════════════════════════════════════════════════════════════════════════════════
// ══════════════════════════════════════════════════════════════════════════════════════════════════ //
// ———————————————————————————————- //
// Functions ———————————————————————————– //
f_drawLabelX(_x, _y, _text, _xloc, _yloc, _color, _style, _textcolor, _size, _textalign, _tooltip) =>
var id = label.new(_x, _y, _text, _xloc, _yloc, _color, _style, _textcolor, _size, _textalign, _tooltip)
label.set_xy(id, _x, _y)
label.set_text(id, _text)
label.set_tooltip(id, _tooltip)
label.set_textcolor(id, _textcolor)
f_drawLineX(_x1, _y1, _x2, _y2, _xloc, _extend, _color, _style, _width) =>
var id = line.new(_x1, _y1, _x2, _y2, _xloc, _extend, _color, _style, _width)
line.set_xy1(id, _x1, _y1)
line.set_xy2(id, _x2, _y2)
line.set_color(id, _color)
id
// Functions ———————————————————————————– //
// ———————————————————————————————- //
indicator(“Volume Profile and Indicator by DGT”, “VP-FR ʙʏ DGT ☼☾”, true, max_bars_back = 5000, max_lines_count = 500, max_boxes_count = 500)
// ———————————————————————————————- //
// Volume Profile (Price by Volume) / Volume Histogram —————————————— //
group_volume_profile = ‘Volume Profile / Price by Volume’
tooltip_volume_profile = ‘Volume Profile (also known as Price by Volume) is an charting study that displays trading activity over a specified time period at specific price levels’
tooltip_dominace = ‘Bull/Bear Dominance displays the dominat party at the specific price levels\n’ +
‘ – red rows : selling pressure is higher\n’ +
‘ – green rows : buying pressure is higher\n\nnarrow rows does not mean no interest at that price levels but equlibrium between selling and buying trading activity’
volumeProfile = input.bool(true, ‘Volume Profile (Common Interest)’ , group = group_volume_profile, tooltip = tooltip_volume_profile)
profileDisplay = input.string(‘Up/Down’, ‘Volume’, options = [‘Up/Down’, ‘Total’], inline=’ZZ’ , group = group_volume_profile)
upVolumeColor = input.color(color.new(#1592e6, 30), ” , inline=’ZZ’ , group = group_volume_profile)
downVolumeColor = input.color(color.new(#fbc123, 30), ” , inline=’ZZ’ , group = group_volume_profile)
nonVaColor = input.color(color.new(#5d606b, 80), ” , inline=’ZZ’ , group = group_volume_profile)
bullBearStr = input.bool(true, ‘Bull/Bear Dominance, Bull’ , inline=’BB’ , group = group_volume_profile, tooltip = tooltip_dominace)
bbStrUpColor = input.color(color.new(#26a69a, 30), ” , inline=’BB’ , group = group_volume_profile)
bbStrDownColor = input.color(color.new(#ef5350, 30), ‘Bear’ , inline=’BB’ , group = group_volume_profile)
pointOfControl = input.bool(true, ‘Point of Control Line’ , inline=’PoC’, group = group_volume_profile)
pocColor = input.color(color.new(#ff0000, 0), ” , inline=’PoC’, group = group_volume_profile)
pocWidth = input.int(2, ”, minval = 1 , inline=’PoC’, group = group_volume_profile)
isValueArea = input.float(68, “Value Area Volume %”, minval = 0, maxval = 100 , group = group_volume_profile) / 100
valueAreaHigh = input.bool(true, ‘Value Area High (VAH) Line ’ , inline=’VAH’, group = group_volume_profile)
vahColor = input.color(color.new(#2962ff, 0), ” , inline=’VAH’, group = group_volume_profile)
vahWidth = input.int(2, ”, minval = 1 , inline=’VAH’, group = group_volume_profile)
valueAreaLow = input.bool(true, ‘Value Area Low (VAL) Line ’ , inline=’VAL’, group = group_volume_profile)
valColor = input.color(color.new(#2962ff, 0), ” , inline=’VAL’, group = group_volume_profile)
valWidth = input.int(2, ”, minval = 1 , inline=’VAL’, group = group_volume_profile)
vaBackground = input.bool(true, ‘Background Color of Value Area’ , inline=’vBG’, group = group_volume_profile)
vaBackgroundColor = input.color(color.new(#2962ff, 89), ” , inline=’vBG’, group = group_volume_profile)
priceLevels = input.string(‘Value Area High/Low’, ‘Price Levels’, options = [‘Profile High/Low’, ‘Value Area High/Low’, ‘None’], inline=’BBe’, group = group_volume_profile)
labelColor = input.color(color.new(#9598a1, 0), ” , inline=’BBe’, group = group_volume_profile)
lookbackLength = input.int(360, ‘Lookback Length’, minval = 10, maxval = 5000, step = 10 , group = group_volume_profile)
lookbackLength := last_bar_index < lookbackLength ? last_bar_index : lookbackLength
profileLevels = input.int(100, ‘Number of Rows’ , minval = 10, maxval = 150 , step = 1 , group = group_volume_profile)
profilePlacement = input.string(‘Right’, ‘Placment’, options = [‘Right’, ‘Left’] , group = group_volume_profile)
profileWidth = input.int(75, ‘Profile Width’, minval = 21, maxval = 150 , group = group_volume_profile)
horizontalOffset = input.int(5, ‘Horizontal Offset’, minval = 0 , maxval = 50 , group = group_volume_profile)
applyBackColor = input.bool(true, ‘Background Fill of Profile Range’ , inline = ‘BG’, group = group_volume_profile)
backgroundColor = input.color(color.new(#2962ff, 95), ” , inline = ‘BG’, group = group_volume_profile)
group_volume = ‘Volume Histogram’
tooltip_volume = ‘The Volume indicator is used to measure how much of a given financial asset has traded in each specific candle’
volumeHistogram = input.bool(true, ‘Volume Histogram’ , group = group_volume, tooltip = tooltip_volume)
volumeMA = input.bool(true, ‘Volume MA, Length’ , inline=’vol2′, group = group_volume)
volumeMALength = input.int(21, ”, minval = 1 , inline=’vol2′, group = group_volume)
volumeUpColor = input.color(color.new(#26a69a, 30), ‘Grawing’ , inline=’vol1′, group = group_volume)
volumeDownColor = input.color(color.new(#ef5350, 30), ‘ Falling’ , inline=’vol1′, group = group_volume)
volumeMAColor = input.color(color.new(#2962ff, 0), ‘ Volume MA’ , inline=’vol1′, group = group_volume)
volumePlacement = input.string(‘Top’, ‘Placment’, options = [‘Top’, ‘Bottom’] , group = group_volume)
volumeHistHight = 11 – input.int(8, ‘Hight’ , minval = 1, maxval = 10 , group = group_volume)
verticalOffset = input.int(0, ‘Vertical Offset’, minval = 0 , maxval = 20 , group = group_volume) / 20
volumeStorageT = array.new_float(profileLevels + 1, 0.)
volumeStorageB = array.new_float(profileLevels + 1, 0.)
var a_profile = array.new_box()
var a_histogram = array.new_line()
var levelAbovePoc = 0
var levelBelowPoc = 0
var pocLevel = 0
barPriceLow = low
barPriceHigh = high
bullCandle = close > open
nzVolume = nz(volume)
priceHighest = ta.highest(high, lookbackLength > 0 ? lookbackLength : 200)
priceLowest = ta.lowest (low , lookbackLength > 0 ? lookbackLength : 200)
priceStep = (priceHighest – priceLowest) / profileLevels
priceChangeRate = (priceHighest – priceLowest) / priceHighest
volumeHighest = ta.highest(nzVolume, lookbackLength > 0 ? lookbackLength : 200)
volumeMARate = nzVolume/ta.sma(nzVolume, volumeMALength)
if barstate.islast and nzVolume
if array.size(a_profile) > 0
for i = 0 to array.size(a_profile) – 1
box.delete(array.shift(a_profile))
if array.size(a_histogram) > 0
for i = 0 to array.size(a_histogram) – 1
line.delete(array.shift(a_histogram))
for barIndex = 0 to lookbackLength – 1
level = 0
for priceLevel = priceLowest to priceHighest by priceStep
if barPriceHigh[barIndex] >= priceLevel and barPriceLow[barIndex] < priceLevel + priceStep
array.set(volumeStorageT, level, array.get(volumeStorageT, level) + nzVolume[barIndex] * ((barPriceHigh[barIndex] – barPriceLow[barIndex]) == 0 ? 1 : priceStep / (barPriceHigh[barIndex] – barPriceLow[barIndex])) )
if bullCandle[barIndex] and (profileDisplay == ‘Up/Down’ or bullBearStr)
array.set(volumeStorageB, level, array.get(volumeStorageB, level) + nzVolume[barIndex] * ((barPriceHigh[barIndex] – barPriceLow[barIndex]) == 0 ? 1 : priceStep / (barPriceHigh[barIndex] – barPriceLow[barIndex])) )
level += 1
if volumeHistogram and array.size(a_histogram) < 500
array.push(a_histogram, line.new(bar_index[barIndex], volumePlacement == ‘Top’ ? priceHighest * (1 + priceChangeRate * verticalOffset) : priceLowest * (1 – priceChangeRate * verticalOffset) , bar_index[barIndex], (volumePlacement == ‘Top’ ? priceHighest * (1 + priceChangeRate * verticalOffset) : priceLowest * (1 – priceChangeRate * verticalOffset)) * (1 + ( volumePlacement == ‘Top’ ? 1 : -1) * nzVolume[barIndex] / volumeHighest * priceChangeRate / volumeHistHight), xloc.bar_index, extend.none, bullCandle[barIndex] ? volumeUpColor : volumeDownColor, line.style_solid, 2))
if volumeMA
array.push(a_histogram, line.new(bar_index[barIndex], (volumePlacement == ‘Top’ ? priceHighest * (1 + priceChangeRate * verticalOffset) : priceLowest * (1 – priceChangeRate * verticalOffset)) * (1 + (volumePlacement == ‘Top’ ? 1 : -1) * nzVolume[barIndex] / volumeHighest * priceChangeRate / volumeHistHight / volumeMARate[barIndex]), bar_index[barIndex + 1], (volumePlacement == ‘Top’ ? priceHighest * (1 + priceChangeRate * verticalOffset) : priceLowest * (1 – priceChangeRate * verticalOffset)) * (1 + (volumePlacement == ‘Top’ ? 1 : -1) * nzVolume[barIndex + 1] / volumeHighest * priceChangeRate / volumeHistHight / volumeMARate[barIndex + 1]), xloc.bar_index, extend.none, volumeMAColor, line.style_solid, 2))
pocLevel := array.indexof(volumeStorageT, array.max(volumeStorageT))
if pointOfControl
f_drawLineX(bar_index – lookbackLength + 1, priceLowest + (pocLevel + 0.50) * priceStep, bar_index + (profilePlacement == ‘Right’ ? horizontalOffset + profileWidth : 0), priceLowest + (pocLevel + 0.50) * priceStep, xloc.bar_index, extend.none, pocColor, line.style_solid, pocWidth)
if priceLevels != ‘None’
f_drawLabelX(bar_index + (profilePlacement == ‘Right’ ? horizontalOffset + profileWidth + (bullBearStr ? 17 : 7) : 7), priceLowest + (array.indexof(volumeStorageT, array.max(volumeStorageT)) + .5) * priceStep, str.tostring(priceLowest + (array.indexof(volumeStorageT, array.max(volumeStorageT)) + .5) * priceStep, format.mintick), xloc.bar_index, yloc.price, color.new(pocColor, 89), label.style_label_left, color.new(pocColor, 0), size.normal, text.align_left, ‘Point Of Control Price’)
totalVolumeTraded = array.sum(volumeStorageT) * isValueArea
valueArea = array.get(volumeStorageT, pocLevel)
levelAbovePoc := pocLevel
levelBelowPoc := pocLevel
while valueArea < totalVolumeTraded
if levelBelowPoc == 0 and levelAbovePoc == profileLevels – 1
break
volumeAbovePoc = 0.
if levelAbovePoc < profileLevels – 1
volumeAbovePoc := array.get(volumeStorageT, levelAbovePoc + 1)
volumeBelowPoc = 0.
if levelBelowPoc > 0
volumeBelowPoc := array.get(volumeStorageT, levelBelowPoc – 1)
if volumeAbovePoc >= volumeBelowPoc
valueArea += volumeAbovePoc
levelAbovePoc += 1
else
valueArea += volumeBelowPoc
levelBelowPoc -= 1
vah = f_drawLineX(bar_index – lookbackLength + 1, priceLowest + (levelAbovePoc + 1.00) * priceStep, bar_index, priceLowest + (levelAbovePoc + 1.00) * priceStep, xloc.bar_index, extend.none, valueAreaHigh ? vahColor : #00000000, line.style_solid, vahWidth)
val = f_drawLineX(bar_index – lookbackLength + 1, priceLowest + (levelBelowPoc + 0.00) * priceStep, bar_index, priceLowest + (levelBelowPoc + 0.00) * priceStep, xloc.bar_index, extend.none, valueAreaLow ? valColor : #00000000, line.style_solid, valWidth)
if applyBackColor
array.push(a_profile, box.new(bar_index – lookbackLength + 1, priceLowest, bar_index + (profilePlacement == ‘Right’ ? profileWidth + horizontalOffset : 0), priceHighest, backgroundColor, 1, line.style_dotted, bgcolor = backgroundColor ))
if vaBackground
linefill.new(vah, val, vaBackgroundColor)
if priceLevels != ‘None’
upperPriceLevel = priceLevels == ‘Value Area High/Low’ ? priceLowest + (levelAbovePoc + 1.00) * priceStep : priceHighest
lowerPriceLevel = priceLevels == ‘Value Area High/Low’ ? priceLowest + (levelBelowPoc + 0.00) * priceStep : priceLowest
f_drawLabelX(last_bar_index + 3, upperPriceLevel, str.tostring(upperPriceLevel, format.mintick), xloc.bar_index, yloc.price, color.new(labelColor, 89), label.style_label_left, labelColor, size.normal, text.align_left, ‘Profile High – ‘ + str.tostring(priceHighest, format.mintick) + ‘\n %’ + str.tostring((priceHighest – priceLowest) / priceLowest * 100, ‘#.##’) + ‘ higher than the Profile Low\n\nValue Area High – ‘ + str.tostring(priceLowest + (levelAbovePoc + 1.00) * priceStep, format.mintick) + ‘\n value area volume %’ + str.tostring(isValueArea * 100) + ‘\n\nNumber of bars : ‘ + str.tostring(lookbackLength) )
f_drawLabelX(last_bar_index + 3, lowerPriceLevel, str.tostring(lowerPriceLevel, format.mintick), xloc.bar_index, yloc.price, color.new(labelColor, 89), label.style_label_left, labelColor, size.normal, text.align_left, ‘Profile Low – ‘ + str.tostring(priceLowest , format.mintick) + ‘\n %’ + str.tostring((priceHighest – priceLowest) / priceHighest * 100, ‘#.##’) + ‘ lower than the Profile High\n\nValue Area Low – ‘ + str.tostring(priceLowest + (levelBelowPoc + 0.00) * priceStep, format.mintick) + ‘\n value area volume %’ + str.tostring(isValueArea * 100) + ‘\n\nNumber of bars : ‘ + str.tostring(lookbackLength) )
for level = 0 to profileLevels – 1
if volumeProfile
levelColor = profileDisplay == ‘Up/Down’ ? level >= levelBelowPoc and level <= levelAbovePoc ? downVolumeColor : nonVaColor : level >= levelBelowPoc and level <= levelAbovePoc ? upVolumeColor : nonVaColor
startBoxIndex = profilePlacement == ‘Right’ ? bar_index + profileWidth + horizontalOffset – int(array.get(volumeStorageT, level) / array.max(volumeStorageT) * (profileWidth – 9)) : bar_index – lookbackLength + 1
endBoxIndex = profilePlacement == ‘Right’ ? bar_index + profileWidth + horizontalOffset: startBoxIndex + int( array.get(volumeStorageT, level) / array.max(volumeStorageT) * (profileWidth – 9))
array.push(a_profile, box.new(startBoxIndex, priceLowest + (level + 0.1) * priceStep, endBoxIndex, priceLowest + (level + 0.9) * priceStep, levelColor, bgcolor = levelColor ))
if profileDisplay == ‘Up/Down’ and volumeProfile
startBoxIndex = profilePlacement == ‘Right’ ? bar_index + profileWidth + horizontalOffset – int(array.get(volumeStorageB, level) / array.max(volumeStorageB) * (profileWidth – 9) / 2) : bar_index – lookbackLength + 1
endBoxIndex = profilePlacement == ‘Right’ ? bar_index + profileWidth + horizontalOffset: startBoxIndex + int( array.get(volumeStorageB, level) / array.max(volumeStorageB) * (profileWidth – 9) / 2)
array.push(a_profile, box.new(startBoxIndex, priceLowest + (level + 0.1) * priceStep, endBoxIndex, priceLowest + (level + 0.9) * priceStep, level >= levelBelowPoc and level <= levelAbovePoc ? upVolumeColor : nonVaColor, bgcolor = level >= levelBelowPoc and level <= levelAbovePoc ? upVolumeColor : nonVaColor ))
if bullBearStr
bullBearPower = 2 * array.get(volumeStorageB, level) – array.get(volumeStorageT, level)
startBoxIndex = profilePlacement == ‘Right’ ? bar_index + profileWidth + 1 + horizontalOffset + (bullBearPower > 0 ? 1 : -1) * int(bullBearPower / array.max(volumeStorageT) * (profileWidth – 9) * 1.75) : bar_index – lookbackLength
endBoxIndex = profilePlacement == ‘Right’ ? bar_index + profileWidth + 1 + horizontalOffset: startBoxIndex + (bullBearPower > 0 ? -1 : 1) * int(bullBearPower / array.max(volumeStorageT) * (profileWidth – 9) * 1.75 )
array.push(a_profile, box.new(startBoxIndex, priceLowest + (level + 0.1) * priceStep, endBoxIndex, priceLowest + (level + 0.9) * priceStep, bullBearPower > 0 ? bbStrUpColor : bbStrDownColor, bgcolor = bullBearPower > 0 ? bbStrUpColor : bbStrDownColor ))
// Volume Profile (Price by Volume) / Volume Histogram —————————————— //
// ———————————————————————————————- //
// Volume Weighted Colored Bars —————————————————————– //
group_volume_weighted_colored_bars = ‘Volume Weighted Colored Bars’
vwcb = input.bool(true, ‘Volume Weighted Colored Bars’, group=group_volume_weighted_colored_bars, tooltip=’Colors bars based on the bar\’s volume relative to volume moving average’)
vSMA = ta.sma(nzVolume, input.int(89, ‘Volume Moving Average Length’, group=group_volume_weighted_colored_bars))
upThesh = input.float(1.618, ‘Bold Bars avbove Volume Average * ‘, minval=1., step=.1, group=group_volume_weighted_colored_bars)
barcolor(vwcb and nzVolume ? nzVolume > vSMA * upThesh ? open < close ? #006400 : #910000 : nzVolume < vSMA * input.float(0.618, ‘Light Bars below Volume Average * ‘, minval=.1, step=.1, group=group_volume_weighted_colored_bars) ? open < close ? #7FFFD4 : #FF9800 : open < close ? color.green : color.red : na, title=’Volume Weighted Colored Bars’, editable = false)
// Volume Weighted Colored Bars —————————————————————– //
// ———————————————————————————————- //
// Alerts ————————————————————————————— //
priceTxt = str.tostring(close, format.mintick)
tickerTxt = syminfo.ticker
if ta.cross(close, priceLowest + (pocLevel + .50) * priceStep) and pointOfControl
alert(tickerTxt + ‘ Volume Profile : Price touches/crosses Point Of Control Line, price ‘ + priceTxt)
if ta.cross(close, priceLowest + (levelAbovePoc + 1.00) * priceStep) and valueAreaHigh
alert(tickerTxt + ‘ Volume Profile : Price touches/crosses Value Area High Line, price ‘ + priceTxt)
if ta.cross(close, priceLowest + (levelBelowPoc + 0.00) * priceStep) and valueAreaLow
alert(tickerTxt + ‘ Volume Profile : Price touches/crosses Value Area Low Line, price ‘ + priceTxt)
if nzVolume > vSMA * upThesh and vwcb
alert(tickerTxt + ‘ high volume, price ‘ + priceTxt)
// Alerts ————————————————————————————— //
// ———————————————————————————————- //
var table logo = table.new(position.bottom_right, 1, 1)
if barstate.islast
table.cell(logo, 0, 0, ‘☼☾ ‘, text_size=size.normal, text_color=color.teal)