Hello,
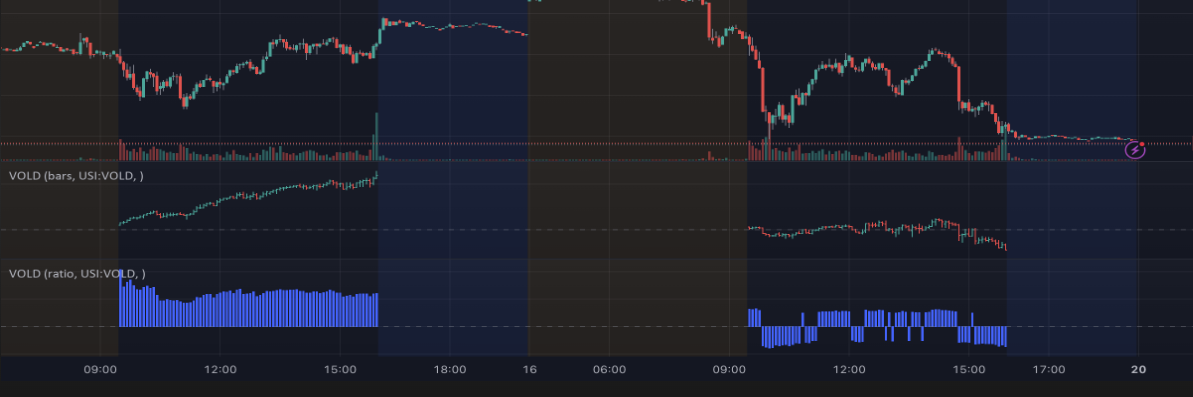
I am hoping someone in the team may be able to help convert the code below from trading view to real time pro. The code is for the VOLD data and VOLD ratio indictors based on SMB Capitals day trending course. I have copied the code below and also attached a screen shot of what the indicators look like. Any help would be really appreciated.
Thank you
Helen
// This source code is subject to the terms of the Mozilla Public License 2.0 at https://mozilla.org/MPL/2.0/
// © viewer405
//@version=5
indicator(title=”VOLD Indicator”, shorttitle=”VOLD”)
bullColor = #26a69a
bearColor = #ef5350
style = input.string(“line”, title=”Mode”, options=[“bars”, “line”, “candles”, “ratio”])
default = input.string(“USI:VOLD”, title=”Default Ticker”, options=[“USI:VOLD”, “USI:VOLDQ”, “USI:VOLDA”], tooltip = “The indicator will attempt to find the best VOLD match possible. If a match is not found, it will use this default.”)
enableSummaryTable = input.bool(true, “Enable Summary Table”)
enableThresholds = input.bool(false, “Enable Threshold Lines”)
timeInterval = input.timeframe(“”, title=”Time Interval”)
prefix = switch syminfo.prefix
“NYSE” => “USI:VOLD”
“NASDAQ” => “USI:VOLDQ”
“USI” => syminfo.ticker
=> “”
type = switch syminfo.type
“crypto” => “USI:VOLDQ” // Crypto is behaving like tech sector, use NASDAQ.
“economic” => “”
“fund” => “”
“cfd” => “” // (contract for difference)
“dr” => “” // (depository receipt)
“stock” => “USI:VOLDA”
“index” => “”
=> “”
index = switch syminfo.ticker
“ES” => “USI:VOLD”
“SPY” => “USI:VOLD”
“SPX” => “USI:VOLD”
“NQ” => “USI:VOLDQ”
“QQQ” => “USI:VOLDQ”
“TQQQ” => “USI:VOLDQ”
“NASDAQ” => “USI:VOLDQ”
“YM” => “USI:VOLD”
“DJI” => “USI:VOLD”
=> “”
ticker = prefix != “” ? prefix : (type != “” ? type : (index != “” ? index : default))
// As of 2022, TradingView has not yet resolved data issues when querying daily
// candlestick data for USI:VOLD. Use 390 minutes instead of the daily. It
// equates to 6 1/2 hours that the markets are open Monday to Friday.
if timeframe.isdaily and (style == “candles” or style == “ratio”)
timeInterval := ‘390’
uO = request.security(str.replace(ticker, “USI:VOLD”, “USI:UVOL”), timeInterval, open)
uH = request.security(str.replace(ticker, “USI:VOLD”, “USI:UVOL”), timeInterval, high)
uL = request.security(str.replace(ticker, “USI:VOLD”, “USI:UVOL”), timeInterval, low)
uC = request.security(str.replace(ticker, “USI:VOLD”, “USI:UVOL”), timeInterval, close)
dO = request.security(str.replace(ticker, “USI:VOLD”, “USI:DVOL”), timeInterval, open)
dH = request.security(str.replace(ticker, “USI:VOLD”, “USI:DVOL”), timeInterval, high)
dL = request.security(str.replace(ticker, “USI:VOLD”, “USI:DVOL”), timeInterval, low)
dC = request.security(str.replace(ticker, “USI:VOLD”, “USI:DVOL”), timeInterval, close)
ratio = uC > dC ? math.round(uC / dC, 2) : -math.round(dC / uC, 2)
o = request.security(ticker, timeInterval, open)
h = request.security(ticker, timeInterval, high)
l = request.security(ticker, timeInterval, low)
c = request.security(ticker, timeInterval, close)
isRegularSession = not session.ispremarket and not session.ispostmarket
o := isRegularSession ? o : na
h := isRegularSession ? h : na
l := isRegularSession ? l : na
c := isRegularSession ? c : na
ratio := isRegularSession ? ratio : na
if barstate.islast and enableSummaryTable and c != na and ratio != na
table legend = table.new(position.top_right, 2, 4, bgcolor = color.gray, frame_width = 2)
table.cell(legend, 0, 0, ticker + ” ” + str.tostring(c))
table.cell(legend, 0, 1, “Ratio: ” + str.tostring(ratio) + “:1”)
isBar = style == “bars” ? true : false
isLine = style == “line” ? true : false
isRatio = style == “ratio” ? true : false
isCandle = style == “candles” ? true : false
plot(c, style = plot.style_linebr, display=isLine ? display.all : display.none)
plot(ratio, style = plot.style_columns, display = isRatio ? display.all : display.none)
plotbar(open=o, high=h, low=l, close=c, color=c < o ? bearColor : bullColor, display=isBar ? display.all : display.none)
plotcandle(open=o, high=h, low=l, close=c, color=c < o ? bearColor : bullColor, bordercolor=na, display=isCandle ? display.all : display.none)
hline(0, “Middle Band”, color=color.new(#787B86, 50), display = display.all)
hline(100000000, “Upper Band +100M”, color=color.new(bullColor, 75), display = enableThresholds ? display.all : display.none)
hline(-100000000, “Lower Band -100M”, color=color.new(bearColor, 75), display = enableThresholds ? display.all : display.none)
hline(300000000, “Upper Band +300M”, color=color.new(bullColor, 50), display = enableThresholds ? display.all : display.none)
hline(-300000000, “Lower Band -300M”, color=color.new(bearColor, 50), display = enableThresholds ? display.all : display.none)
hline(500000000, “Upper Band +500M”, color=color.new(bullColor, 25), display = display.none)
hline(-500000000, “Lower Band -500M”, color=color.new(bearColor, 25), display = display.none)
hline(1000000000, “Upper Band +1000M”, color=color.new(bullColor, 0), display = display.none)
hline(-1000000000, “Lower Band -1000M”, color=color.new(bearColor, 0), display = display.none)