Please what precise instrument and timeframe?
Hi Nicolas, so I use it on dax daily, nasdaq daily and 4 hours, crude oil 4 hours and daily, it doesn’t work anywhere; the units are 10000; however I noticed that when I download the prc_supertrendvolatility it appears with -1 instead of -2 as it is reported on the link … maybe the correct file has not been loaded?
It depends of the units displayed, it fails somewhere back in history because of lack of volume or .. let me check again! 🙄
Yes, because there are no volumes far back in history (which are needed for the correct calculation of the indicator), so limit the units displayed and add Volume indicator on the chart to be sure volumes are present.
Hi Nicolas, first of all thank you for your availability, I have placed 1000 units, and I am not having any problems. You’ve been super nice, I’ve been looking for this indicator for a long time. Thanks again 🙂
Hi Nicolas,
Thanks so much for your great help on conversion!
May I ask you for further favor? Can you show me how to translate this indicator to a screener to indicate which stock fulfill the BUY/SELL signal?
i.e. based on the following part of the original script
long = trend == 1 and trend[1] == -1
short = trend == -1 and trend[1] == 1
//
last_long = 0.0
last_short = 0.0
last_long := long ? time : nz(last_long[1])
last_short := short ? time : nz(last_short[1])
buy = crossover(last_long, last_short)
sell = crossover(last_short, last_long)
Here is the screener version of that indicator:
//PRC_SuperTrend Volatility | screener
//Nicolas @ www.prorealcode.com

// --- settings
stmult   = 2 //Trend Multiplier minval = 0, maxval = 100, step = 0.01
stperiod = 10 //Trend Period
factor = 0.5 //Volatility Factor minval=0.1, maxval=5
// --- end of settings

if barindex>28 then
hilow = max(pointsize,((high - low)*100))
openclose = ((close - open)*100)
if volume<>volume[1] then
if close>close[1] then
myobv=myobv+volume
elsif close<close[1] then
myobv=myobv-volume
endif
endif
vol = (myobv / hilow)
spreadvol = (openclose * vol)
//VPT = spreadvol + cumsum(spreadvol)
windowlen = 28

vlen = 14
pricespread = std[windowlen](range)

vx =  spreadvol + cumsum(spreadvol)
smooth = average[vlen,1](vx)
vspread = std[windowlen](vx - smooth)
shadow = (vx - smooth) / vspread * pricespread

if shadow > 0 then
out = high + shadow
else
out = low + shadow
endif
// CALCULATIONS //
uplev =out - (stmult * averagetruerange[stperiod])
dnlev = out + (stmult * averagetruerange[stperiod])
//
iVolatility = 100 * summation[1](100 * averagetruerange[1] / low) / 100
perc = (iVolatility*0.01) *factor

c=barindex

n = dnlev
x =uplev

once lb = n
once hb = x
once l1 = out
once hl = out

if c = 0 then
if x >= hb[1] then
hb = x
hl = out
trend = 1
else
lb = n
l1 = out
trend = -1
endif
endif

if c > 1 then

if trend[1] > 0 then
hl = max(hl[1], out)
if x >= hb[1] then
hb = x
else

if n < hb[1] - hb[1] * perc then
lb = n
l1 = out

trend = -1
endif
endif
else
l1 = min(l1[1], out )

if n <= lb[1] then
lb = n
else


if x > lb[1] + lb[1] * perc then
hb = x
hl = out
trend = 1
endif
endif
endif
endif
endif

screener[trend<>trend[1]]
Hi Nicholas,
I try the screener version of SuperTrendVolatility SCREENER as provided by your last posted.
I encountered 2 issues:
- The screener always return NO RESULT. However, when I try to comment out the condition “if barindex>28 then …“, there is result. Can you enlight me? Is this condition need for screener?
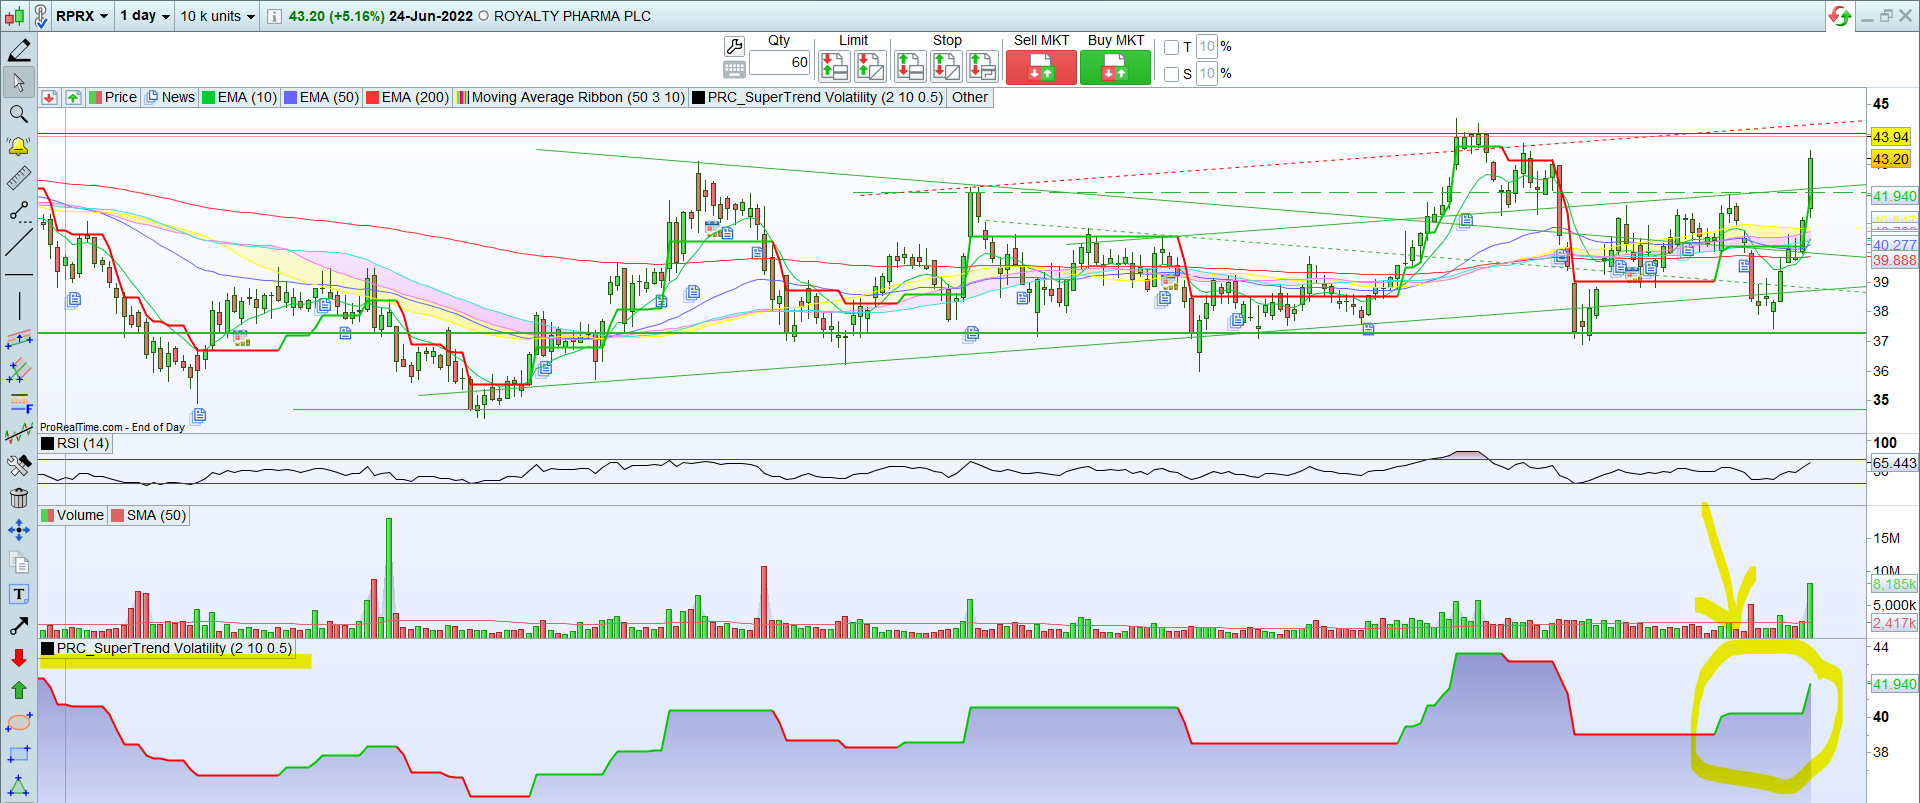
- After commented out the barindex condition, I try to further analyze the result by try scanning out the stock with trend = -1 with the clause “SCREENER[trend = -1]“. There is result available. However, when I try to further analyze the result by try scanning out the stock with trend = 1, there is NO result available. I have ensure there is stock has trend = 1 by finding one stock manually, putting it in my personal list, and use the screener with clause “SCREENER[trend = 1]“, but no result is available. See attached for the stock chart with SuperTrendVolatility trend captured. Any idea?
Appreciate your professional input!
Mike
Hi Nicolas,
do you have any idea of my queues on 25/Jun as recapped below, many thanks!
I try the screener version of SuperTrendVolatility SCREENER as provided by your last posted.
I encountered 2 issues:
- The screener always return NO RESULT. However, when I try to comment out the condition “if barindex>28 then …“, there is result. Can you enlight me? Is this condition need for screener?
- After commented out the barindexcondition, I try to further analyze the result by try scanning out the stock with trend = -1 with the clause “SCREENER[trend = -1]“. There is result available. However, when I try to further analyze the result by try scanning out the stock with trend = 1, there is NO result available. I have ensure there is stock has trend = 1 by finding one stock manually, putting it in my personal list, and use the screener with clause “SCREENER[trend = 1]“, but no result is available. See attached for the stock chart with SuperTrendVolatility trend captured. Any idea?
1/ not needed
2/ I think the problem could come from the vx variable which is cumulating values from the beginning of history, and since ProScreener doesnt share the same bars history as the one displayed on the charts (way less bars..), then the cumulation is different and the calculation of the indicator is different, therefore different results..
This is the simplier explanation I have right now without much investigation.
Hi Nicolas,
thanks so much for your speedy reply! Any suggestion to resolve the issue #2 so that the screener can work? Or under current ProRealCode capability it is infeasible?
Mike
Sorry, but as long as the 2 data series are different, their cumulation will be different, so I don’t know how it could be “resolved” 😆