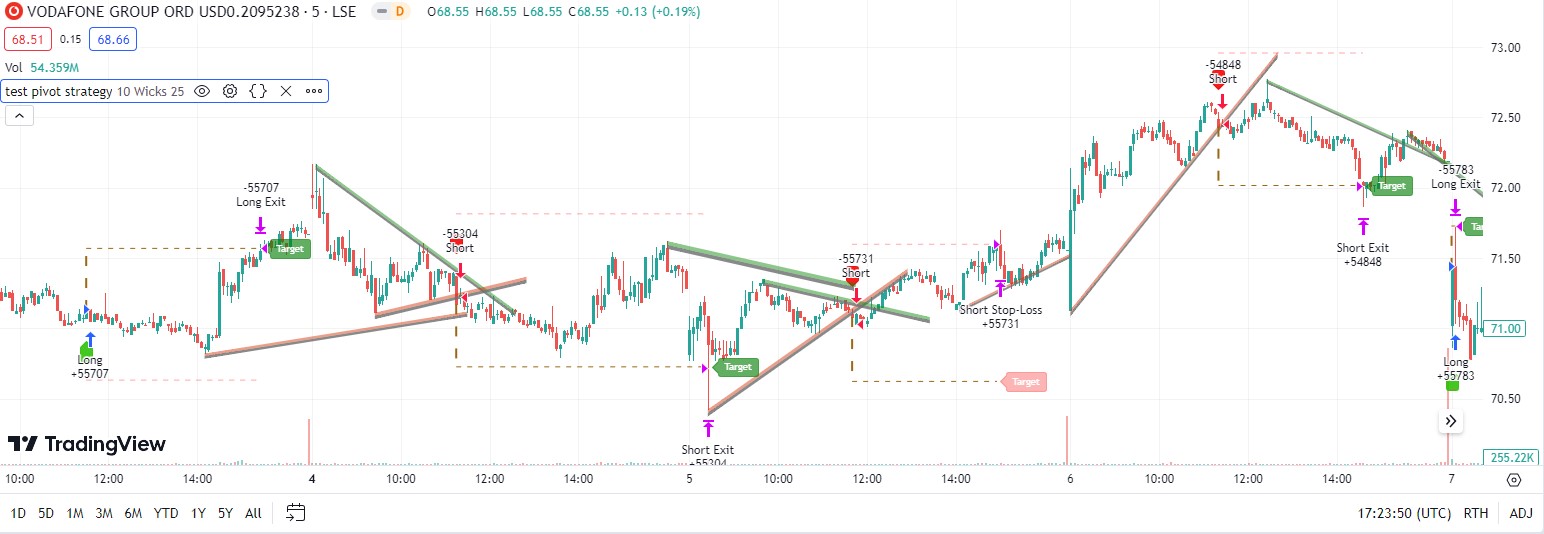
I have a trading strategy developed in PineScript language, but I want to be able to backtest it on ProRealTime. It is not a particularly complex strategy, it is based around a single indicator on TradingView. A lot of the code is related to how to display the strategy on a chart which isn’t needed, I just want the entry signals, profit targets and stop loss exits converted so I can backtest. I am attaching a screenshot of how the strategy is displayed on a chart, but as I say, I don’t need all this.
One thing about the trade exit on a loss to point out, exit is not at the actual value of the calculated stop loss, exit only happens if a price bar closes below the value of the set stop loss, exit is then at the open of the next price bar. On the other hand, trade exit at a profit should happen immediately when the price touches the preset target profit (TP) level.
I am pasting the code below that is working in TradingView, is there anyone that can convert this to the code for a system I can probacktest in ProRealTime?
//@version=1
strategy(“test pivot strategy”,overlay = true,max_bars_back = 500,max_lines_count = 500, initial_capital = 1000000 , currency = currency.USD, default_qty_value = 5, default_qty_type = strategy.percent_of_equity, slippage = 0, calc_on_every_tick = true, calc_on_order_fills = true, use_bar_magnifier = true)

bool ChartTime = time > chart.left_visible_bar_time and time < chart.right_visible_bar_time

string CORE = “➞ Core Settings 🔸”
var bool TradeisON = false
var bool LongTrade = false
var bool ShortTrade = false
var float TP = 0.0
var float SL = 0.0
int BarTIME = time – time[1]
var line tpLine = na
var line slLine = na
var label LAB = na
var int UpdatedX = 0
var float UpdatedY = 0.0
var float UpdatedSLP = 0.0
var int UpdatedXLow = 0
var float UpdatedYLow = 0.0
var float UpdatedSLPLow = 0.0

int Period = input.int(10, title=’     Period     ➞’,
group = CORE,
inline = “001”)

bool Trendtype = input.string(title = “     Type        ➞”,
defval=’Wicks’,
options=[‘Wicks’, ‘Body’],
group = CORE,
inline = “001”)
== ‘Wicks’

string Extensions = input.string(title=’     Extend    ➞’,
defval=’ 25′,
options=[‘ 25’, ‘ 50’, ‘ 75’],
group = CORE,
inline = “001”)

color LineCol1 = input.color(color.rgb(109, 111, 111, 19),””,group = CORE,inline = “001”)
bool ShowTargets = input.bool(true,”Show Targets”,group = CORE,inline = “002”)

ExtenSwitcher(ex) =>
switch ex
‘ 25’ => 1 ,
‘ 50’ => 2 ,
=> 3

WidthSwitcher(ex) =>
switch ex
‘1’ => 1 ,
‘2’ => 2 ,
=> 3

StyleSwitcher(style) =>
switch style
‘Dashed’ => line.style_dashed ,
‘Dotted’ => line.style_dotted ,
=> line.style_solid


method volAdj(int len)=>
math.min(ta.atr(len) * 0.3, close * (0.3/100)) [20] /2

Zband = volAdj(30)


method Trendlines(float src, int timeIndex,bool dir) =>

var int Start = 1 , var int End = 0 , var int TIME = 1
var float YEnd = 0, var float YStart = 0 , var float Slope = 0
var line Line1 = line.new(na,na,na,na)
var line Line2 = line.new(na,na,na,na)
var line Line3 = line.new(na,na,na,na)

SCR = fixnan(src)
if ta.change(SCR) != 0
TIME := time[timeIndex]
YStart := SCR[1]
Start := TIME[1]
Slope := (SCR – YStart) / (TIME – Start)
Slope

EXTime = ExtenSwitcher(Extensions) * BarTIME * 25
End := TIME + EXTime
YEnd := SCR + EXTime * Slope

if ta.change(SCR) != 0 and not TradeisON[1]
LineCond = Slope * time < 0 ? dir ? na : color.rgb(11, 139, 7, 53) : dir ? color.rgb(212, 46, 0, 54) : na
if not na(LineCond) //and ChartTime
Line1 := line.new(Start,
YStart,
End,
YEnd,
xloc.bar_time,
extend.none,
color=color.new(color.white,100)
)

Line2:=line.new(Start,
YStart – (Zband * 2),
End,
YEnd – (Zband * 2),
xloc.bar_time,
extend.none,
color=color.new(color.black,100)
)

Line3:=line.new(Start,
YStart – (Zband * 1),
End,
YEnd – (Zband * 1),
xloc.bar_time,
extend.none,
color=color.new(color.black,100)
)

linefill.new(Line3,Line2,color= LineCol1)
linefill.new(Line3,Line1,color= LineCond)
// linefill.new(Line,Line2,color= color.rgb(28, 15, 2, 76))

[Start, YStart, Slope]


PH = ta.pivothigh(Trendtype ? high : close > open ? close : open, Period, Period / 2)
PL = ta.pivotlow(Trendtype ? low : close > open ? open : close, Period, Period / 2)


method GetlinePrice(int TIME, float Price, float SLOP, int LookB) =>
var float Current = 0.0
EsTime = time – TIME
Current := Price + (EsTime – LookB * BarTIME) * SLOP
Current

method CheckCross(float Price, int StartTime, float StartPrice, float SLP) =>
var float Current = 0.0
var float Previous = 0.0
if StartPrice[Period] != StartPrice
Current := GetlinePrice(StartTime, StartPrice, SLP, 0)
Previous := GetlinePrice(StartTime, StartPrice, SLP, 1)
Crossover = Price[1] < Previous and Price > Current ? 1 : Price[1] > Previous – (Zband*0.1) and Price < Current – (Zband*0.1) ? -1 : 0
Crossover


[Xx, XZ, SLPXZ] = Trendlines(PH, Period / 2,false)
[XxL, XZL, SLPXZL] = Trendlines(PL, Period / 2, true)


if ta.change(fixnan(PH)) != 0
UpdatedX := Xx
UpdatedY := XZ
UpdatedSLP := SLPXZ
UpdatedSLP

if ta.change(fixnan(PL)) != 0
UpdatedXLow := XxL
UpdatedYLow := XZL
UpdatedSLPLow := SLPXZL
UpdatedSLPLow

Long = not (UpdatedSLP * time > 0)
and CheckCross(close, UpdatedX, UpdatedY, UpdatedSLP)== 1
and not TradeisON
Short = not (UpdatedSLPLow * time < 0)
and CheckCross(close, UpdatedXLow, UpdatedYLow, UpdatedSLPLow)==-1
and not TradeisON

TradeFire = Long or Short

if Long and not TradeisON
LongTrade:= true
ShortTrade:= false

if Short and not TradeisON
LongTrade:= false
ShortTrade:= true

if true
if TradeFire and not TradeisON
TP := switch
Long => high + (Zband *20)
Short => low – (Zband *20)

SL := switch
Long => low – (Zband *20)
Short => high + (Zband *20)
if Long
strategy.entry(“Long”, strategy.long)
strategy.exit(“Long Exit”, “Long”, limit = TP)
if Short
strategy.entry(“Short”, strategy.short)
strategy.exit(“Short Exit”, “Short”, limit = TP)
TradeisON:= true
if ShowTargets
line.new(bar_index,
Long ? high : low,
bar_index,
TP,
width=2,
color = color.rgb(154, 103, 20),
style= line.style_dashed)

tpLine:= line.new(bar_index,
TP,
bar_index+2,
TP,
style= line.style_dashed,
color = color.rgb(154, 103, 20)
)

slLine:= line.new(bar_index,
SL,
bar_index+2,
SL,
style= line.style_dashed,
color = color.new(color.red, 50)
)
LAB:=label.new(bar_index,
TP,
“Target”,
color = color.rgb(154, 103, 20),
style= label.style_label_left,
size=size.small,
textcolor = color.white
)
if TradeisON
line.set_x2(tpLine,bar_index)
line.set_x2(slLine,bar_index)
label.set_x(LAB,bar_index+1)

if LongTrade and TradeisON
if high >= TP
label.set_color(LAB,color.rgb(6, 128, 10, 37))
TradeisON:=false
if close <= SL
label.set_color(LAB,color.new(color.rgb(246, 7, 7),70))
TradeisON:=false
strategy.close(“Long”, comment = “Long Stop-Loss”)

else if ShortTrade and TradeisON

if low <= TP
label.set_color(LAB,color.rgb(6, 128, 10, 37))
TradeisON:=false

if close >= SL
label.set_color(LAB,color.new(color.rgb(246, 7, 7),70))
TradeisON:=false
strategy.close(“Short”, comment = “Short Stop-Loss”)


plotshape(Long and not TradeisON[1],
size = size.small,
color = color.rgb(46, 192, 6, 11),
location = location.belowbar,
style = shape.labelup ,
text = “”,
textcolor = color.white)

plotshape(Short and not TradeisON[1],
size = size.small,
color = color.rgb(241, 2, 2, 11),
location = location.abovebar,
style = shape.labeldown ,
text = “”,
textcolor = color.white)

// — END — .