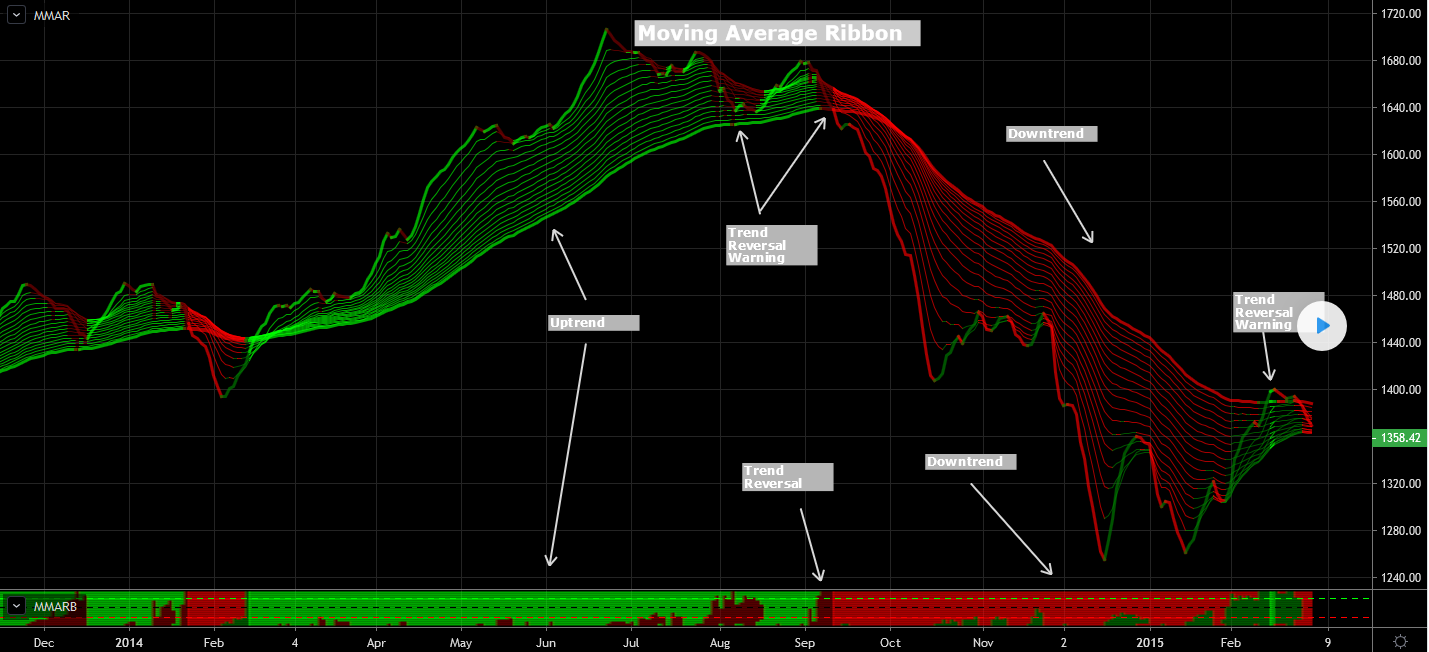
This plots a moving average ribbon, either exponential or standard. It provides an easy and fast way to determine the trend direction and possible reversals.
Lime : Uptrend. Long trading
Maroon : Reentry (buy the dip) or downtrend reversal warning
Red : Downtrend. Short trading
Green : Short Reentry (sell the peak) or uptrend reversal warning
To best determine if this is a reentry point or a trend reversal the MMARB (Madrid Moving Average Ribbon Bar) study is used. This is the bar located at the bottom. This bar signals when a current trend reentry is found (partially filled with opposite dark color) or when a trend reversal is ahead (completely filled with opposite dark color).
This study requires no parameters, and it can be used on any time frame.
[ I am particularly interested in the Bar implementation at the bottom of the screen]
Many thanks for your kind consideration.
//
// Madrid : 17/OCT/2014 22:51M: Moving Average Ribbon : 2.0 : MMAR
// http://madridjourneyonws.blogspot.com/
//
// This plots a moving average ribbon, either exponential or standard.
// This study is best viewed with a dark background.  It provides an easy
// and fast way to determine the trend direction and possible reversals.
//
// Lime : Uptrend. Long trading
// Green : Reentry (buy the dip) or downtrend reversal warning
// Red : Downtrend. Short trading
// Maroon : Short Reentry (sell the peak) or uptrend reversal warning
//
// To best determine if this is a reentry point or a trend reversal
// the MMARB (Madrid Moving Average Ribbon Bar) study is used.
// This is the bar located at the bottom.  This bar signals when a
// current trend reentry is found (partially filled with opposite dark color)
// or when a trend reversal is ahead (completely filled with opposite dark color).
//

study(title="Madrid Moving Average Ribbon", shorttitle="MMAR", overlay=true)
exponential = input(true, title="Exponential MA")

src = close

ma05 = exponential ? ema(src, 05) : sma(src, 05)
ma10 = exponential ? ema(src, 10) : sma(src, 10)
ma15 = exponential ? ema(src, 15) : sma(src, 15)
ma20 = exponential ? ema(src, 20) : sma(src, 20)
ma25 = exponential ? ema(src, 25) : sma(src, 25)
ma30 = exponential ? ema(src, 30) : sma(src, 30)
ma35 = exponential ? ema(src, 35) : sma(src, 35)
ma40 = exponential ? ema(src, 40) : sma(src, 40)
ma45 = exponential ? ema(src, 45) : sma(src, 45)
ma50 = exponential ? ema(src, 50) : sma(src, 50)
ma55 = exponential ? ema(src, 55) : sma(src, 55)
ma60 = exponential ? ema(src, 60) : sma(src, 60)
ma65 = exponential ? ema(src, 65) : sma(src, 65)
ma70 = exponential ? ema(src, 70) : sma(src, 70)
ma75 = exponential ? ema(src, 75) : sma(src, 75)
ma80 = exponential ? ema(src, 80) : sma(src, 80)
ma85 = exponential ? ema(src, 85) : sma(src, 85)
ma90 = exponential ? ema(src, 90) : sma(src, 90)
ma100 = exponential ? ema(src, 100) : sma(src, 100)

leadMAColor = change(ma05)>=0 and ma05>ma100 ? lime
            : change(ma05)<0  and ma05>ma100 ? maroon
            : change(ma05)<=0 and ma05<ma100 ? red
            : change(ma05)>=0 and ma05<ma100 ? green
            : gray
maColor(ma, maRef) =>
              change(ma)>=0 and ma05>maRef ? lime
            : change(ma)<0  and ma05>maRef ? maroon
            : change(ma)<=0 and ma05<maRef ? red
            : change(ma)>=0 and ma05<maRef ? green
            : gray

plot( ma05, color=leadMAColor, style=line, title="MMA05", linewidth=3)
plot( ma10, color=maColor(ma10,ma100), style=line, title="MMA10", linewidth=1)
plot( ma15, color=maColor(ma15,ma100), style=line, title="MMA15", linewidth=1)
plot( ma20, color=maColor(ma20,ma100), style=line, title="MMA20", linewidth=1)
plot( ma25, color=maColor(ma25,ma100), style=line, title="MMA25", linewidth=1)
plot( ma30, color=maColor(ma30,ma100), style=line, title="MMA30", linewidth=1)
plot( ma35, color=maColor(ma35,ma100), style=line, title="MMA35", linewidth=1)
plot( ma40, color=maColor(ma40,ma100), style=line, title="MMA40", linewidth=1)
plot( ma45, color=maColor(ma45,ma100), style=line, title="MMA45", linewidth=1)
plot( ma50, color=maColor(ma50,ma100), style=line, title="MMA50", linewidth=1)
plot( ma55, color=maColor(ma55,ma100), style=line, title="MMA55", linewidth=1)
plot( ma60, color=maColor(ma60,ma100), style=line, title="MMA60", linewidth=1)
plot( ma65, color=maColor(ma65,ma100), style=line, title="MMA65", linewidth=1)
plot( ma70, color=maColor(ma70,ma100), style=line, title="MMA70", linewidth=1)
plot( ma75, color=maColor(ma75,ma100), style=line, title="MMA75", linewidth=1)
plot( ma80, color=maColor(ma80,ma100), style=line, title="MMA80", linewidth=1)
plot( ma85, color=maColor(ma85,ma100), style=line, title="MMA85", linewidth=1)
plot( ma90, color=maColor(ma90,ma100), style=line, title="MMA90", linewidth=3)