Conversion of indicator from the amibroke to PRT
Description:
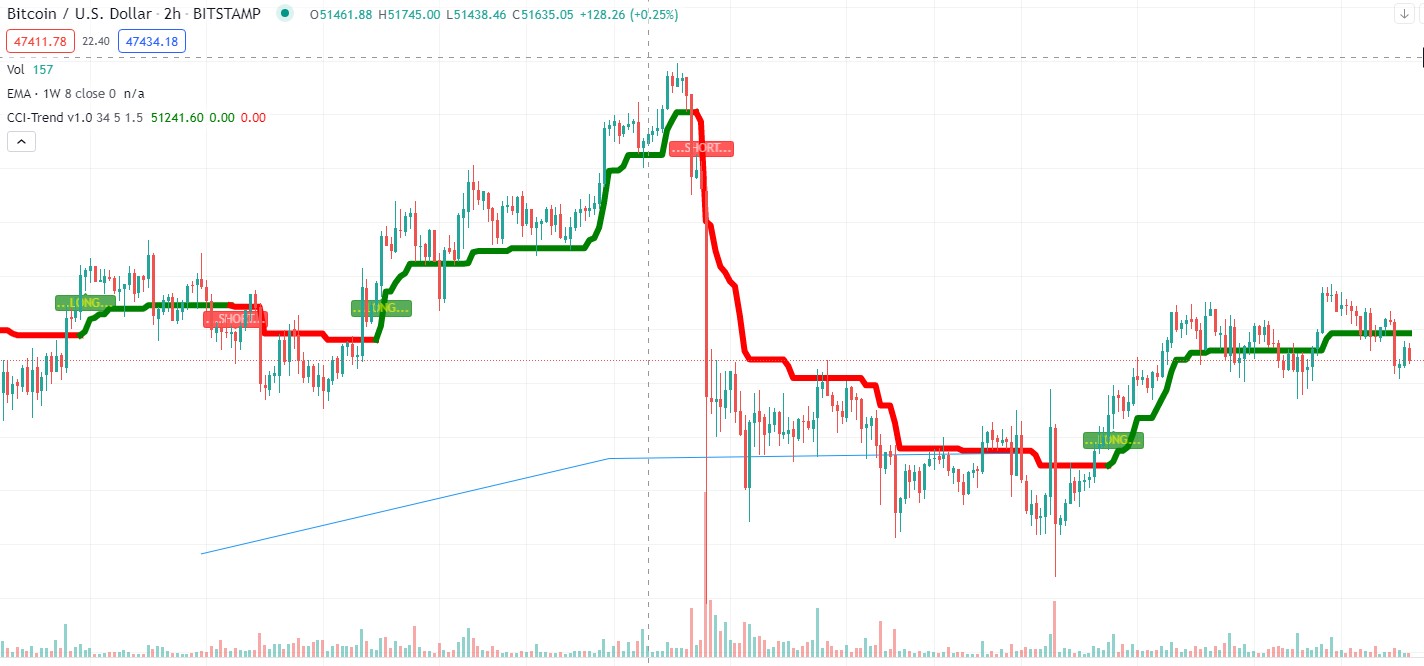
CCI-Trend is a trend trailing strategy based on sign alternation of the current CCI value.
The upper and lower bands are defined by hl2 (or (high+low)/2) +/- ATR*factor of ATR. The main TrendLine is combination of conditions of CCI-above-zero and CCI-below-zero.
Long/Short alerts are available, select “Long Condition”&“LONG Alert” as long alert and “Short Condition”&“SHORT Alert” as short alert.
Screenshot from the indicator in Tradingview
Amibroker code:
_SECTION_BEGIN(“MA Cross”);
e1=EMA(C,3);
e2=EMA(C,13);
Plot(e1,””,6,1);
Plot(e2,””,4,1);
b1=Cross(e1,e2);
s1=Cross(e2,e1);
Buysetup=Flip(b1,s1);
Shortsetup=Flip(s1,b1);
trend=IIf(BarsSince(Buysetup)<BarsSince(Shortsetup ),1,0);
Col=IIf(trend==1,5,4);
SetBarFillColor(Col);
Plot(C,”Close”,Col,64);
TimeFrameSet( inDaily );
a=(Ref(C,-1)+Ref(C,-2))/2;
b=(Ref(C,-1)+Ref(C,-2)+Ref(C,-3))/3;
q=(a+b)/2;
TimeFrameRestore();
Plot(TimeFrameExpand(q,inDaily),”OP”,colorCustom12,styleThick|styleDashed);
_SECTION_END();
_SECTION_BEGIN(“Signal Panel”);
no=10;
res=HHV(H,no);
sup=LLV(L,no);
avd=IIf(C>Ref(res,-1),1,IIf(C<Ref(sup,-1),-1,0));
avn=ValueWhen(avd!=0,avd,1);
s5d=IIf(avn==1,sup,res);
showsl = ParamToggle(“Stop Loss Line”, “Show|Hide”, 0);
if (showsl == 1)
{Plot(s5d,”Stop Loss”,colorCustom14,styleDots);}
exitlong = Cross(s5d, H);
PlotShapes(exitlong * shapeNone, colorBlack,0,H,-10);
exitshort = Cross(L, s5d);
PlotShapes(exitshort * shapeNone, colorBlack,0,L,-15);
Buy = exitshort;
Sell = exitlong;
//Short = Sell;
//Cover = Buy;
Buy = ExRem(Buy,Sell);
Sell = ExRem(Sell,Buy);
//Short = ExRem(Short, Cover);
//Cover = ExRem(Cover, Short);
AlertIf( Buy, “”, “Buy @ ” + C, 1 );
AlertIf( Sell, “”, “Sell @ ” + C, 2 );
for(i=BarCount-1;i>1;i–)
{
if(Buy[i] == 1)
{
entry = C[i];
sig = “Buy”;
sl = s5d[i];
tar1 = entry + (entry * .0050);
tar2 = entry + (entry * .0092);
tar3 = entry + (entry * .0179);
bars = i;
i = 0;
}
if(Sell[i] == 1)
{
sig = “Sell”;
entry = C[i];
sl = s5d[i];
tar1 = entry – (entry * .0050);
tar2 = entry – (entry * .0112);
tar3 = entry – (entry * .0212);
bars = i;
i = 0;
}
}
Offset = 20;
Clr = IIf(sig == “Buy”, colorLime, colorRed);
ssl = IIf(bars == BarCount-1, s5d[BarCount-1], Ref(s5d, -1));
sl = ssl[BarCount-1];
Plot(LineArray(bars-Offset, tar1, BarCount, tar1,1), “”, Clr, styleLine|styleDots, Null, Null, Offset);
Plot(LineArray(bars-Offset, tar2, BarCount, tar2,1), “”, Clr, styleLine|styleDots, Null, Null, Offset);
Plot(LineArray(bars-Offset, tar3, BarCount, tar3,1), “”, Clr, styleLine|styleDots, Null, Null, Offset);
Plot(LineArray(bars-Offset, sl, BarCount, sl,1), “”, colorDarkRed, styleLine|styleLine, Null, Null, Offset);
Plot(LineArray(bars-Offset, entry, BarCount, entry,1), “”, colorGreen, styleLine|styleLine, Null, Null, Offset);
for (i=bars; i <BarCount;i++)
{
PlotText(“”+sig+”@”+entry, BarCount-3,entry,Null,colorBlue);
PlotText(“TGT-1@”+tar1,BarCount-4,tar1,Null,Clr);PlotText(“TGT-2@”+tar2,BarCount-4,tar2,Null,Clr);PlotText (“TGT-3@”+tar3,BarCount-4,tar3,Null,Clr);
}
messageboard = ParamToggle(“Message Board”,”Show|Hide”,1);
if (messageboard == 1 )
{
GfxSelectFont( “Tahoma”, 13, 100 );
GfxSetBkMode( 1 );
GfxSetTextColor( colorWhite );
if ( sig ==”Buy”)
{
GfxSelectSolidBrush( colorBlue ); // this is the box background color
}
else
{
GfxSelectSolidBrush( colorRed ); // this is the box background color
}
pxHeight = Status( “pxchartheight” ) ;
xx = Status( “pxchartwidth”);
Left = 1100;
width = 310;
x = 5;
x2 = 310;
y = pxHeight;
GfxSelectPen( colorGreen, 5); // broader color
GfxRoundRect( x, y – 142, x2, y , 7, 7 ) ;
GfxTextOut( Name(),12,y-140);
GfxTextOut( ” Last Traded Price = “+ C , 08,y- 120 );
GfxTextOut( ( “Signal Panel”),160,y-140);
GfxTextOut( (” “),27,y-160);
GfxTextOut( (“Last ” + sig + ” Signal came ” + (BarCount-bars-1) * Interval()/60 + ” mins ago”), 13, y-100) ; // The text format location
GfxTextOut( (“” + WriteIf(sig ==”Buy”,sig + ” @ “,sig + ” @”) + ” : ” + entry), 13, y-80);
GfxTextOut( (“Trailing Stop Loss : ” + sl + ” (P/L:” + WriteVal(IIf(sig == “Sell”,entry-sl,sl-entry), 2.2) + “)”), 13, y-60);
GfxTextOut( (“TGT:1 : ” + tar1), 13, y -40);
GfxTextOut( (“Current Profit/Loss : ” + WriteVal(IIf(sig == “BUY”,(C-entry),(entry-C)),2.2)), 40, y-22);;
}
_SECTION_END();
_SECTION_BEGIN(“Magnified Market Price”);
//by Vidyasagar, vkunisetty@yahoo.com//
FS=Param(“Font Size”,30,11,100,1);
GfxSelectFont(“Times New Roman”, FS, 700, True );
GfxSetBkMode( colorWhite );
GfxSetTextColor( ParamColor(“Color”,colorGreen) );
Hor=Param(“Horizontal Position”,350,1,1200,1);
Ver=Param(“Vertical Position”,1,1,830,1);
GfxTextOut(“”+C, Hor , Ver );
YC=TimeFrameGetPrice(“C”,inDaily,-1);
DD=Prec(C-YC,2);
xx=Prec((DD/YC)*100,2);
GfxSelectFont(“Times New Roman”, 11, 700, True );
GfxSetBkMode( colorWhite );
GfxSetTextColor(ParamColor(“Color”,colorGreen) );
GfxTextOut(“”+DD+” (“+xx+”%)”, Hor , Ver+45 );
_SECTION_END();
_SECTION_BEGIN(“Background text”);
SetChartBkColor(colorWhite);
strWeekday = StrMid(“—sunday—Monday–TuesdayWednesday-Thursday–Friday–Saturday”, SelectedValue(DayOfWeek())*9,9);
GraphXSpace=Param(“GraphXSpace”,0,-55,200,1);
C13=Param(“fonts”,20,10,30,1 );
C14=Param(“left-right”,2.1,1.0,5.0,0.1 );
C15=Param(“up-down”,12,1,20,1 );
Miny = Status(“axisminy”);
Maxy = Status(“axismaxy”);
lvb = Status(“lastvisiblebar”);
fvb = Status(“firstvisiblebar”);
pxwidth = Status(“pxwidth”);
pxheight = Status(“pxheight”);
GfxSetBkMode(transparent=1);
GfxSetOverlayMode(1);
GfxSelectFont(“Candara”, Status(“pxheight”)/C13 );
GfxSetTextAlign( 6 );
GfxSetTextColor( ColorRGB (217,217,213));
GfxTextOut( Name(), Status(“pxwidth”)/C14, Status(“pxheight”)/C15 );
GfxSelectFont(“Tahoma”, Status(“pxheight”)/C13*0.5 );
GfxSetTextColor( ColorRGB (103,103,103));
GfxTextOut( “By”, Status(“pxwidth”)/C14, Status(“pxheight”)/C15*2.5 );
GfxSelectFont(“Candara”, Status(“pxheight”)/C13*0.5 );
GfxSetTextColor( ColorRGB (103,103,103));
GfxTextOut( “DR BHOIR G B”, Status(“pxwidth”)/C14, Status(“pxheight”)/C15*4 );
GfxSelectFont(“MS Sans Serif”, 10, 500, False, False, 0);
_SECTION_END();
/* Done by Rajandran R */
/* Author of http://www.marketcalls.in */
_SECTION_BEGIN(“Trend Magic”);
SetBarsRequired(100000,0);
GraphXSpace = 15;
SetChartOptions(0,chartShowArrows|chartShowDates);
SetChartBkColor(ParamColor(“bkcolor”,ColorRGB(0,0, 0)));
GfxSetBkMode(0);
GfxSetOverlayMode(1);
SetBarFillColor(IIf(C>O,ParamColor(“Candle UP Color”, colorGreen),IIf(C<=O,ParamColor(“Candle Down Color”, colorRed),colorLightGrey)));
Plot(C,”\nPrice”,IIf(C>O,ParamColor(“Wick UP Color”, colorDarkGreen),IIf(C<=O,ParamColor(“Wick Down Color”, colorDarkRed),colorLightGrey)),64,0,0,0,0);
//SetTradeDelays(1,1,1,1);
SetPositionSize(100,spsShares);
_N(Title = StrFormat(“{{NAME}} – {{INTERVAL}} {{DATE}} Open %g, Hi %g, Lo %g, Close %g (%.1f%%) {{VALUES}}”, O, H, L, C, SelectedValue( ROC( C, 1 ) ) ));
iCCI=Param(“CCI Period”,50,1,100,1);
Multiplier = Param(“Multiplier”,2,1,10,1);
Pd=Param(“ATR Periods”,5,1,10,1);
price = (O+H+L)/3;
iATR = ATR(Pd);
CCIvalue = CCIa(price,iCCI);
for (i = 0; i <iCCI+1; i++) {
TrendUp[i] = Null;
TrendDown[i] = Null;
}
TrendUp[BarCount-1]=Null;
TrendDown[BarCount-1]=Null;
for (i = iCCI+1; i <BarCount-1; i++) {
TrendUp[i] = Null;
TrendDown[i] = Null;
// if (CCIvalue[i]>=0 && CCIvalue[i-1]<0) {
// TrendUp[i-1]=TrendDown[i-1];
// }
// if (CCIvalue[i]<=0 && CCIvalue[i-1]>0) {
// TrendDown[i-1]=TrendUp[i-1];
// }
if (CCIvalue[i] >= 0)
{
TrendUp[i] = (High[i]+Low[i])/2 – Multiplier*iATR[i];
if (TrendUp[i] < TrendUp[i- 1])
TrendUp[i] = TrendUp[i- 1];
}
else
{
if (CCIvalue[i] <= 0)
{
TrendDown[i] = (High[i]+Low[i])/2 + Multiplier*iATR[i];
if (TrendDown[i] > TrendDown[i-1])
TrendDown[i] = TrendDown[i-1];
}
}
} //end for loop
Plot(TrendUp,”Trend”,colorGreen);
Plot(TrendDown,”Down”,colorRed);
Buy = IsNull(TrendDown) AND !IsNull(TrendUP);
Sell = IsNull(TrendUp) AND !IsNull(TrendDown);
Buy=ExRem(Buy,Sell);
Sell=ExRem(Sell,Buy);
Short=Sell;
Cover=Buy;
BuyPrice=ValueWhen(Buy,C);
SellPrice=ValueWhen(Sell,C);
ShortPrice=ValueWhen(Short,C);
CoverPrice=ValueWhen(Cover,C);
Title = EncodeColor(colorWhite)+ “DR BHOIR G B Modified Trend Magic ” + ” – ” + Name() + ” – ” + EncodeColor(colorRed)+ Interval(2) + EncodeColor(colorWhite) +
” – ” + Date() +” – “+”\n” +EncodeColor(colorRed) +”Op-“+O+” “+”Hi-“+H+” “+”Lo-“+L+” “+
“Cl-“+C+” “+ “Vol= “+ WriteVal(V)+”\n”+
EncodeColor(colorLime)+
WriteIf (Buy , ” GO LONG / Reverse Signal at “+C+” “,””)+
WriteIf (Sell , ” EXIT LONG / Reverse Signal at “+C+” “,””)+”\n”+EncodeColor(colorYellow)+
WriteIf(Sell , “Total Profit/Loss for the Last Trade Rs.”+(C-BuyPrice)+””,””)+
WriteIf(Buy , “Total Profit/Loss for the Last trade Rs.”+(SellPrice-C)+””,””);
PlotShapes(IIf(Buy, shapeSquare, shapeNone),colorGreen, 0, L, Offset=-40);
PlotShapes(IIf(Buy, shapeSquare, shapeNone),colorLime, 0,L, Offset=-50);
PlotShapes(IIf(Buy, shapeUpArrow, shapeNone),colorWhite, 0,L, Offset=-45);
PlotShapes(IIf(Short, shapeSquare, shapeNone),colorRed, 0, H, Offset=40);
PlotShapes(IIf(Short, shapeSquare, shapeNone),colorOrange, 0,H, Offset=50);
PlotShapes(IIf(Short, shapeDownArrow, shapeNone),colorWhite, 0,H, Offset=-45);
_SECTION_END();
_SECTION_BEGIN(“Time Left”);
function GetSecondNum()
{
Time = Now( 4 );
Seconds = int( Time % 100 );
Minutes = int( Time / 100 % 100 );
Hours = int( Time / 10000 % 100 );
SecondNum = int( Hours * 60 * 60 + Minutes * 60 + Seconds );
return SecondNum;
}
RequestTimedRefresh( 1 );
TimeFrame = Interval();
SecNumber = GetSecondNum();
Newperiod = SecNumber % TimeFrame == 0;
SecsLeft = SecNumber – int( SecNumber / TimeFrame ) * TimeFrame;
SecsToGo = TimeFrame – SecsLeft;
x=Param(“xposn”,50,0,1000,1);
y=Param(“yposn”,380,0,1000,1);
GfxSelectSolidBrush( ColorRGB( 230, 230, 230 ) );
GfxSelectPen( ColorRGB( 230, 230, 230 ), 2 );
if ( NewPeriod )
{
GfxSelectSolidBrush( colorYellow );
GfxSelectPen( colorYellow, 2 );
Say( “New period” );
}
//GfxRoundRect( x+45, y+40, x-3, y-2, 0, 0 );
//GfxSetBkMode(1);
GfxSelectFont( “Arial”, 14, 700, False );
GfxSetTextColor( colorRed );
GfxTextOut( “Time Left :”+SecsToGo+””, x, y );
_SECTION_END();