Conversion indicateur TradingView

Viewing 8 posts - 1 through 8 (of 8 total)
  • Author
    Posts
  • #233230 quote
    Garex
    Participant
    New

    Bonjour,

    Il y a quelque temps j’avais demandé un équivalent du code tradingview mais je ne peux plus accéder à la page. Par ailleurs, le code que l’on m’a proposé ne correspond pas tout à fait (ou peut-être les modifications que j’en ai faites).

    La page de l’indicateur (mentfx Structure) : mentfx Structure

    L’explication de l’auteur du code tradingview :

    The indicator is designed to identify and track swing highs and lows in a given market on any timeframe, and display them on the chart as solid lines (the lines you see are denoting highs and lows). The lines are customizable in terms of color and width, as determined by the user input.

    The rules for creating a new high or low are based on whether the current range is considered Bullish (most recent break being to the topside) or whether the current range is considered Bearish (most recent breaking being to the downside). If the range is Bullish, the code will allow for wicks below the low without updating the low, and will only change in the case that a candle’s body (open or close) finds itself under that given low. If the range is Bearish, the code will allow for wicks above the high without updating the high, and will only change in the case that a candle’s body (open or close) finds itself above that given high.

    When a range is assigned as being bullish, it will continue updating the high until a swing high is created (denoting that as the high of the range) and will not update or change until a candle’s body, open’s or close’s above it – which will reupdate the high and update the low. The low will be updated based on the last time price had a candle (open or closure) below a previous candles low, and then will find the lowest low after the rule was met to assign a low (the idea here is to locate the last major “sell before buy” and showcase that range. And this will occur vice versa, where: when a range is assigned as bearish, it will continue updating the low until a swing low is created (denoting that as the low of the range) and will not update or change until a candle’s body, open’s or close’s below it – which will reupdate the low and update the high. The high will be updated based on the last time price had a candle (open or closure) above a previous candles high, and then will find the highest high after the rule was met to assign a high (once again, the idea being to locate the last major “buy before sell” and showcase price as existing in that range.

    A swing high is considered as a high that has a lower high to its left and to its right. And a swing low is considered as a low that has a higher low to its left and to its right. These swings are used to determine the final high or low of a Bullish or Bearish range (respectively).

    Additionally, the script includes a function that updates the lines on the chart as new market data prints (using the logic described above).

    The indicator uses a specific method (mentioned above) based on the idea of “sells before buys” (for Bullish Ranges) and “buys before sells” (for Bearish Ranges) that isnt found in other indicator. The channels shown on the screen represent prior highs and lows, as well as current updated highs and lows based on this. The reason for using this way to track Structure is that we are assuming large money is selling before purchasing heavily, and buying before selling heavily, and these ranges attempt to showcase the structural delivery of price on any timeframe in reference to this theory – theory being that if we are in a bullish range, we are likely to sustain some sort of bullish move until the next high or for a while, or from the last “sell before buy” – and vice versa. As well as being able to merge the “context” or “story” of multiple timeframes in reference to this indicator as confluence for bullish or bearish continuations. Follow’s the school of thought that comes with trend following.

    Et le code PRT qu’il me reste :

    once bandebas= low
    once bandehaut=high
    once majbasom=0
    once majhautok=0
    if low<low[1] then
    prechaut= highest[barindex-barrefbas+1](high)
    endif
    
    if high>high[1] then
    precbas= lowest[barindex-barrefhaut+1](low)
    endif
    
    if close>bandehaut then
    bandehaut=high
    barrefhaut=barindex
    openrefbas= Low
    if majbasok then
    bandebas=precbas
    endif
    majbasok=0
    endif
    
    if close<bandebas then
    bandebas=low
    barrefbas=barindex
    openrefhaut= high
    if majhautok then
    bandehaut=prechaut
    endif
    majhautok=0
    endif
    
    if close<openrefbas then
    majbasok=1
    endif
    if close>openrefhaut then
    majhautok=1
    endif
    
    return bandehaut as "bande haute 1m", bandebas as "bande basse 1m"

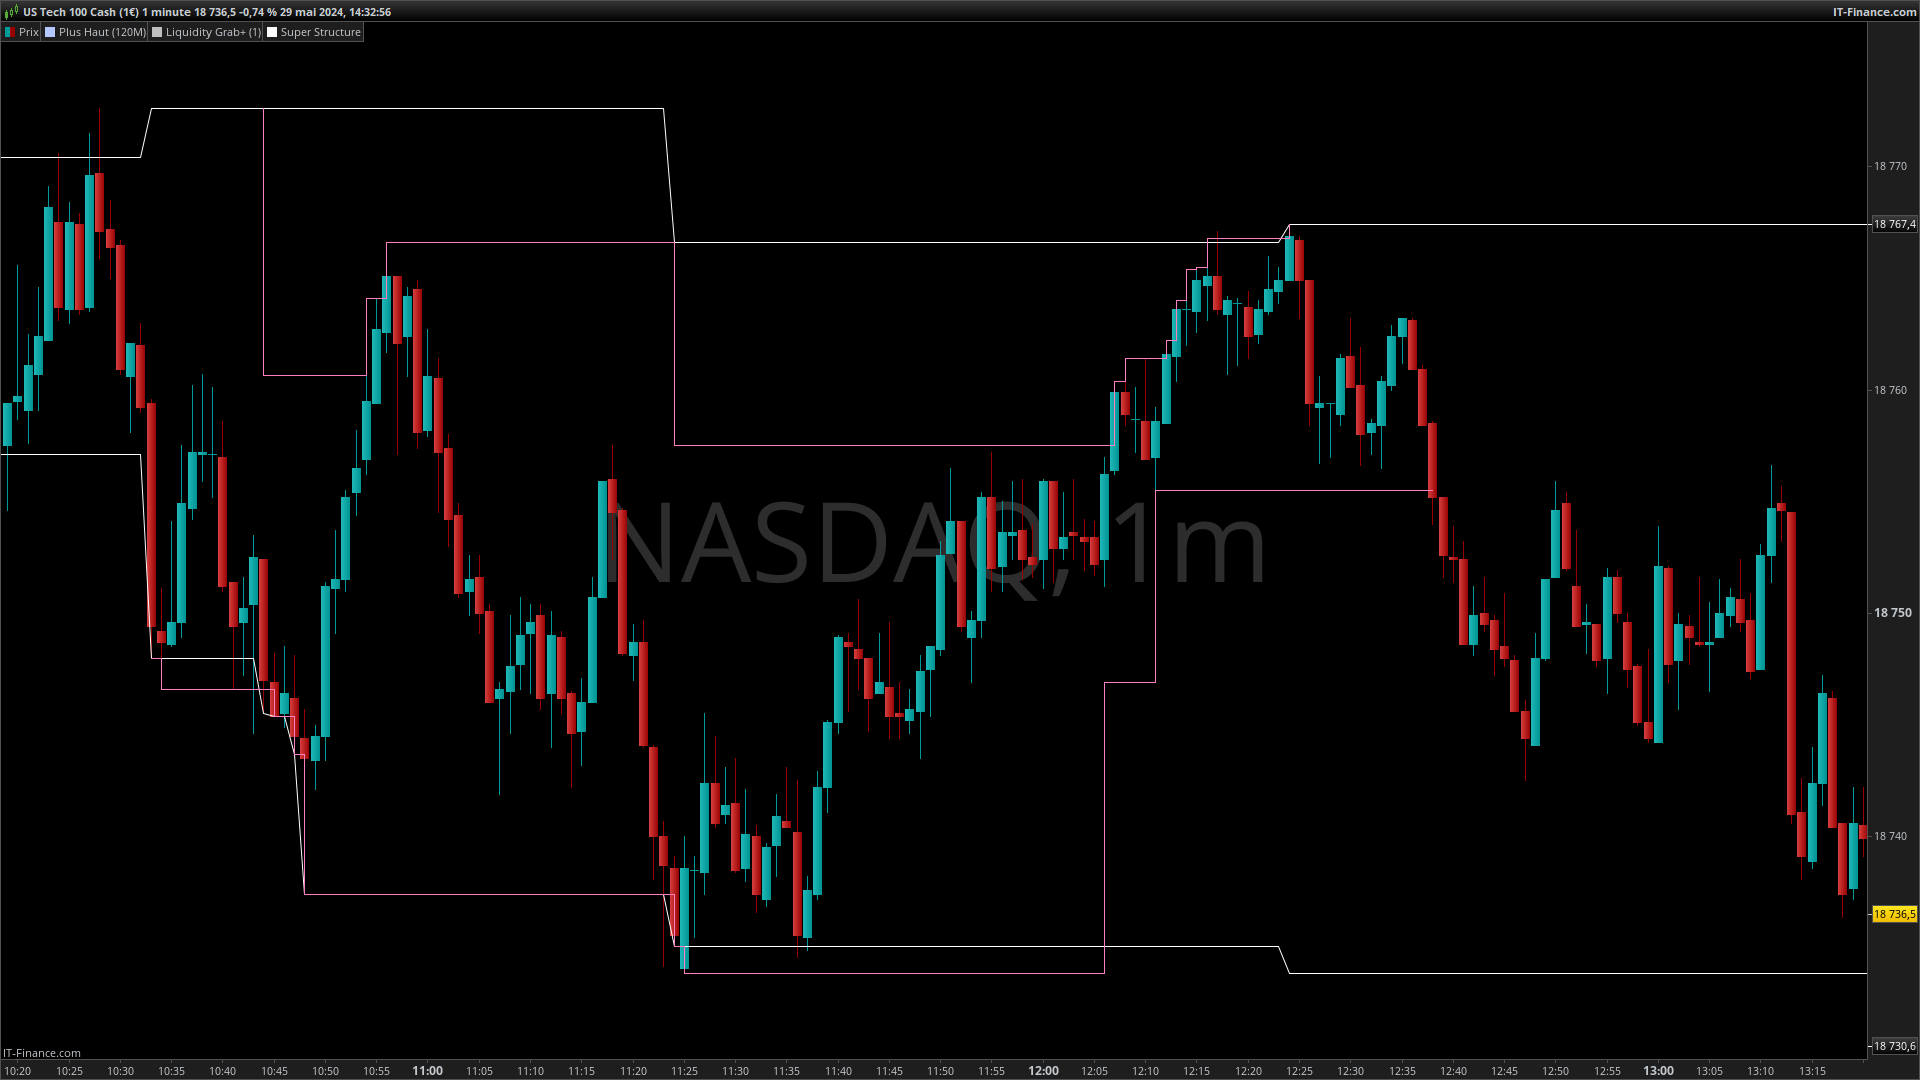
    L’image ci-dessous montre le comportement que j’obtiens en blanc et celui que j’aimerais avoir en rose.

    Exemple

    Si une bonne ame pouvait m’aider ça serait merveilleux.

    Bonne journée.

    Exemple.png Exemple.png
    #233282 quote
    Garex
    Participant
    New

    J’ai essayé de traduire l’explication du code TradingView en pseudo-langage informatique et j’obtiens ça :

    Haussier = Prix > BOS
    Baissier = Prix < BOS

    swingHaut = PlusHaut [2] < PlusHaut [1] and PlusHaut < PlusHaut [1]
    swingBas = Plusbas [2] > Plusbas [1] and Plusbas > Plusbas [1]

    If Range = Haussier then
    If close < plusbas then
    Maj plusbas
    BOS
    Endif

    If swingHaut = True Then
    If close > swingHaut then
    Plusbas =Lowest ( last low<Low[1])
    PlusHaut = Highest (last haut<Haut[1])
    Maj plusbas
    Maj PlusHaut
    endif
    Else
    PlusHaut= High
    Endif
    Endif

    If Range = Baissier then
    If close > plushaut then
    Maj plushaut
    BOS
    Endif
    If swingBas = True Then
    If close < swingBas then
    Plusbas =Lowest ( last low<Low[1])
    PlusHaut = Highest (last haut<Haut[1])
    Maj plusbas
    Maj PlusHaut
    Else
    PlusBas = Low
    Endif
    Endif

    #233284 quote
    Iván González
    Moderator
    Master

    Avez-vous le code Tradingview ? Ce serait beaucoup plus facile

    #233292 quote
    Garex
    Participant
    New

    Bonjour,

    Et non, je ne l’ai pas malheureusement, il n’est pas public.

    #233540 quote
    Iván González
    Moderator
    Master

    Hola, il a créé ce code qui vous intéressera :

    //-------------------------------------------------------------------//
    prd = 5
    src1 = low
    src2 = high
    //pivots low
    if src1 > src1[prd] and lowest[prd](src1) > src1[prd] and src1[prd] < lowest[prd](src1)[prd+1] then
    $ply[z+1] = src1[prd]
    $plx[z+1] = barindex[prd]
    z = z + 1
    endif
    //pivots high
    if src2 < src2[prd] and highest[prd](src2)<src2[prd] and src2[prd]>highest[prd](src2)[prd+1] then
    $phy[t+1]=src2[prd]
    $phx[t+1]=barindex[prd]
    t=t+1
    endif
    //-------------------------------------------------------------------//
    if barindex<prd*20 then
    lmax=high
    lmin=low
    bearish=0
    bullish=0
    else
    //--------------------------------------------------------------//
    if open > lmax[1] or close > lmax[1] and bearish then
    bullish=1
    bearish=0
    lmax=max(high,lmax[1])
    lmin=max($ply[z],lmin[1])
    elsif bullish then
    lmax=max(high,lmax[1])
    if open > lmax[1] or close > lmax[1] then
    lmin=max(lmin[1],$ply[z])
    elsif open<lmin[1] or close<lmin[1] then
    lmin=low
    bearish=1
    bullish=0
    else
    lmin=lmin[1]
    endif
    //--------------------------------------------------------------//
    elsif open < lmin[1] or close < lmin[1] and bullish then
    lmin=min(low,lmin[1])
    lmax=min($phy[t],lmax[1])
    bearish=1
    bullish=0
    elsif bearish then
    lmin=min(low,lmin[1])
    if open > lmax[1] or close > lmax[1] then
    lmax=max(high,lmax[1])
    bearish=0
    bullish=1
    elsif open < lmin[1] or close < lmin[1] then
    lmax=min(lmax[1],$phy[t])
    else
    lmax=lmax[1]
    endif
    endif
    endif
    //--------------------------------------------------------------//
    if bullish then
    backgroundcolor("green",50)
    elsif bearish then
    backgroundcolor("red",50)
    endif
    //--------------------------------------------------------------//
    return lmax as "Lmax" coloured("blue"), lmin as "lmin" coloured("red")//,$phy[t]style(dottedline),$ply[z]style(dottedline)
    
    Garex thanked this post
    #233567 quote
    Garex
    Participant
    New

    Merci Iván,

    je vais regarder ça.

    #233596 quote
    Garex
    Participant
    New

    Bonjour Iván,

    Le code ne se comporte pas comme attendu, les niveaux mis à jour lors d’une cassure de bande devraient correspondre :

    En cas de cassure à la baisse d’un range haussier : Au dernier plus haut comportant un plus haut[2] plus bas, un plus haut[1] plus haut et un plus haut[0] plus bas (en gros sur trois bougies en prenant les max, une figure tete épaule)

    Voici en blanc ce que le code devrait faire.

    Cordialement.

    exemple.png exemple.png
    #233688 quote
    Iván González
    Moderator
    Master

    Si vous modifiez la variable prd en prd=1 alors vous obtenez des valeurs plus similaires à celles que vous indiquez. Quoi qu'il en soit, comme je l'ai dit l'autre jour. C'est une approximation (je n'ai pas le code). Salutations

    Garex thanked this post
Viewing 8 posts - 1 through 8 (of 8 total)
  • You must be logged in to reply to this topic.

Conversion indicateur TradingView


ProBuilder : Indicateurs & Outils Personnalisés

New Reply
Author
author-avatar
Garex @garex Participant
Summary

This topic contains 7 replies,
has 2 voices, and was last updated by Iván González
1 year, 8 months ago.

Topic Details
Forum: ProBuilder : Indicateurs & Outils Personnalisés
Language: French
Started: 05/29/2024
Status: Active
Attachments: 2 files
Logo Logo
Loading...