ProRealCode - Trading & Coding with ProRealTime™
Bonjour,
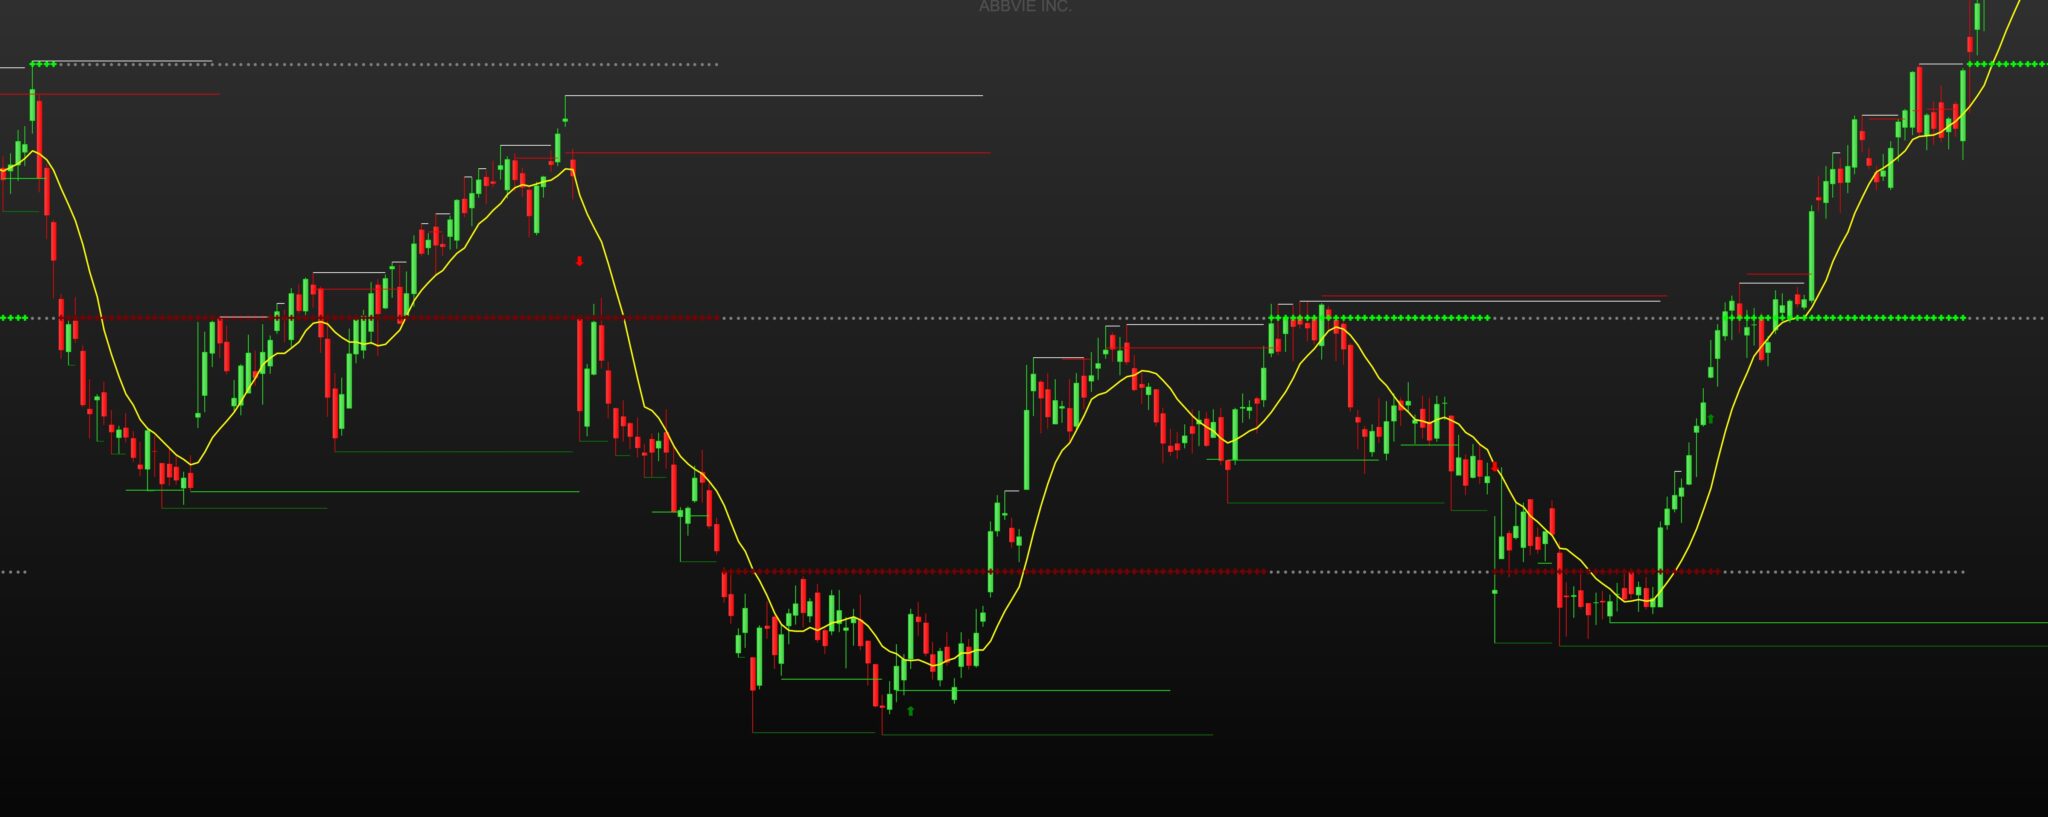
Un indicateur nommé Boxes trail sur TV semble interessant a utiliser. principalement sur les signaux achat long et court
Serais-t-il possible d’en faire la conversion pour PRT ?
Merci
//@version=3
study(title = "Boxes Trail v1", overlay = true)
trackprice = input(title='Track Price', type=bool, defval=false)
length1 = input(title='Support / Resistance length:', type=integer, defval=20)
top1 = valuewhen(high >= highest(high, length1), high, 0)
bot1 = valuewhen(low <= lowest(low, length1), low, 0)
plot(top1, color=top1 != top1[1] ? na : black, linewidth=1, offset=0, trackprice=trackprice, transp=0)
plot(bot1, color=bot1 != bot1[1] ? na : green, linewidth=1, offset=0, trackprice=trackprice, transp=0)
barlength = input(title='Bar length:', type=integer, defval=20)
length = input(title="Length", type=integer, defval=14, minval=1)
src = input(title="Source", type=source, defval=close)
factor = 0.0
slope = 0.0
for i = 1 to length
factor := 1 + 2 * (i - 1)
slope := slope + (src[i - 1]) * (length - factor) / 2
shmma = sma(src, length) + (6 * slope) / ((length + 1) * length)
newtop = shmma >= highest(shmma, barlength)
newbot = shmma <= lowest(shmma, barlength)
top = valuewhen(newtop, shmma, 0)
bot = valuewhen(newbot, shmma, 0)
plot(top, color=top != top[1] ? na : red, linewidth=1, offset=0, transp=0)
plot(bot, color=bot != bot[1] ? na : lime, linewidth=1, offset=0, transp=0)
//
mode = input('ATR', options=["ATR", "Traditional"])
modeValue = input(14.000, type=float)
bricksize = na
if mode == "ATR"
bricksize := atr(round(modeValue))
if mode == "Traditional"
bricksize := modeValue
showOverlay = input(false)
ropen = na
propen = nz(ropen[1])
ropen := close > propen+bricksize or high > propen+bricksize ? propen+bricksize : close < propen-bricksize or low < propen-bricksize ? propen-bricksize : propen
rclose = na
rclose := ropen > propen ? ropen-bricksize : ropen < propen ? ropen+bricksize : nz(rclose[1])
direction = na
direction := ropen > propen ? 1 : ropen < propen ? -1 : nz(direction[1])
rc = direction == 1 ? green : direction == -1 ? maroon : na
p00 = plot(not showOverlay ? na : ropen, style=cross, color=rc, linewidth=3)
p01 = plot(not showOverlay ? na : rclose, style=circles, color=gray, linewidth=2)
fill(p00, p01, color=gray, transp=75)
//
use2bars=input(false,title="use 2 bars?")
lookback=input(100, type=integer, minval=1, maxval=200,title="look back bars?")
range = high-low+0.000000001
range2= (highest(high,2)-lowest(low,2))+0.000000001
value1=na
value1:= close > open and range != 0 ? (range/(2*range+open-close))*close : value1
value1:= close < open and range != 0 ? ((range+close-open)/(2*range+close-open))*close: value1
value1:= close == open ? close:value1
value2 = close-value1
//using only one bar
value3 = abs(value1+value2)
value4 = value1*range
value5 = (value1-value2)*range
value6 = value2*range
value7 = (value2-value1)*range
value8 = value1/range
value9 = (value1-value2)/range
value10 = value2/range
value11 = (value2-value1)/range
value12 = value3/range
// Using two bars
value13 = use2bars?( value3+value3[1]):na
value14 = use2bars?(value1+value1[1])*range2:na
value15 = use2bars?(value1+value1[1]-value2-value2[1])*range2:na
value16 = use2bars?(value2+value2[1])*range2:na
value17 = use2bars?(value2+value2[1]-value1-value1[1])*range2:na
value18 = use2bars ? (value1+value1[1])/range2:na
value19 = use2bars ? (value1+value1[1]-value2-value2[1])/range2:na
value20 = use2bars ? (value2+value2[1])/range2:na
value21 = use2bars ? (value2+value2[1]-value1-value1[1])/range2:na
value22 = use2bars ? value13/range2:na
// one bar conditions
condition1 = value3 == lowest(value3,lookback)
condition2 = value4 == highest(value4,lookback) and close > open
condition3 = value5 == highest(value5,lookback) and close > open
condition4 = value6 == highest(value6,lookback) and close < open
condition5 = value7 == highest(value7,lookback) and close < open
condition6 = value8 == lowest(value8,lookback) and close < open
condition7 = value9 == lowest(value9,lookback) and close < open
condition8 = value10 == lowest(value10,lookback) and close > open
condition9 = value11 == lowest(value11,lookback) and close > open
condition10 = value12 == highest(value12,lookback)
// two bar conditions
condition11 = use2bars and value13 == lowest(value13,lookback)
condition12 = use2bars and value14 == highest(value14,lookback) and close > open and close[1] > open[1]
condition13 = use2bars and value15 == highest(value15,lookback) and close > open and close[1] > open[1]
condition14 = use2bars and value16 == highest(value16,lookback) and close < open and close[1] < open[1]
condition15 = use2bars and value17 == highest(value17,lookback) and close < open and close[1] < open[1]
condition16 = use2bars and value18 == lowest(value18,lookback) and close < open and close[1] < open[1]
condition17 = use2bars and value19 == lowest(value19,lookback) and close < open and close[1] < open[1]
condition18 = use2bars and value20 == lowest(value20,lookback) and close > open and close[1] > open[1]
condition19 = use2bars and value21 == lowest(value21,lookback) and close > open and close[1] > open[1]
condition20 = use2bars and value22 == highest(value22,lookback)
//Classifying the bars using one bar conditions, or using both one bar and two bar conditions simultaneosly if "use2bars" button selected.
lowvolume = (condition1 or condition11)
climaxupvolume = (condition2 or condition3 or condition8 or condition9 or condition12 or condition13 or condition18 or condition19)
climaxdownvolume = (condition4 or condition5 or condition6 or condition7 or condition14 or condition15 or condition16 or condition17)
churnvolume = (condition10 or condition20)
climaxchurnvolume = (condition10 or condition20) and (condition2 or condition3 or condition4 or condition5 or condition6 or condition7 or condition8 or condition9 or condition12 or condition13 or condition14 or condition15 or condition16 or condition17 or condition18 or condition19)
trend=1
supplyline=high
supportline=low
trend:=barstate.isfirst?1:close>nz(supplyline[1])?1:close<nz(supportline[1])?-1:nz(trend[1])
supplyline:= trend==1?climaxdownvolume?highest(2): high>supplyline[1]?high: supplyline[1]: climaxdownvolume?highest(2): supplyline[1]
supportline:= trend==-1? climaxupvolume? lowest(2): low<supportline[1]?low: supportline[1] : climaxupvolume?lowest(2): supportline[1]
trailing=trend==-1?supportline:supplyline
trailing1=trend==1?supportline:supplyline
//plot(trailing,title="trailline",color=trend==1?blue:red,linewidth=2,transp=0)
//plot(trailing1,title="trailline",color=trend==1?blue:red,linewidth=2,transp=0)
//
// Conditions
longCond = na
shortCond = na
longCond := crossover(trailing,trailing1)
shortCond := crossunder(trailing,trailing1)
// Count your long short conditions for more control with Pyramiding
sectionLongs = 0
sectionLongs := nz(sectionLongs[1])
sectionShorts = 0
sectionShorts := nz(sectionShorts[1])
if longCond
sectionLongs := sectionLongs + 1
sectionShorts := 0
if shortCond
sectionLongs := 0
sectionShorts := sectionShorts + 1
// Pyramiding
pyrl = 1
// These check to see your signal and cross references it against the pyramiding settings above
longCondition = longCond and sectionLongs <= pyrl
shortCondition = shortCond and sectionShorts <= pyrl
// Get the price of the last opened long or short
last_open_longCondition = na
last_open_shortCondition = na
last_open_longCondition := longCondition ? open : nz(last_open_longCondition[1])
last_open_shortCondition := shortCondition ? open : nz(last_open_shortCondition[1])
// Check if your last postion was a long or a short
last_longCondition = na
last_shortCondition = na
last_longCondition := longCondition ? time : nz(last_longCondition[1])
last_shortCondition := shortCondition ? time : nz(last_shortCondition[1])
in_longCondition = last_longCondition > last_shortCondition
in_shortCondition = last_shortCondition > last_longCondition
// Take profit
isTPl = input(false, "Take Profit Long")
isTPs = input(false, "Take Profit Short")
tp = input(2, "Take Profit %", type=float)
long_tp = isTPl and crossover(high, (1+(tp/100))*last_open_longCondition) and longCondition == 0 and in_longCondition == 1
short_tp = isTPs and crossunder(low, (1-(tp/100))*last_open_shortCondition) and shortCondition == 0 and in_shortCondition == 1
// Stop Loss
isSLl = input(false, "Stop Loss Long")
isSLs = input(false, "Stop Loss Short")
sl= 0.0
sl := input(3, "Stop Loss %", type=float)
long_sl = isSLl and crossunder(low, (1-(sl/100))*last_open_longCondition) and longCondition == 0 and in_longCondition == 1
short_sl = isSLs and crossover(high, (1+(sl/100))*last_open_shortCondition) and shortCondition == 0 and in_shortCondition == 1
// Create a single close for all the different closing conditions.
long_close = long_tp or long_sl ? 1 : 0
short_close = short_tp or short_sl ? 1 : 0
// Get the time of the last close
last_long_close = na
last_short_close = na
last_long_close := long_close ? time : nz(last_long_close[1])
last_short_close := short_close ? time : nz(last_short_close[1])
// Alerts & Signals
bton(b) => b ? 1 : 0
plotshape(longCondition , title="buy alert", color=green, textcolor=green, transp=0,
style=shape.triangleup, location=location.belowbar, size=size.small,text="LONG",offset=0)
plotshape(shortCondition, title="sell alert", color=red, textcolor=red, transp=0,
style=shape.triangledown, location=location.abovebar, size=size.small,text="SHORT",offset=0)
plotshape(long_tp and last_longCondition > nz(last_long_close[1]), text ="TP", title="Take Profit Long", style=shape.triangledown,
location=location.abovebar, color = red, editable = false, transp = 0)
plotshape(short_tp and last_shortCondition > nz(last_short_close[1]) , text ="TP", title="Take Profit Short", style=shape.triangleup,
location=location.belowbar, color = lime, editable = false, transp = 0)
ltp = iff(long_tp and last_longCondition > nz(last_long_close[1]), (1+(tp/100))*last_open_longCondition, na)
plot(ltp, style=cross, linewidth=3, color = white, editable = false)
stp = iff(short_tp and last_shortCondition > nz(last_short_close[1]), (1-(tp/100))*last_open_shortCondition, na)
plot(stp, style = cross, linewidth=3, color = white, editable = false)
plotshape(long_sl and last_longCondition > nz(last_long_close[1]), text ="SL", title="Stop Loss Long", style=shape.triangledown,
location=location.abovebar, color = red, editable = false, transp = 0)
plotshape(short_sl and last_shortCondition > nz(last_short_close[1]), text ="SL", title="Stop Loss Short", style=shape.triangleup,
location=location.belowbar, color = lime, editable = false, transp = 0)
lsl = iff(long_sl and last_longCondition > nz(last_long_close[1]), (1-(sl/100))*last_open_longCondition, na)
plot(lsl, style=cross, linewidth=3, color = white, editable = false)
ssl = iff(short_sl and last_shortCondition > nz(last_short_close[1]), (1+(sl/100))*last_open_shortCondition, na)
plot(ssl, style = cross, linewidth=3, color = white, editable = false)
//
alertcondition(bton(longCondition), title="Buy Alert")
alertcondition(bton(shortCondition), title="Sell Alert")
alertcondition(bton(long_tp and last_longCondition > nz(last_long_close[1])), title="Take Profit Long")
alertcondition(bton(short_tp and last_shortCondition > nz(last_short_close[1])), title="Take Profit Short")
alertcondition(bton(long_sl and last_longCondition > nz(last_long_close[1])), title="Stop Loss Long")
alertcondition(bton(short_sl and last_shortCondition > nz(last_short_close[1])), title="Stop Loss Short")
//
lien explicatif : https://www.tradingview.com/script/BJBqI74K-Boxes-Trail-v1/
Bonjour à tous
Voici la conversion en langage ProRealtime
//PRC_BOXES TRAIL
//version = 0
//26.02.24
//Iván González @ www.prorealcode.com
//Sharing ProRealTime knowledge
//////////////////////////////////////////////////
//inputs
length1 = 20 //Support / Resistance length
barlength = 20 //Bar length
length = 14 //Length
src = customclose //Source
mode = 0 //ATR or Traditional
modevalue = 14
showoverlay=1//Boolean
use2bars=0//Boolean
lookback=100
isTPl = 0 //Boolean // take profit long
isTPs = 0 //Boolean // take profit short
tp = 2 //% take profit
isSLl = 0 //Boolean // stop loss long
isSLs = 0 //Boolean // stop loss short
sl = 3 //% stop loss
//////
////Resistance lines
if high>=highest[length1](high) then
t1 = 0
top1 = high
else
top1 = top1
t1 = t1+1
drawsegment(barindex - t1,top1,barindex,top1)coloured("black")
endif
////Support lines
if low<=lowest[length1](low) then
b1 = 0
bot1 = low
else
bot1 = bot1
b1 = b1+1
drawsegment(barindex - b1,bot1,barindex,bot1)coloured("green")
endif
/////
factor = 0
slope = 0
for i=1 to length do
factor = 1+2*(i-1)
slope = slope + (src[i-1])*(length-factor)/2
next
shmma = average[length](src)+6*slope/((length+1)*length)
if shmma >= highest[barlength](shmma) then
top2 = shmma
t2 = 0
else
top2 = top2
t2 = t2+1
drawsegment(barindex-t2,top2,barindex,top2)coloured("red")
endif
if shmma <= lowest[barlength](shmma) then
bot2 = shmma
b2 = 0
else
bot2 = bot2
b2 = b2+1
drawsegment(barindex-b2,bot2,barindex,bot2)coloured("lime")
endif
////bricksize
if mode then
bricksize = averagetruerange[round(modevalue)]
else
bricksize = modevalue
endif
////
if barindex < 2 then
propen = 0
ropen = 0
rclose = 0
else
propen = ropen[1]
if close > propen+bricksize or high > propen+bricksize then
ropen = propen+bricksize
elsif close < propen-bricksize or low < propen-bricksize then
ropen = propen-bricksize
else
ropen = propen
endif
if ropen > propen then
rclose = ropen-bricksize
elsif ropen < propen then
rclose = ropen+bricksize
else
rclose = rclose[1]
endif
if ropen > propen then
direction = 1
r=0
g=255
b=0
elsif ropen < propen then
direction = -1
r=120
g=0
b=0
else
direction = direction[1]
endif
if showoverlay then
drawtext("✚",barindex,ropen)coloured(r,g,b)
drawtext("•",barindex,rclose)coloured("gray")
endif
endif
///////////
range1=high-low+0.000000001
range2=highest[2](high)-lowest[2](low)+0.000000001
if close > open and range1<>0 then
value1=(range1/(2*range1+open-close))*close
elsif close < open and range1<>0 then
value1=((range1+close-open)/(2*range1+close-open))*close
elsif close=open then
value1=close
else
value1 = value1
endif
value2=close-value1
///using only one bar
value3 = abs(value1+value2)
value4 = value1*range1
value5 = (value1-value2)*range1
value6 = value2*range1
value7 = (value2-value1)*range1
value8 = value1/range1
value9 = (value1-value2)/range1
value10 = value2/range1
value11 = (value2-value1)/range1
value12 = value3/range1
// Using two bars
if use2bars then
value13 = value3+value3[1]
value14 = (value1+value1[1])*range2
value15 = (value1+value1[1]-value2-value2[1])*range2
value16 = (value2+value2[1])*range2
value17 = (value2+value2[1]-value1-value1[1])*range2
value18 = (value1+value1[1])/range2
value19 = (value1+value1[1]-value2-value2[1])/range2
value20 = (value2+value2[1])/range2
value21 = (value2+value2[1]-value1-value1[1])/range2
value22 = value13/range2
endif
// one bar conditions
condition1 = value3 = lowest[lookback](value3)
condition2 = value4 = highest[lookback](value4) and close > open
condition3 = value5 = highest[lookback](value5) and close > open
condition4 = value6 = highest[lookback](value6) and close < open
condition5 = value7 = highest[lookback](value7) and close < open
condition6 = value8 =lowest[lookback](value8) and close < open
condition7 = value9 =lowest[lookback](value9) and close < open
condition8 = value10 =lowest[lookback](value10) and close > open
condition9 = value11 =lowest[lookback](value11) and close > open
condition10 = value12 =highest[lookback](value12)
// two bar conditions
condition11 = use2bars and value13 = lowest[lookback](value13)
condition12 = use2bars and value14 =highest[lookback](value14) and close > open and close[1] > open[1]
condition13 = use2bars and value15 =highest[lookback](value15) and close > open and close[1] > open[1]
condition14 = use2bars and value16 =highest[lookback](value16) and close < open and close[1] < open[1]
condition15 = use2bars and value17 =highest[lookback](value17) and close < open and close[1] < open[1]
condition16 = use2bars and value18 =lowest[lookback](value18) and close < open and close[1] < open[1]
condition17 = use2bars and value19 =lowest[lookback](value19) and close < open and close[1] < open[1]
condition18 = use2bars and value20 =lowest[lookback](value20) and close > open and close[1] > open[1]
condition19 = use2bars and value21 =lowest[lookback](value21) and close > open and close[1] > open[1]
condition20 = use2bars and value22 =highest[lookback](value22)
//Classifying the bars using one bar conditions, or using both one bar and two bar conditions simultaneosly if "use2bars" button selected.
lowvolume = (condition1 or condition11)
climaxupvolume = (condition2 or condition3 or condition8 or condition9 or condition12 or condition13 or condition18 or condition19)
climaxdownvolume = (condition4 or condition5 or condition6 or condition7 or condition14 or condition15 or condition16 or condition17)
churnvolume = (condition10 or condition20)
climaxchurnvolume = (condition10 or condition20) and (condition2 or condition3 or condition4 or condition5 or condition6 or condition7 or condition8 or condition9 or condition12 or condition13 or condition14 or condition15 or condition16 or condition17 or condition18 or condition19)
if barindex<2 then
trend=1
supplyline=high
supportline=low
elsif close>supplyline[1] then
trend=1
elsif close<supportline[1] then
trend=-1
else
trend=trend[1]
endif
if trend=1 then
if climaxdownvolume then
supplyline=highest[2](high)
elsif high>supplyline[1] then
supplyline=high
else
supplyline=supplyline[1]
endif
else
if climaxdownvolume then
supplyline=highest[2](high)
else
supplyline=supplyline[1]
endif
endif
if trend=-1 then
if climaxupvolume then
supportline=lowest[2](low)
elsif low < supportline[1] then
supportline=low
else
supportline=supportline[1]
endif
else
if climaxupvolume then
supportline=lowest[2](low)
else
supportline=supportline[1]
endif
endif
if trend=-1 then
trailing2 = supportline
else
trailing2 = supplyline
endif
if trend=1 then
trailing1 = supportline
else
trailing1 = supplyline
endif
longcond = trailing2 crosses over trailing1
shortcond = trailing2 crosses under trailing1
if barindex < 2 then
sectionlongs=0
sectionshorts=0
else
if longcond then
sectionlongs=sectionlongs+1
sectionshorts=0
elsif shortcond then
sectionlongs=0
sectionshorts=sectionshorts+1
endif
endif
// Pyramiding
pyrl = 1
// These check to see your signal and cross references it against the pyramiding settings above
longCondition = longCond and sectionLongs <= pyrl
shortCondition = shortCond and sectionShorts <= pyrl
if barindex < 2 then
lastopenlongCondition=0
lastopenshortCondition=0
lastlongCondition = 0
lastshortCondition = 0
else
// Get the price of the last opened long or short
if longCondition then
lastopenlongCondition = open
else
lastopenlongCondition = lastopenlongCondition[1]
endif
if shortCondition then
lastopenshortCondition = open
else
lastopenshortCondition = lastopenshortCondition[1]
endif
// Check if your last postion was a long or a short
if longCondition then
lastlongCondition = barindex
else
lastlongCondition = lastlongCondition[1]
endif
if shortCondition then
lastshortCondition = barindex
else
lastshortCondition = lastshortCondition[1]
endif
endif
inlongcondition = lastlongcondition > lastshortcondition
inshortcondition = lastlongcondition < lastshortcondition
// Take profit
longTP = isTPl and high crosses over (1+(tp/100))*lastopenlongCondition and longcondition = 0 and inlongcondition
shortTP = isTPs and low crosses under (1-(tp/100))*lastopenshortCondition and shortcondition = 0 and inshortcondition
// Stop Loss
longSL = isSLl and low crosses under (1-(sl/100))*lastopenlongCondition and longcondition = 0 and inlongcondition
shortSL = isSLs and high crosses over (1+(sl/100))*lastopenshortCondition and shortcondition = 0 and inshortcondition
// Create a single close for all the different closing conditions.
if barindex < 2 then
lastlongClose = 0
lastshortClose = 0
else
if longTP or longSL then
longclose = 1
lastlongclose = barindex
else
longclose = 0
lastlongclose = lastlongclose[1]
endif
if shortTP or shortSL then
shortclose = 1
lastshortclose = barindex
else
shortclose = 0
lastshortclose = lastshortclose[1]
endif
endif
// Signals
if longcondition then
drawarrowup(barindex,low-0.15*averagetruerange[10](close))coloured("green")
elsif shortcondition then
drawarrowdown(barindex,high+0.15*averagetruerange[10](close))coloured("red")
endif
if longTP and lastlongCondition>lastlongclose[1] then
drawtext("TPlg",barindex,high+0.15*averagetruerange[10](close))coloured("red")
drawpoint(barindex,(1+(tp/100))*lastopenlongcondition,2)coloured("white")
elsif shortTP and lastshortCondition>lastshortclose[1] then
drawtext("TPsh",barindex,low-0.15*averagetruerange[10](close))coloured("green")
drawpoint(barindex,(1-(tp/100))*lastopenshortcondition,2)coloured("white")
elsif longSL and lastlongcondition>lastlongclose[1] then
drawtext("SLlg",barindex,high+0.15*averagetruerange[10](close))coloured("red")
drawpoint(barindex,(1-(sl/100))*lastopenlongcondition,2)coloured("white")
elsif shortSL and lastshortcondition>lastshortclose[1] then
drawtext("SLsh",barindex,low-0.15*averagetruerange[10](close))coloured("green")
drawpoint(barindex,(1+(sl/100))*lastopenshortcondition,2)coloured("white")
endif
return
Merci pour ce travail.
J’ai un petit souci concernant l’affichage des éléments qui se trouvent en fin de code, je ne vois pas les inscriptions TPlg,Tpsh,SLlg etc… de quoi pourrais provenir ce probeleme ? J’ai tenté de changer les parametres de couleurs et de “distance” pour l’ffichage mais rien n’y fait. Voir photo ; Merci
if longTP and lastlongCondition>lastlongclose[1] then
drawtext("TPlg",barindex,high+0.15*averagetruerange[10](close))coloured("red")
drawpoint(barindex,(1+(tp/100))*lastopenlongcondition,2)coloured("white")
elsif shortTP and lastshortCondition>lastshortclose[1] then
drawtext("TPsh",barindex,low-0.15*averagetruerange[10](close))coloured("green")
drawpoint(barindex,(1-(tp/100))*lastopenshortcondition,2)coloured("white")
elsif longSL and lastlongcondition>lastlongclose[1] then
drawtext("SLlg",barindex,high+0.15*averagetruerange[10](close))coloured("red")
drawpoint(barindex,(1-(sl/100))*lastopenlongcondition,2)coloured("white")
elsif shortSL and lastshortcondition>lastshortclose[1] then
drawtext("SLsh",barindex,low-0.15*averagetruerange[10](close))coloured("green")
drawpoint(barindex,(1+(sl/100))*lastopenshortcondition,2)coloured("white")
endif
Bonjour
pour afficher ces éléments il faut passer les valeurs booléennes suivantes de 0 à 1
isTPl =1 //Boolean // take profit long
isTPs =1 //Boolean // take profit short
merci pour la réponse rapide
Conversion indicateur Boxes Trail v1 de TV a PRT
This topic contains 4 replies,
has 3 voices, and was last updated by maxlys
1 year, 11 months ago.
| Forum: | ProBuilder : Indicateurs & Outils Personnalisés |
| Language: | French |
| Started: | 02/09/2024 |
| Status: | Active |
| Attachments: | 1 files |
The information collected on this form is stored in a computer file by ProRealCode to create and access your ProRealCode profile. This data is kept in a secure database for the duration of the member's membership. They will be kept as long as you use our services and will be automatically deleted after 3 years of inactivity. Your personal data is used to create your private profile on ProRealCode. This data is maintained by SAS ProRealCode, 407 rue Freycinet, 59151 Arleux, France. If you subscribe to our newsletters, your email address is provided to our service provider "MailChimp" located in the United States, with whom we have signed a confidentiality agreement. This company is also compliant with the EU/Swiss Privacy Shield, and the GDPR. For any request for correction or deletion concerning your data, you can directly contact the ProRealCode team by email at privacy@prorealcode.com If you would like to lodge a complaint regarding the use of your personal data, you can contact your data protection supervisory authority.