Conversión indicador EMA 9/21 con Precio Objetivo

Viewing 8 posts - 1 through 8 (of 8 total)
  • Author
    Posts
  • #226412 quote
    cjr30
    Participant
    Master

    Solicito si es posible, ayuda para intentar convertir el indicador adjunto.

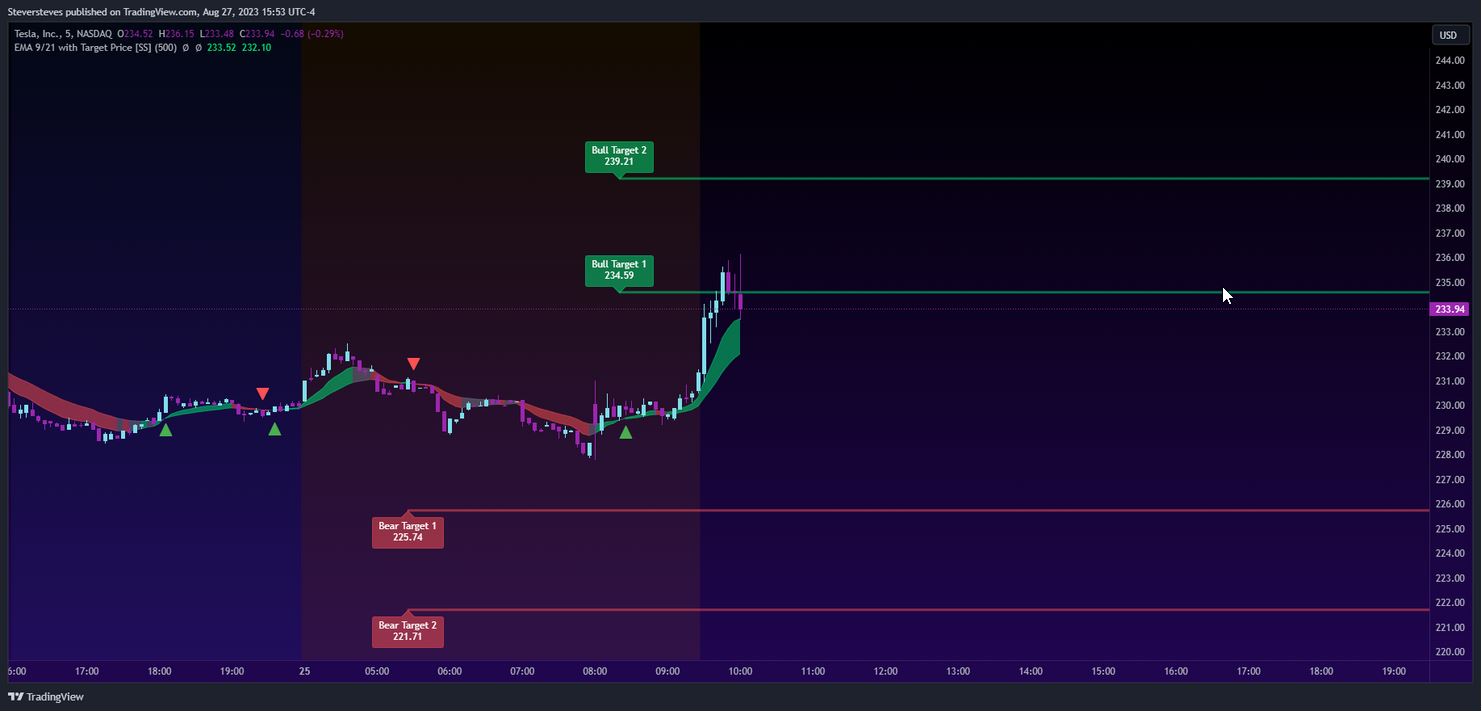
    Dicho indicador procede de Tradingview , utilizando arrays. Esencialmente, solo combina 2  EMA  ( 9 y  21, totalmente configurables lógicamente) con un análisis basado en ATR para calcular el rango promedio que experimenta el precio después de un cruce de EMA 9 / 21 bien al alza o a la baja.

    La longitud del ATR está predeterminada en 500, pero una vez más indico que es personalizable.

    Adjunto gráfico y código:

    // © Steversteves
    //@version=5
    indicator(“EMA 9/21 with Target Price [SS]”, overlay=true)
    arraylookback =     input.float(500, “ATR Lookback Length”)
    showlbls =          input.bool(true, “Show Target Price Labels”)
    ema9=ta.ema(close,9)
    ema21=ta.ema(close,21)
    // determine the crossover points
    ema9_cross_ema21 = ta.crossover(ema9, ema21)
    ema21_cross_ema9 = ta.crossover(ema21, ema9)
    // plot arrows on the chart at the crossover points
    plotshape(ema9_cross_ema21 ? close : na, title=”Up Arrow”, location=location.belowbar, style=shape.triangleup, size=size.small, color=color.green)
    plotshape(ema21_cross_ema9 ? close : na, title=”Down Arrow”, location=location.abovebar, style=shape.triangledown, size=size.small, color=color.red)
    // sentiment
    boolbullish=close>=ema9andclose>=ema21
    boolbearish=close<=ema9andclose<=ema21
    boolneutral=close<ema9andclose>ema21
    // define colours
    bull =          color.new(color.lime, 50)
    bear=          color.new(color.red,50)
    white=         color.white
    neutralcolor=color.new(color.gray,50)
    crossovercolor = color.new(color.purple, 75)
    crossundercolor=color.new(color.orange,75)
    color pallette = bullish ? bull : bearish ? bear : neutralcolor
    coloremacolor=ema9_cross_ema21?crossovercolor:ema21_cross_ema9?crossundercolor:pallette
    filla=plot(ema9,color=emacolor,linewidth=1)
    fillb = plot(ema21, color=emacolor, linewidth=1)
    fill(filla, fillb, color=pallette)
    boolabove_ema=close>=ema9andclose>=ema21
    boolbelow_ema=close<ema9andclose<=ema21
    boolcrossover=ema9_cross_ema21
    boolcrossunder=ema21_cross_ema9
    bull_a=array.new_float()
    open_a=array.new_float()
    crossover_a=array.new_float()
    crossunder_a=array.new_float()
    bear_a=array.new_float()
    fori=0toarraylookback
        ifabove_ema[i]
            array.push(bull_a,close[i])
        ifcrossover[i]
            array.push(crossover_a, close[i])
            array.push(open_a,open[i])
        ifbelow_ema[i]
            array.push(bear_a,close[i])
        ifcrossunder[i]
            array.push(crossunder_a,close[i])
    max_above=array.max(bull_a)
    crossover_avg=array.avg(crossover_a)
    max_below=array.min(bear_a)
    crossunder_avg=array.avg(crossunder_a)
    bull_dif1=(max_above-crossover_avg)/2
    bull_dif2=(max_above-crossover_avg)
    bear_dif1=(crossunder_avg-max_below)/2
    bear_dif2=(crossunder_avg-max_below)
    floatop=0.0
    floatbull_tgt=0.0
    floatbull_tgt_2=0.0
    floatbear_tgt=0.0
    floatbear_tgt_2=0.0
    varlabelbull_tgt_1_lbl=na
    varlabelbull_tgt_2_lbl=na
    varlabelbear_tgt_1_lbl=na
    varlabelbear_tgt_2_lbl=na
    var line bull_tgt_lin = na
    varlinebull_tgt_lin_2=na
    varlinebear_tgt_lin=na
    varlinebear_tgt_lin_2=na
    ifcrossover
        if array.size(open_a) > 0
            op:=array.get(open_a,0)
        bull_tgt := op + bull_dif1
        bull_tgt_2 := op + bull_dif2
    ifcrossunder
        ifarray.size(open_a)>0
            op:=array.get(open_a,0)
        bear_tgt:=op-bear_dif1
        bear_tgt_2:=op-bear_dif2
    if crossover and barstate.isconfirmed
        line.delete(bull_tgt_lin)
        line.delete(bull_tgt_lin_2)
        label.delete(bull_tgt_1_lbl)
        label.delete(bull_tgt_2_lbl)
        bull_tgt_lin := line.new(bar_index[1], y1 = bull_tgt, x2= bar_index, y2 = bull_tgt, extend = extend.right, color = bull, width=3)
        bull_tgt_lin_2 := line.new(bar_index[1], y1 = bull_tgt_2, x2= bar_index, y2 = bull_tgt_2, extend = extend.right, color = bull, width=3)
        ifshowlbls
            bull_tgt_1_lbl := label.new(bar_index[1], y = bull_tgt, text = “Bull Target 1 \n” + str.tostring(math.round(bull_tgt,2)), color = bull, textcolor = white)
            bull_tgt_2_lbl := label.new(bar_index[1], y = bull_tgt_2, text = “Bull Target 2 \n” + str.tostring(math.round(bull_tgt_2,2)), color = bull, textcolor = white)
    if crossunder and barstate.isconfirmed
        line.delete(bear_tgt_lin)
        line.delete(bear_tgt_lin_2)
        label.delete(bear_tgt_1_lbl)
        label.delete(bear_tgt_2_lbl)
        bear_tgt_lin:=line.new(bar_index[1],y1=bear_tgt,x2=bar_index,y2=bear_tgt,extend=extend.right,color=bear,width=3)
        bear_tgt_lin_2 := line.new(bar_index[1], y1 = bear_tgt_2, x2= bar_index, y2 = bear_tgt_2, extend = extend.right, color = bear, width=3)
        if showlbls
            bear_tgt_1_lbl := label.new(bar_index[1], y = bear_tgt, text = “Bear Target 1 \n” + str.tostring(math.round(bear_tgt,2)), color = bear, style=label.style_label_up, textcolor = white)
            bear_tgt_2_lbl := label.new(bar_index[1], y = bear_tgt_2, text = “Bear Target 2 \n” + str.tostring(math.round(bear_tgt_2,2)), color = bear, style=label.style_label_up, textcolor = white)
    alertcondition(crossover,”EMA 9/21 Crossover”,”Bullish Cross”)
    alertcondition(crossunder, “EMA 9/21 Crossunder”, “Bearish Cross”)
    #226415 quote
    robertogozzi
    Moderator
    Master

    No incrustes documentos (imágenes y otros archivos) en tus publicaciones, ya que esto ralentizará la carga de la página.

    Utilice únicamente el botón “select file”.

    Gracias 🙂

    #226421 quote
    cjr30
    Participant
    Master

    Uff, lo siento

    #226732 quote
    cjr30
    Participant
    Master

    Buenas tardes, he intentado convertir yo mismo el indicador, pero dado mi desconocimiento de las arrays me indica lo siguiente: “se espera un campo entero positivo para SRC” y creo que es por algo relacionado con las arrays.

    Podría alguien ayudarme.

    Muchas gracias por anticipado.


    //EMA 9/21 with Target Price
    
    arraylookback = 500
    
    ema9 = exponentialaverage[9](close)
    ema21 = exponentialaverage[21](close)
    bullish = close >= ema9 and close >= ema21
    bearish = close <= ema9 and close <= ema21
    neutral = close < ema9 and close > ema21
    aboveema = close >= ema9 and close >= ema21
    belowema = close < ema9 and close <= ema21
    crossover = ema9 crosses over ema21
    crossunder = ema21 crosses over ema9
    
    ///////////////////////////////
    for i = 0 to arraylookback
    if aboveema[i] then
    $bulla[i] = close[i]
    if crossover[i] then
    $crossovera[i] = close[i]
    $opena[i] = open[i]
    if belowema[i] then
    $beara[i] = close[i]
    if crossunder[i] then
    $crossundera[i] = close[i]
    endif
    endif
    endif
    endif
    
    /////////////////////////////
        
    maxabove = arraymax($bulla)
    crossoveravg = average($crossovera[arraylookback])
    maxbelow = arraymax($beara)
    crossunderavg = average($crossundera[arraylookback])
    
    bulldif1 = (maxabove - crossoveravg) / 2
    bulldif2 = (maxabove - crossoveravg)
    beardif1 = (crossunderavg - maxbelow) / 2
    beardif2 = (crossunderavg - maxbelow)
    
    if crossover then
    if $opena[i] > 0 then
    op= open
    bulltgt = round(op + bulldif1)
    bulltgt2 = round(op + bulldif2)
    if crossunder then
    if $opena[i] > 0 then
    op= open
    beartgt = round(op - beardif1)
    beartgt2= round(op - beardif2)
    endif
    endif
    endif
    endif
    next
    if crossover then
    DRAWSEGMENT(barindex,op,barindex+10,op)coloured(255,255,0)
    DRAWSEGMENT(barindex,op,barindex+10,op)coloured(255,255,0)
    DRAWTEXT("#bulltgt#",barindex,open,SansSerif,Bold,16)coloured(153,0,0)
    DRAWTEXT("#bulltgt2#",barindex,open,SansSerif,Bold,16)coloured(153,0,0)
    endif
    
    
    if crossunder then
    DRAWSEGMENT(barindex,op,barindex+10,op)coloured(255,255,0)
    DRAWSEGMENT(barindex,op,barindex+10,op)coloured(255,255,0)
    DRAWTEXT("#beartgt#",barindex,open,SansSerif,Bold,16)coloured(153,0,0)
    DRAWTEXT("#beartgt2#",barindex,open,SansSerif,Bold,16)coloured(153,0,0)
    endif
    return
    #228015 quote
    cjr30
    Participant
    Master

    Alguien podría decirme u orientarme por favor, si mi intento de programación del indicador que solicité, tiene algo que ver con el.

    Realmente me da error y no me representa nada.

    Siento ser tan pesado.

    #228024 quote
    Iván González
    Moderator
    Master

    Hola
    Le echo un vistazo y te digo.
    Ten en cuenta que hay bastantes solicitudes de traducción de tradingview a Prt.

    #228027 quote
    cjr30
    Participant
    Master

    Muchas gracias Iván, tranquilo, cuando puedas.

    #228075 quote
    Iván González
    Moderator
    Master
Viewing 8 posts - 1 through 8 (of 8 total)
  • You must be logged in to reply to this topic.

Conversión indicador EMA 9/21 con Precio Objetivo


ProBuilder: Indicadores y Herramientas

New Reply
Author
author-avatar
cjr30 @cjr30 Participant
Summary

This topic contains 7 replies,
has 3 voices, and was last updated by Iván González
1 year, 11 months ago.

Topic Details
Forum: ProBuilder: Indicadores y Herramientas
Language: Spanish
Started: 01/16/2024
Status: Active
Attachments: 1 files
Logo Logo
Loading...