Hello Nico, Ivan and other,
could you please convert this trading view indicator to PRT : Fibonacci Golden Wave?
I would like backtest this indicator by combination with vwap divergence
Details of the fibo indicator here :
https://www.tradingview.com/script/SWe51Ddl-Fibonacci-Golden-Wave-Flux-Charts/
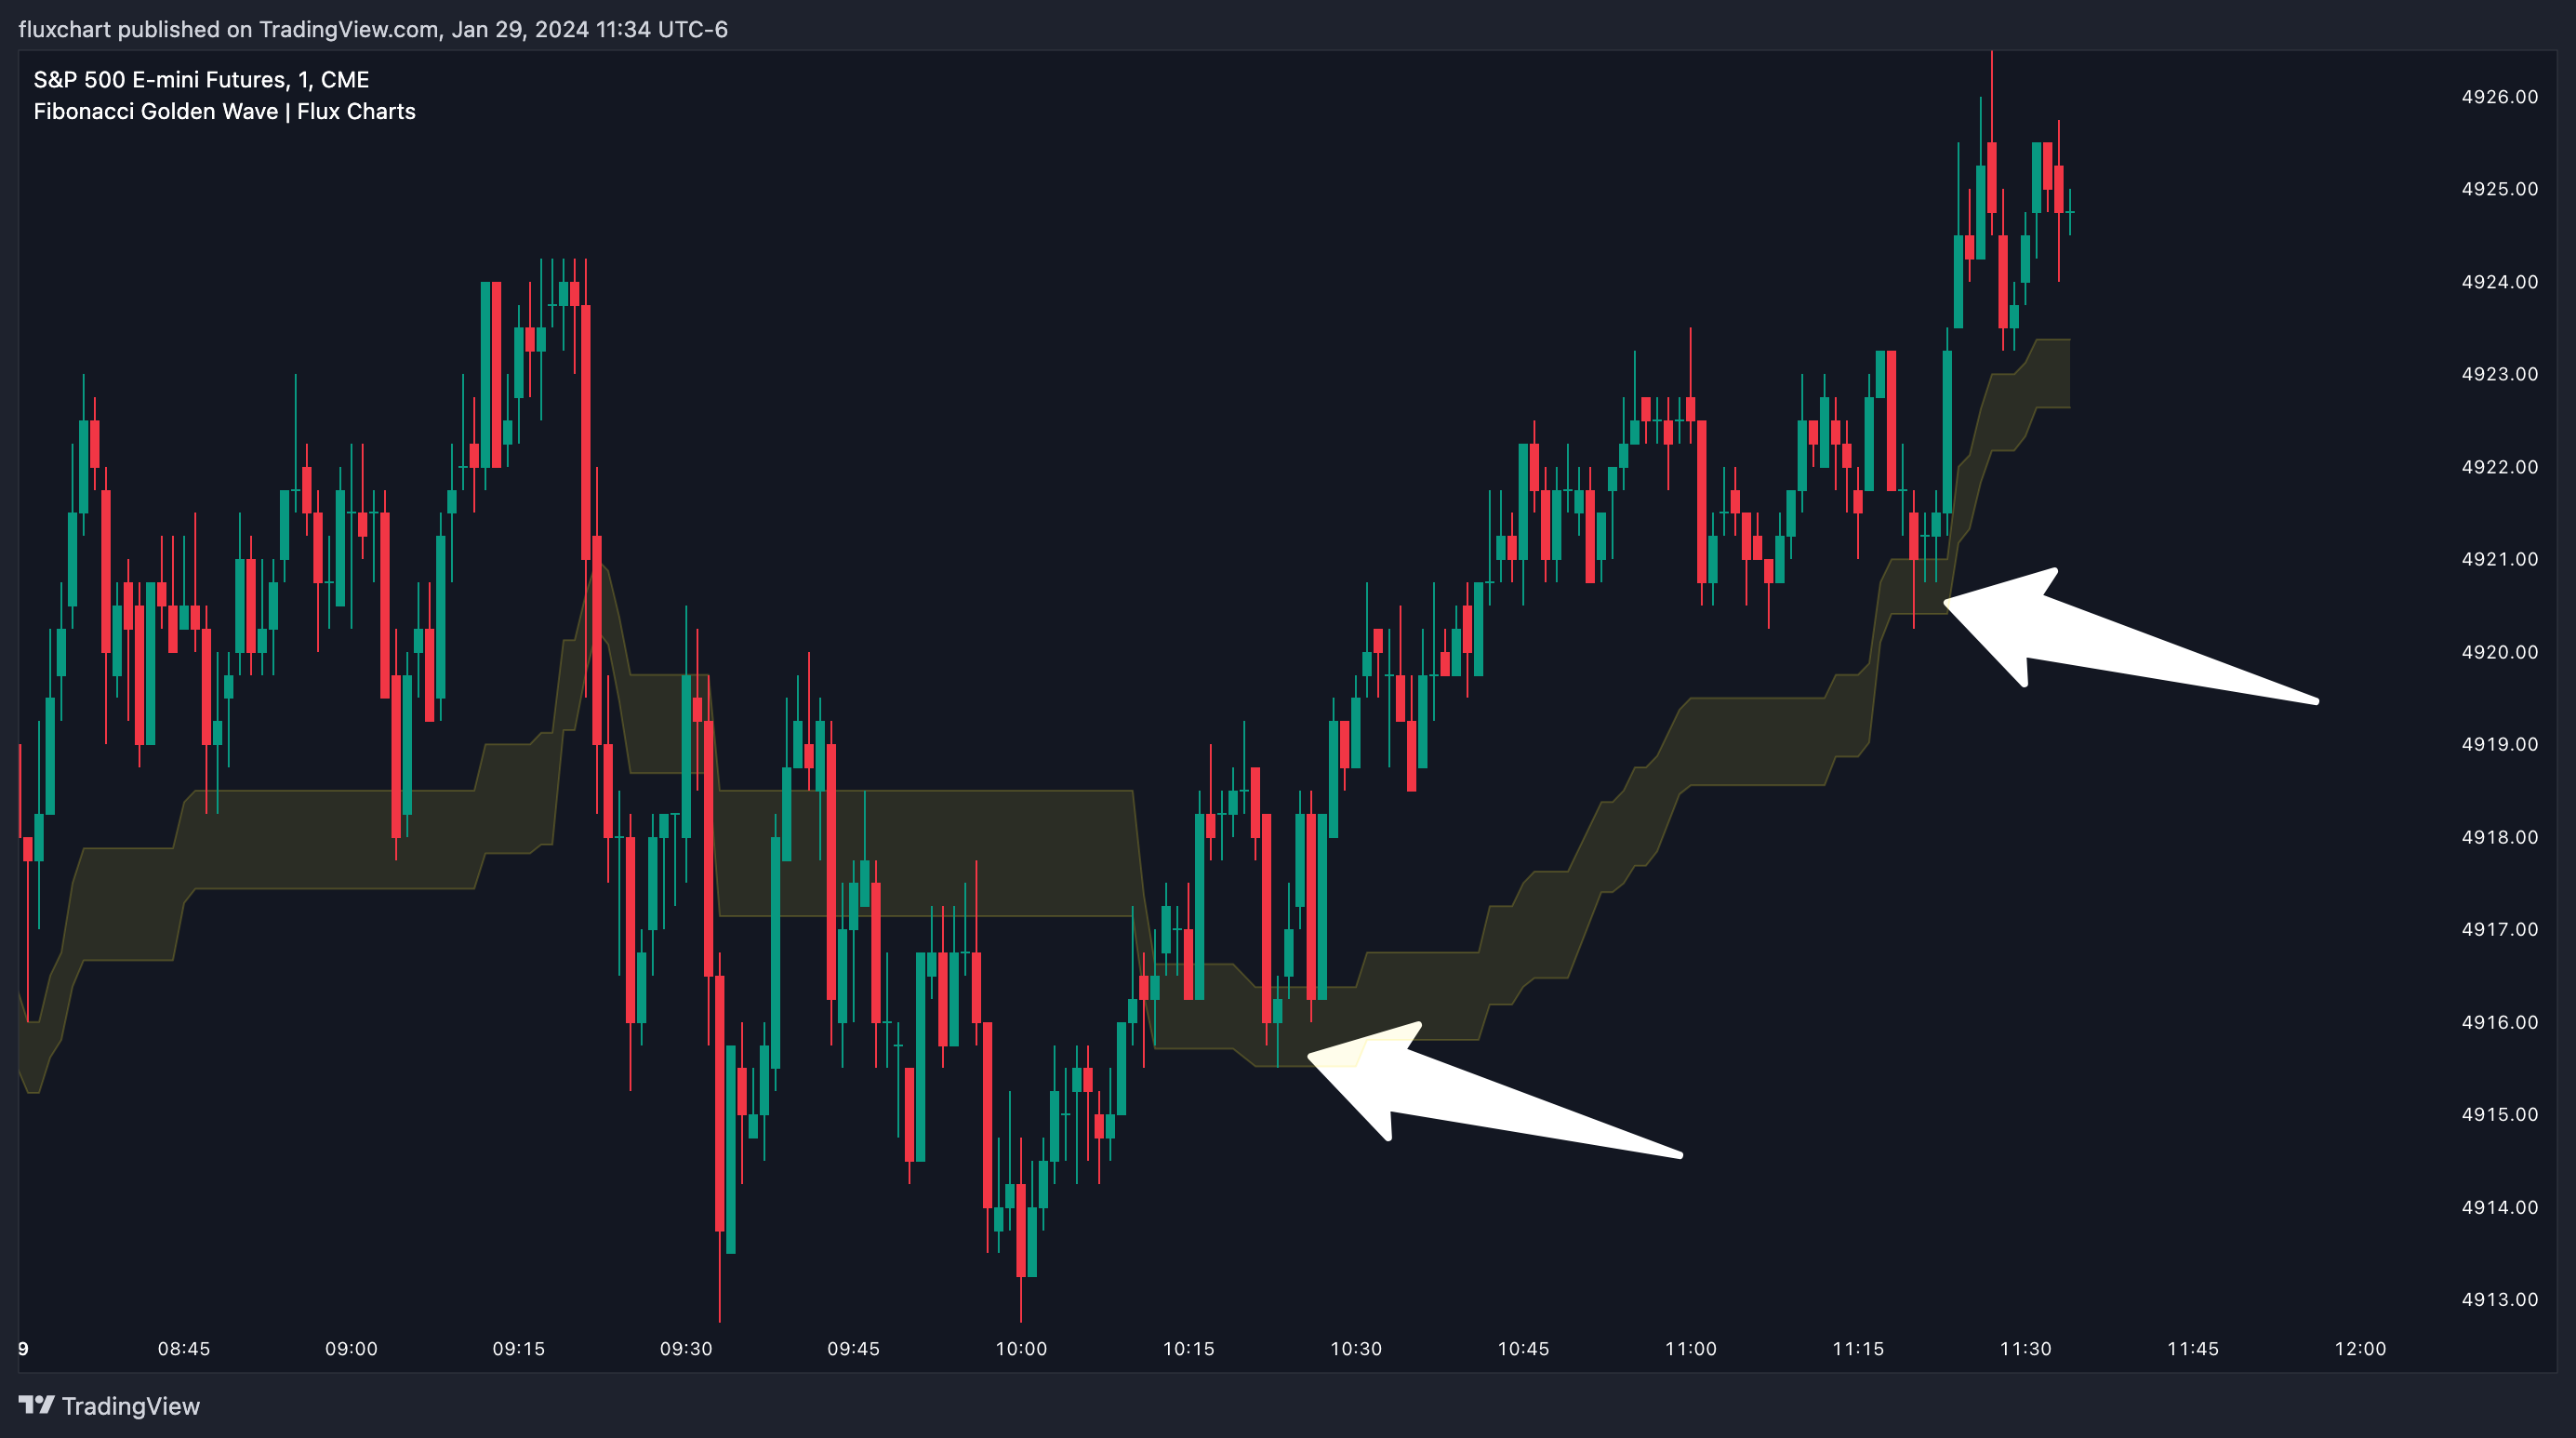
Explanations:
Fibonacci retracement tool is typically used to find entries after a pullback in an uptrend or downtrend. The Fibonacci Golden Wave can be used in the same way. It can be used to find entries after markets retrace. In this example, the Fibonacci Golden Wave is able to catch 2 pullback opportunities to enter long in the market with the trend.
SETTINGS
1. General Configuration
Swing Range -> This setting determines how the highest high / lowest low levels are calculated. This essentially means that the script will look back X bars before the current bar in calculation to find the highest / lowest wick points.
2. Golden Zone
Here you can select which range of the Fibonacci retracement levels should be considered as the golden zone. The default value is 0.5 – 0.618.
Please see the code below:
// This Pine Script™ code is subject to the terms of the Mozilla Public License 2.0 at https://mozilla.org/MPL/2.0/
// © fluxchart
//@version=5
const bool DEBUG = false
const int maxBarsBack = 1250
const int textBack = 2
indicator(“Fibonacci Golden Wave | Flux Charts”, overlay = true, max_boxes_count = 500, max_labels_count = 500, max_lines_count = 500, max_bars_back = 5000)
// Settings
pivotRange = input.int(20, “Swing Range”, group = “General Configuration”)
usePivots = DEBUG ? input.bool(false, “Use Pivots”, group = “General Configuration”) : false
fibArea1 = input.float(0.5, “”, options = [0.236, 0.382, 0.5, 0.618, 0.786], group = “Golden Zone”, inline = “zone”)
fibArea2 = input.float(0.618, ” – “, options = [0.236, 0.382, 0.5, 0.618, 0.786], group = “Golden Zone”, inline = “zone”)
gzLineColor = input.color(color.new(color.yellow, 80), “Golden Zone Lines”, group = “Style”)
showArea = input.bool(true, “Show Area”, group = “Style”, inline = “area”)
gzAreaColor = input.color(color.new(color.yellow, 90), “”, group = “Style”, inline = “area”)
textSize = input.string(“Normal”, “Text Size”, options = [“Auto”, “Small”, “Normal”], group = “Style”, inline = “text”)
textColor = input.color(color.new(color.white, 30), “”, group = “Style”, inline = “text”)
type pivot
bool isHigh
float price
int barTime
var pivot[] highPivots = array.new<pivot>(0)
var pivot[] lowPivots = array.new<pivot>(0)
var box tf1Text = na
float pivotHigh = na
float pivotLow = na
int pHighTime = na
int pLowTime = na
// SWING
if not usePivots
pivotHigh := ta.highest(high, pivotRange)
pHighTime := time[math.abs(ta.highestbars(high, pivotRange))]
pivotLow := ta.lowest(low, pivotRange)
pLowTime := time[math.abs(ta.lowestbars(low, pivotRange))]
else
pivotHigh := ta.pivothigh(pivotRange, pivotRange)
pHighTime := time[pivotRange]
pivotLow := ta.pivotlow(pivotRange, pivotRange)
pLowTime := time[pivotRange]
formatTimeframeString (formatTimeframe) =>
timeframeF = formatTimeframe == “” ? timeframe.period : formatTimeframe
if str.contains(timeframeF, “D”) or str.contains(timeframeF, “W”) or str.contains(timeframeF, “S”) or str.contains(timeframeF, “M”)
timeframeF
else
seconds = timeframe.in_seconds(timeframeF)
if seconds >= 3600
hourCount = int(seconds / 3600)
str.tostring(hourCount) + ” Hour” + (hourCount > 1 ? “s” : “”)
else
timeframeF + ” Min”
getFibonacciLevels (fib1, fib2) =>
if highPivots.size() > 0 and lowPivots.size() > 0
highPivot = highPivots.get(0)
lowPivot = lowPivots.get(0)
top = highPivot.price
bottom = lowPivot.price
difference = top – bottom
fib050 = top – (difference * fib1)
fib061 = top – (difference * fib2)
[fib050, fib061]
else
[na, na]
if last_bar_index – bar_index < maxBarsBack
if not na(pivotHigh)
highPivots.unshift(pivot.new(true, pivotHigh, pHighTime))
if not na(pivotLow)
lowPivots.unshift(pivot.new(false, pivotLow, pLowTime))
fib1 = fibArea1
fib2 = fibArea2
[fib05, fib061] = getFibonacciLevels(fib1, fib2)
line05 = plot(fib05, color = gzLineColor, linewidth = 1, style = plot.style_line)
line061 = plot(fib061, color = gzLineColor, linewidth = 1, style = plot.style_line)
fill(line05, line061, color = showArea ? gzAreaColor : na)
if barstate.islast
box.delete(tf1Text)
//tf1Text := box.new(bar_index – textBack, fib05[textBack / 2], bar_index, fib061[textBack / 2], text = formatTimeframeString(timeframe.period), text_color = textColor, bgcolor = na, border_width = 0, text_size = (textSize == “Auto” ? size.auto : textSize == “Normal” ? size.normal : size.small))
Thank you in advance!
Best Regards