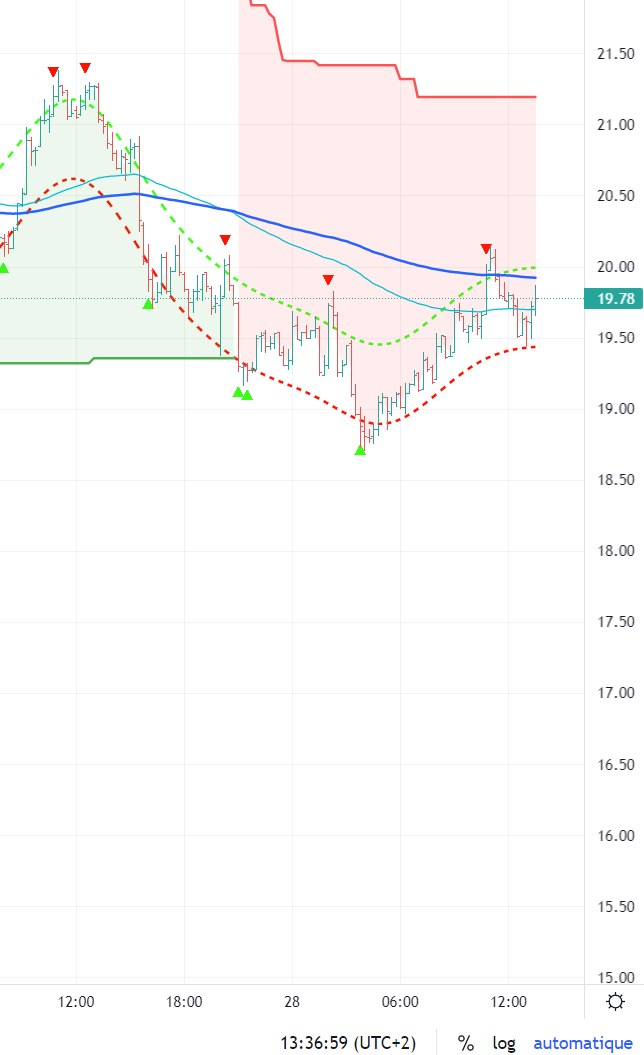
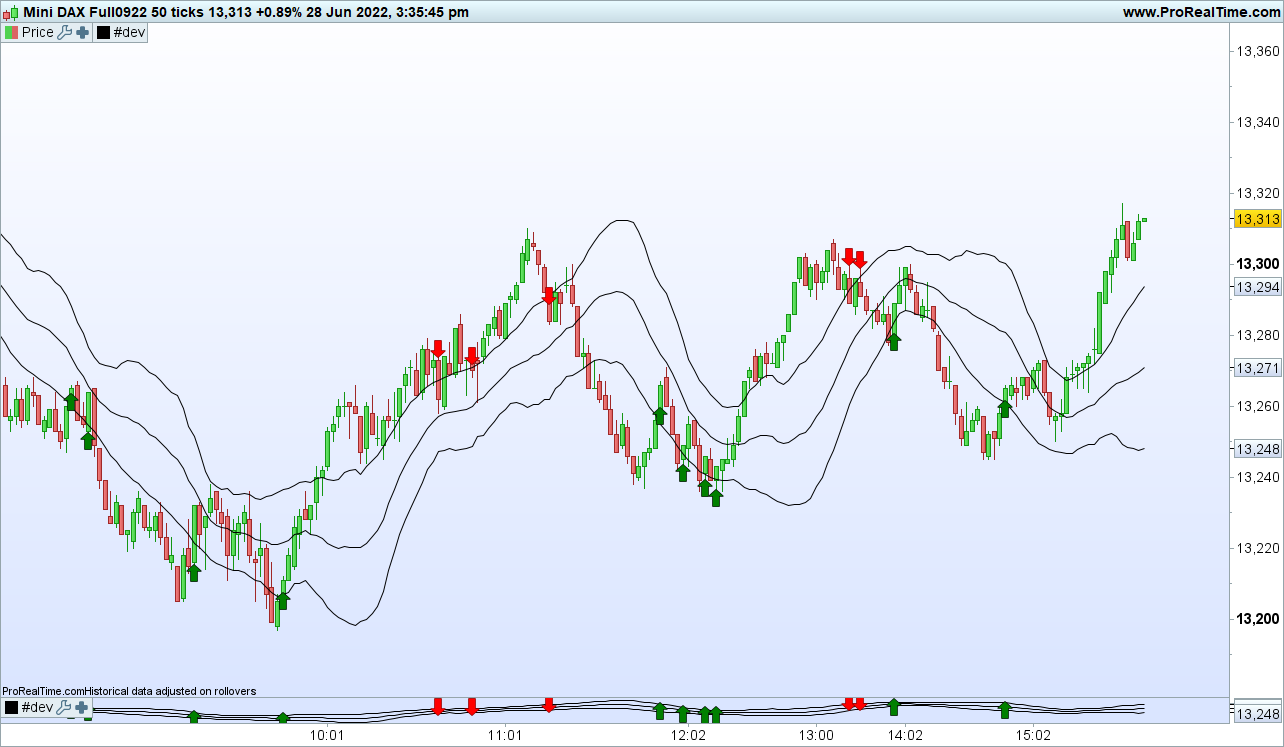
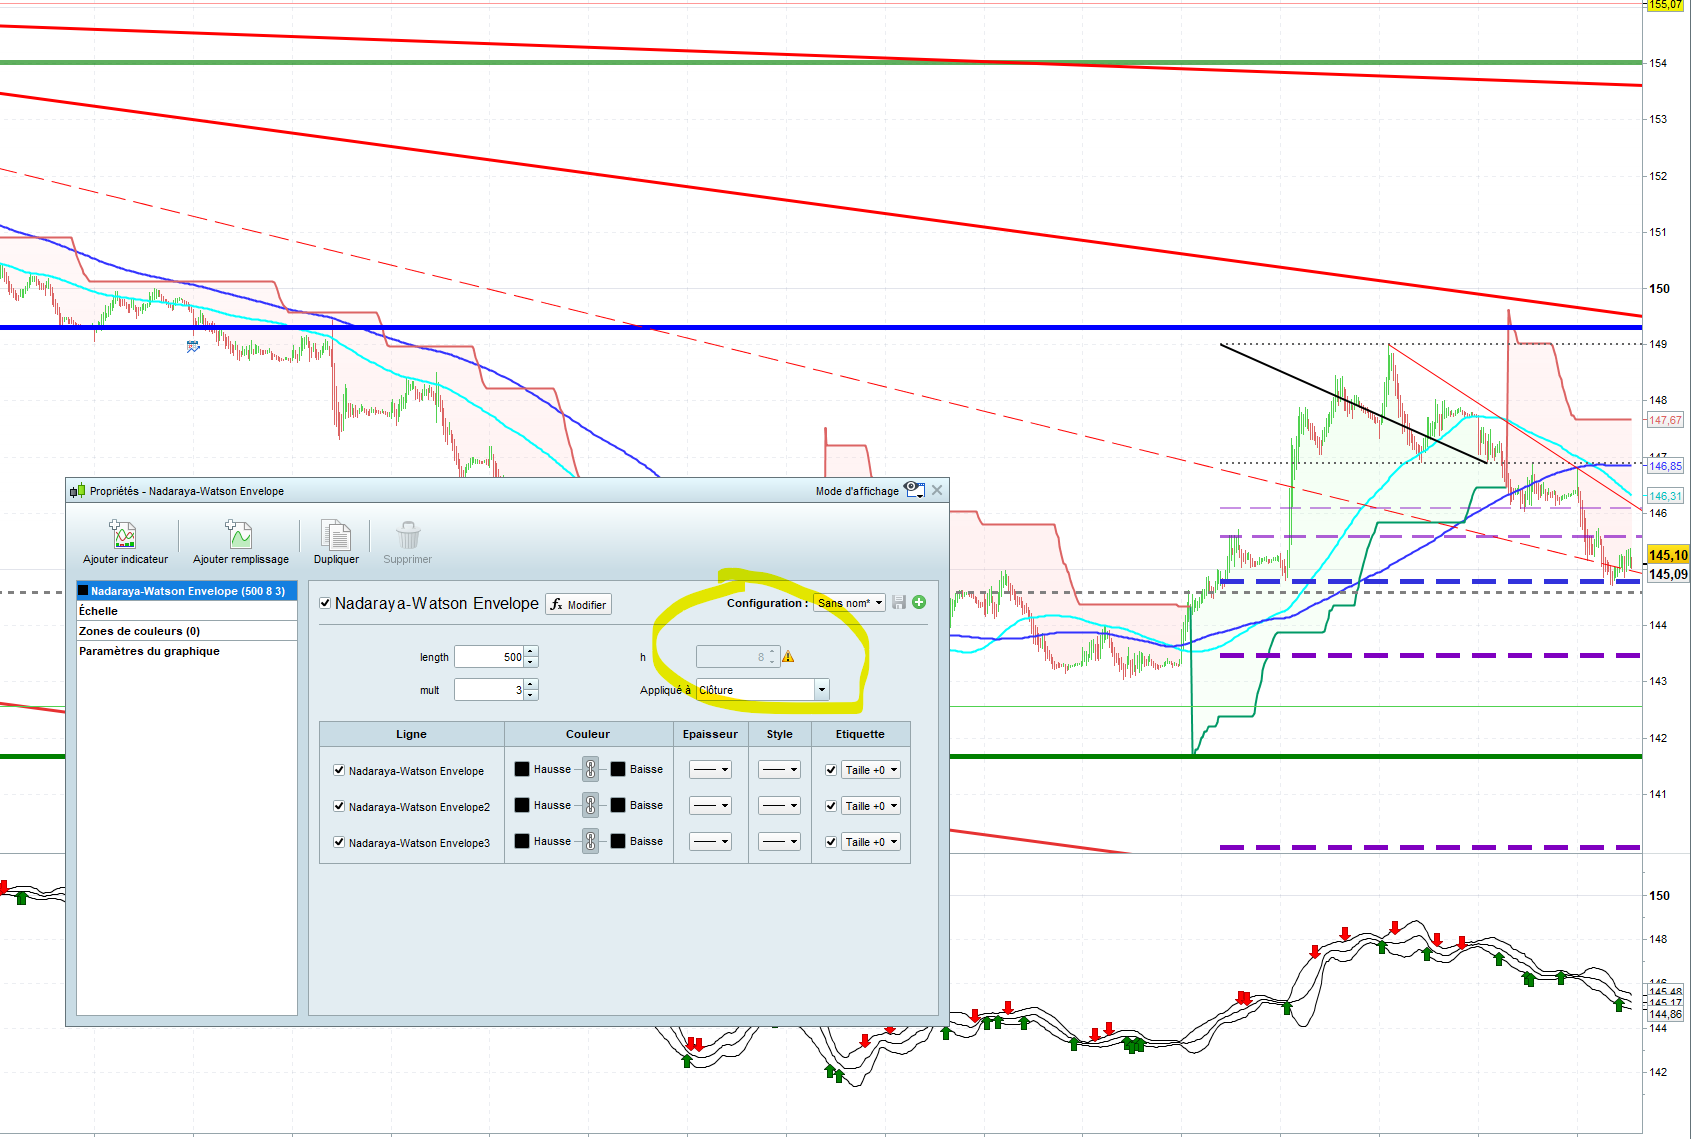
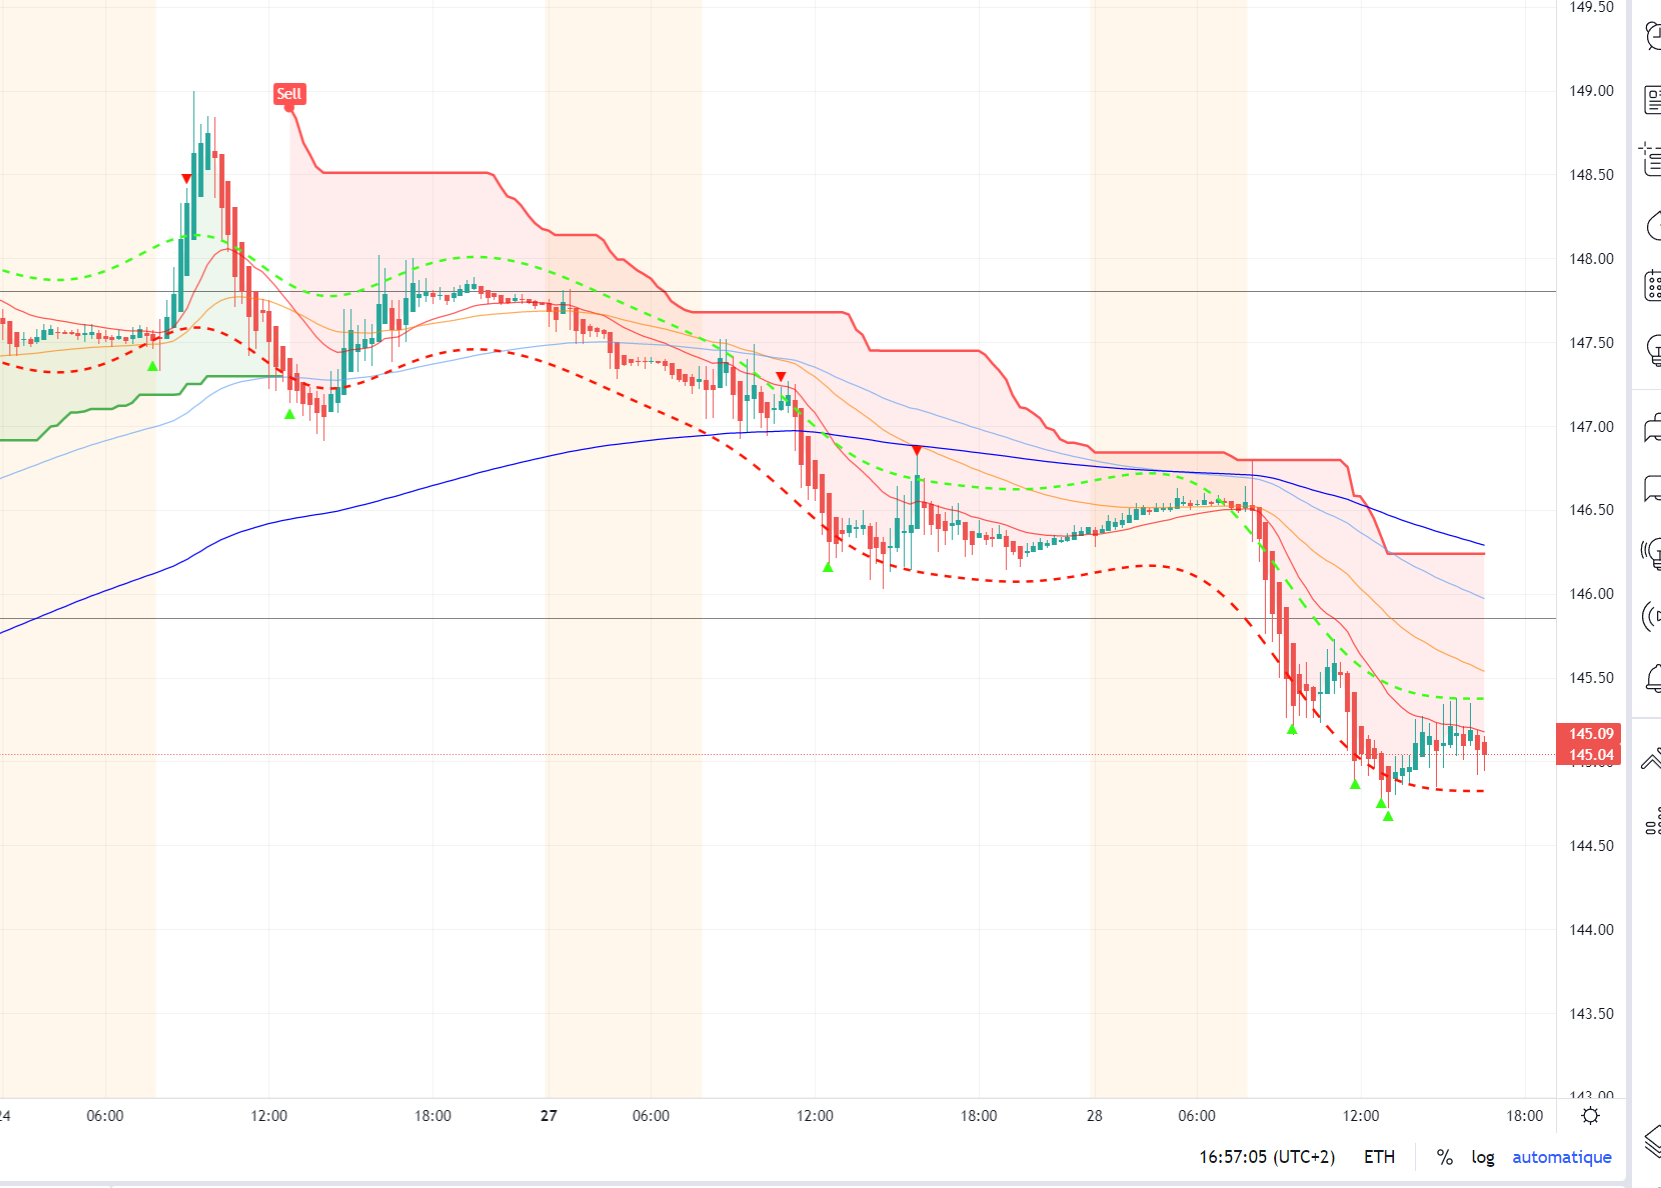
Here is the code attached, 70 lines.
Thanks to all
Please next time, add some explanations and screenshots of what we have to recode for you.
This indicator is repainting, it means that in real time the signals will be very different than the ones you see in the past, it uses futures datas in order to show perfect channels and signals. So it is useless for trading, what’s your opinion?
Thank you Nicolas, no indicator is perfect, but here is the screenshot of the NQ for the last 2 days.
Of course, I simply meant that today's curve will not look the same tomorrow, when the history is completed. Each data that is included in the calculation modifies the calculation of the past and the indicator is continually retraced.
I understand your point, but in daytrading this indicator gives good TP or entry points as you can see on the chart.
Believe me I’d like to help, and sorry to insist, I do want to be sure you have fully undersand what it means since you are still talking about entries/tp of the past history: The entries plotted on the chart were not the same in real time.
At first thanks for helping,
I understand your point, but even if the past triggers are modified afterwards, Real time triggers are still worth it
.
Ok so if you are just looking at real time signals, then the over complicated repainting coding is not mandatory. I will have a look on a simple way to convert it.
Please find attached the translated version (non repainting) of Nadaraya-Watson Envelope
//Nadaraya-Watson Envelope
length = 21 //Window Size
hh = 8 //Bandwidth
mult = 2
src = CustomClose
n = barindex
k = 2
//if IsLastBarUpdate and barindex>length then
//y = 0
sume = 0
for i = 0 to length-1
sum = 0
sumw = 0
for j = 0 to length-1
w = exp(-(pow(i-j,2)/(hh*hh*2)))
sum = sum+src[j]*w
sumw = sumw+w
next
y2 = sum/sumw
sume = sume+abs(src[i] - y2)
//array.push(y,y2)
next
mae = sume/length*mult
/*drawpoint(barindex,y2,1)
drawpoint(barindex,y2+mae,1)
drawpoint(barindex,y2-mae,1)*/
if src crosses under y2+mae then // and src[1]<y2[1]+mae then
drawarrowdown(barindex,high) coloured("red")
endif
if src crosses over y2-mae then //and src[1]>y2[1]-mae then
drawarrowup(barindex,low) coloured("green")
endif
//endif
return y2,y2+mae,y2-mae
The nested loops are huge intensive for calculation, please consider using a limited units display (such as 1k units only).
Thanks a lot, I have this error in the window ?
“hh” Variable which becomes “h”
And one stupid question, How to you show the indicator in the chart and not only in the window below ?
Thanks again
Sorry I found for hh.
If i declare hh variable as decimal, is it possible for me to input 2.1?
Also Lengh is supposed to minimize loop calculation, but it shows on the graph for value superior to 500.
Thanks again
Sorry I found for the TA overlay. So the only question :
- If i declare hh variable as decimal, is it possible for me to input 2.1?
- Also Lengh is supposed to minimize loop calculation, but it shows on the graph for value superior to 500
Thanks again
Yes, hh can be decimal.
The loop is made on each candlestick for “length” candles back in history, in order to calculate for each of them what is the value of the channel.
Here are the diffrence (crosses) between the 2 plateforms with the same variables.
Thanks