Bonjour à tous,
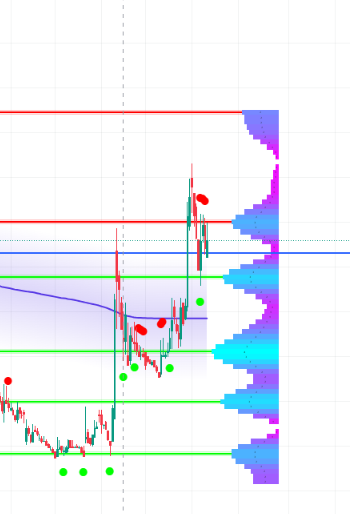
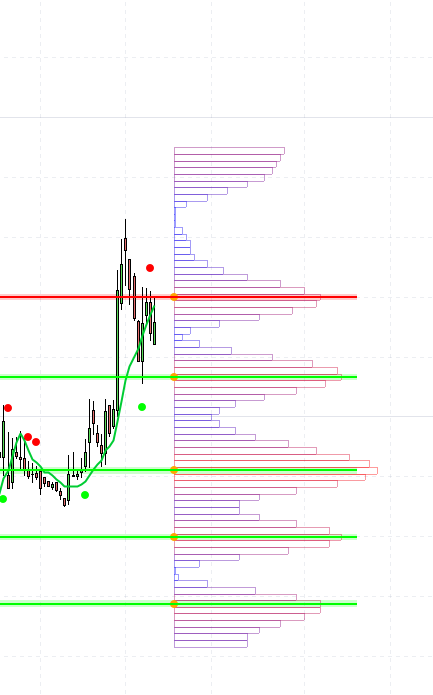
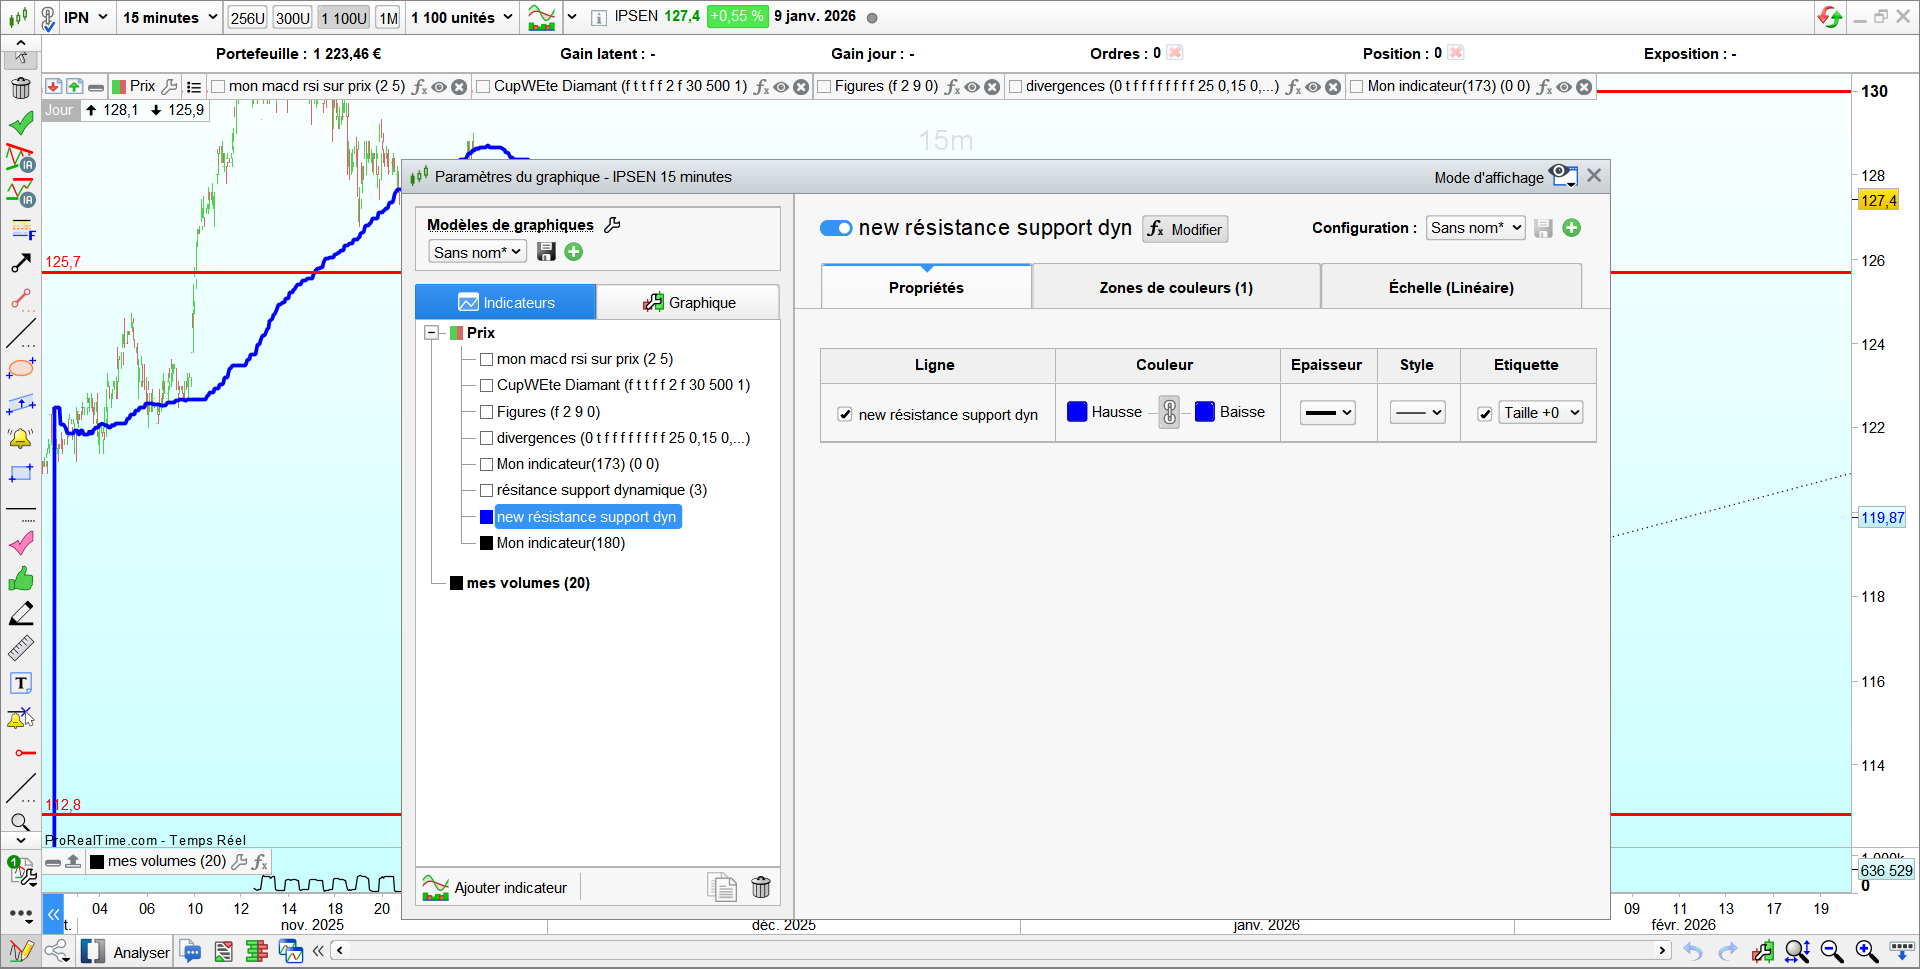
serait-il possible de transposer ce code Traving View en code PRT ?
Merci d’avance
indicator(“Dynamic Support/Resistance Zones [ChartPrime]”, overlay = true, max_labels_count = 500, max_boxes_count = 500, max_lines_count = 500, max_bars_back = 4000)
sq(float source) => math.pow(source, 2)
sinc(float source, float bandwidth) =>
if source == 0
1
else
math.sin(math.pi * source / bandwidth) / (math.pi * source / bandwidth)
sinc_filter(float[] source, float length)=>
if length > 0 and source.size() > 0
src_size = array.size(source)
estimate_array=array.new<float>(src_size)
float current_price = na
fori=0tosrc_size-1
float sum = 0
float sumw = 0
forj=0tosrc_size-1
diff = i – j
weight = sinc(diff, length + 1)
sum += array.get(source, j) * weight
sumw += weight
current_price := sum / sumw
array.set(estimate_array, i, current_price >= 0 ? current_price : 0)
estimate_array
else
source
peak_detection(source, int scale, float real_minimum, bool enable) =>
peak_idx = array.new<float>()
i = -1
if enable and source.size() > 0
max = source.max() – real_minimum
while i < array.size(source) – 1
i += 1
center = int((source.get(i) – real_minimum) / max * (scale – 1) + 1)
previous = i > 0 ? int((source.get(i – 1) – real_minimum) / max * (scale – 1) + 1) : 0
next = i < array.size(source) – 1 ? int((source.get(i + 1) – real_minimum) / max * (scale – 1) + 1) : 0
if center > previous
j = i + 1
if center == next
while j <= array.size(source) – 1
j += 1
vary_previous = int((source.get(j – 1) – real_minimum) / max * (scale – 1) + 1)
very_next = j <= source.size() – 1 ? int((source.get(j) – real_minimum) / max * (scale – 1) + 1) : 0
if very_next != vary_previous
if center > very_next
p_idx = int((i + j) / 2.0)
peak_idx.push((j – i) > 2 and (j – i) % 2 != 0 ? p_idx : p_idx – 0.5)
i:=j
else
i := j – 1
break
if center > next
peak_idx.push(i)
peak_idx
method add_to_score(float[] self, float[] source, float[] weight, string weight_style, float min_range, float bin_size, int precision)=>
if source.size() > 0
for i = 0 to source.size() – 1
w = weight.get(i)
W = weight_style == “Time” ? 1 + (bar_index – weight.min()) – (bar_index – w) : w
idx = math.min(math.floor((source.get(i) – min_range) / bin_size), precision – 1)
self.set(idx, self.get(idx) + W)
ma(float[] scores, float min_range, float bin_size, bool enable)=>
float ma = na
if enable
weight = 0.
sum = 0.
if scores.max() > 0
for i = 0 to scores.size() – 1
score = scores.get(i)
if score == 0
continue
bin_top = min_range + bin_size * (i + 1)
bin_bottom = min_range + bin_size * i
price = math.avg(bin_top, bin_bottom)
weight += score
sum += price * score
ma := sum / weight
ma
method hit(label[] self, float level, int lookback, float atr, color bear_bounce, color bull_bounce)=>
for i = 0 to lookback – 1
h = high[i]
l = low[i]
candle_range = h – l
p_level = level – l
percent = p_level / candle_range
if percent <= 1 and percent >= 0
o = open[i]
c = close[i]
c_next = close[math.max(i – 1, 0)]
polarity = c > o
body_top = math.max(o, c)
body_bottom = math.min(o, c)
top_wick_range = h – body_top
tw_level = level – body_top
tw_percent = tw_level / top_wick_range
bottom_wick_range = body_bottom – l
bw_percent = p_level / bottom_wick_range
top_wick_portion = top_wick_range / candle_range
bottom_wick_portion = bottom_wick_range / candle_range
top_wick_bounce = (tw_percent <= 1 and tw_percent >= 0 and tw_percent >= 0.5) or (top_wick_portion <= 0.25 and level < h and level > body_top) or (candle_range <= atr * 2 and level <= h and level >= body_top)
bottom_wick_bounce = (bw_percent <= 1 and bw_percent >= 0 and bw_percent <= 0.5) or (bottom_wick_portion <= 0.25 and level > l and level < body_bottom) or (candle_range <= atr * 2 and level <= body_bottom and level >= l)
bear_condition = o < level and c_next < level
bull_condition = o > level and c_next > level
candle_bear_bounce = polarity and percent >= 0.7
candle_bull_bounce = not polarity and percent <= 0.3
if (top_wick_bounce or candle_bear_bounce) and bear_condition
self.push(label.new(bar_index – i, h, “⬤”, xloc.bar_index, yloc.price, color.new(color.black, 100), label.style_label_down, bear_bounce))
continue
if (bottom_wick_bounce or candle_bull_bounce) and bull_condition
self.push(label.new(bar_index – i, l, “⬤”, xloc.bar_index, yloc.price, color.new(color.black, 100), label.style_label_up, bull_bounce))
continue
else
continue
weight_style = input.string(“Linear”, “Weighting”, [“Linear”, “Time”, “Volume”], group = “Settings”, tooltip =
” Linear: Each pivot in is treated equally.\n
Time: Newer pivots will have a greater impact.\n
Volume: Each pivot will be scored based on its volume.”)
pivot_lookback = input.int(50, “Number of Pivots”, minval = 1, group = “Settings”, tooltip = “The number of pivots to take into account. Pivot high and low are treated separately so you will have that number of each.”)
filter = input.float(3, “Filtering”, minval = 0, maxval = 12, group = “Settings”, tooltip = “When this is greater than 0 it will smooth the distribution of pivots. This can provide a smoother picture at the price of accuracy.”)
precision = input.int(75, “Manual Precision”, minval = 3, inline = “Precision”, group = “Settings”, tooltip = “Use this to manually set the number of divisions of the range.”)
auto_precision = not input.bool(true, “”, inline = “Precision”, group = “Settings”, tooltip = “Use the average range of a candle to divide the range with a minimum of 10.”)
real_time_only = input.bool(false, “Calculate on Real Time Only”, group = “Settings”)
length_1 = input.int(5, “Length 1”, minval = 1, inline = “Length_1”, group = “Pivots”)
include_5 = input.bool(true, “”, inline = “Length_1”, group = “Pivots”)
length_2 = input.int(10, “Length 2”, minval = 2, inline = “Length_2”, group = “Pivots”)
include_10 = input.bool(true, “”, inline = “Length_2”, group = “Pivots”)
length_3 = input.int(20, “Length 3”, minval = 3, inline = “Length_3”, group = “Pivots”)
include_20 = input.bool(true, “”, inline = “Length_3”, group = “Pivots”)
length_4 = input.int(50, “Length 4”, minval = 4, inline = “Length_4”, group = “Pivots”)
include_50 = input.bool(true, “”, inline = “Length_4”, group = “Pivots”)
include_ph = input.bool(true, “Include Pivot High”, group = “Pivots”)
include_pl = input.bool(true, “Include Pivot Low”, group = “Pivots”)
show_lines = input.bool(true, “Show Support/Resistance”, group = “Support/Resistance”)
show_hits = input.bool(true, “Show Bounces”, inline = “Bounce”, group = “Support/Resistance”)
hit_lookback = input.int(100, “”, minval = 1, inline = “Bounce”, group = “Support/Resistance”)
show_zone = input.bool(false, “Show S/R Zone”, inline = “Zone”, group = “Support/Resistance”)
zone_alpha = input.int(88, “”, minval = 0, maxval = 100, inline = “Zone”, group = “Support/Resistance”)
support_color = input.color(#00FF00, “Support Color”, group = “Support/Resistance”)
resistance_color = input.color(#FF0000, “Resistance Color”, group = “Support/Resistance”)
show_dist = input.bool(true, “Show Distribution”, group = “Distribution”)
show_score = input.bool(true, “Show Score in Distribution”, group = “Distribution”)
scale = input.int(30, “Distribution Scale”, minval = 5, group = “Distribution”, tooltip = “This scales the distribution’s size on the screen. It also impacts the precision of the calculations.”)
heat_map = input.bool(true, “Show Distribution Overlay”, inline = “MAP”, group = “Distribution”)
heat_alpha = input.int(85, “”, minval = 0, maxval = 100, inline = “MAP”, group = “Distribution”)
high_color=input.color(#00FFFF,”High Color”,group=”Distribution”)
low_color = input.color(#FF00FF, “Low Color”, group = “Distribution”)
txt_color = input.color(#111111, “Text Color”, group = “Distribution”)
enable_ma = input.bool(false, “Pivot Level Average”, inline = “MA”, group = “Moving Average”, tooltip = “Show an average price weighted by the pivot points.”)
ma_smoothing = input.int(12, “”, minval = 0, maxval = 200, inline = “MA”, group = “Moving Average”) + 1
ma_color = input.color(#5536e4, “MA Color”, group = “Moving Average”)
var pivot_high = array.new<float>()
var pivot_high_weight = array.new<float>()
var pivot_low = array.new<float>()
var pivot_low_weight = array.new<float>()
ph_5 = ta.pivothigh(high, length_1, length_1)
ph_10 = ta.pivothigh(high, length_2, length_2)
ph_20 = ta.pivothigh(high, length_3, length_3)
ph_50 = ta.pivothigh(high, length_4, length_4)
pl_5 = ta.pivotlow(low, length_1, length_1)
pl_10 = ta.pivotlow(low, length_2, length_2)
pl_20 = ta.pivotlow(low, length_3, length_3)
pl_50 = ta.pivotlow(low, length_4, length_4)
if not na(ph_5) and include_5
w = switch weight_style
“Linear” => 1
“Time” => bar_index – length_1
“Volume” => volume[length_1]
pivot_high.push(ph_5)
pivot_high_weight.push(w)
if not na(ph_10) and include_10
w = switch weight_style
“Linear” => 1
“Time” => bar_index – length_2
“Volume” => volume[length_2]
pivot_high.push(ph_10)
pivot_high_weight.push(w)
if not na(ph_20) and include_20
w = switch weight_style
“Linear” => 1
“Time” => bar_index – length_3
“Volume” => volume[length_3]
pivot_high.push(ph_20)
pivot_high_weight.push(w)
if not na(ph_50) and include_50
w = switch weight_style
“Linear” => 1
“Time” => bar_index – length_4
“Volume” => volume[length_4]
pivot_high.push(ph_50)
pivot_high_weight.push(w)
if not na(pl_5) and include_5
w = switch weight_style
“Linear” => 1
“Time” => bar_index – length_1
“Volume” => volume[length_1]
pivot_low.push(pl_5)
pivot_low_weight.push(w)
if not na(pl_10) and include_10
w = switch weight_style
“Linear” => 1
“Time” => bar_index – length_2
“Volume” => volume[length_2]
pivot_low.push(pl_10)
pivot_low_weight.push(w)
if not na(pl_20) and include_20
w = switch weight_style
“Linear” => 1
“Time” => bar_index – length_3
“Volume” => volume[length_3]
pivot_low.push(pl_20)
pivot_low_weight.push(w)
if not na(pl_50) and include_50
w = switch weight_style
“Linear” => 1
“Time” => bar_index – length_4
“Volume” => volume[length_4]
pivot_low.push(pl_50)
pivot_low_weight.push(w)
ifpivot_high.size()>pivot_lookback
pivot_high.shift()
pivot_high_weight.shift()
ifpivot_low.size()>pivot_lookback
pivot_low.shift()
pivot_low_weight.shift()
sudo_max = ta.max(high)
max_range = math.max(include_ph ? pivot_high.max() : 0, include_pl ? pivot_low.max() : 0)
min_range = math.min(include_ph ? pivot_high.min() : sudo_max, include_pl ? pivot_low.min() : sudo_max)
cum = ta.cum(high – low)
atr = cum > 0 ? cum / (bar_index + 1) : 10
auto = auto_precision ? math.min(100, math.max(10, math.ceil((max_range – min_range) / atr))) : precision
bin_size = (max_range – min_range) / auto
scores = array.new<float>(auto, 0)
if include_ph
scores.add_to_score(pivot_high, pivot_high_weight, weight_style, min_range, bin_size, auto)
if include_pl
scores.add_to_score(pivot_low, pivot_low_weight, weight_style, min_range, bin_size, auto)
var dist = array.new<box>()
var peak = array.new<line>()
var peak_box = array.new<box>()
var heat = array.new<box>()
var bounce = array.new<label>()
if dist.size() > 0 and barstate.isconfirmed
for i = dist.size() – 1 to 0
dist.get(i).delete()
dist.remove(i)
if peak.size() > 0 and barstate.isconfirmed
for i = peak.size() – 1 to 0
peak.get(i).delete()
peak.remove(i)
if peak_box.size() > 0 and barstate.isconfirmed
for i = peak_box.size() – 1 to 0
peak_box.get(i).delete()
peak_box.remove(i)
if heat.size() > 0 and barstate.isconfirmed
for i = heat.size() – 1 to 0
heat.get(i).delete()
heat.remove(i)
if bounce.size() > 0 and barstate.isconfirmed
for i = bounce.size() – 1 to 0
bounce.get(i).delete()
bounce.remove(i)
float ma = na
speed_hack = real_time_only ? barstate.isrealtime : true
if speed_hack
filtered_scores = sinc_filter(scores, filter)
iffiltered_scores.max()>0
float real_minimum = 0
for i = 0 to filtered_scores.size() – 1
s = filtered_scores.min(i)
if s != 0
real_minimum := s
break
peak_idx = peak_detection(filtered_scores, scale, real_minimum, true)
if barstate.isconfirmed
if peak_idx.size() > 0 and show_lines
for i = 0 to peak_idx.size() – 1
p_idx = peak_idx.get(i)
bin_top = min_range + bin_size * (p_idx + 1)
bin_bottom = min_range + bin_size * p_idx
score = (bin_top + bin_bottom) / 2
score_color = close > score ? support_color : resistance_color
if show_hits
bounce.hit(score, hit_lookback, atr, resistance_color, support_color)
peak.push(line.new(bar_index + 3, score, bar_index + scale + 3, score, color = score_color, width = 2, extend = extend.left))
if show_zone
zone_color = color.new(score_color, zone_alpha)
peak_box.push(box.new(bar_index – 1, bin_top, bar_index + scale + 3, bin_bottom, zone_color, bgcolor = zone_color, extend = extend.left))
if show_dist or heat_map
for i = 0 to filtered_scores.size() – 1
max_score = filtered_scores.max() – real_minimum
raw_score = filtered_scores.get(i)
score = int((raw_score – real_minimum) / max_score * (scale – 1) + 1)
score_color = color.from_gradient(score, 0, scale, low_color, high_color)
bin_top = min_range + bin_size * (i + 1)
bin_bottom = min_range + bin_size * i
txt = show_score ? (weight_style == “Volume” ? str.tostring(raw_score, format.volume) : str.tostring(math.ceil(raw_score))) : na
if raw_score > 0
if show_dist
dist.push(
box.new(bar_index + scale – score + 3, bin_top, bar_index + scale + 3, bin_bottom, bgcolor = score_color, border_color = score_color, text = txt, text_color = txt_color)
)
if heat_map
heat.push(
box.new(bar_index + scale – score + 3, bin_top, bar_index + scale + 3, bin_bottom, bgcolor = color.new(score_color, heat_alpha), border_color = color.new(score_color, heat_alpha), extend = extend.left)
)
ma := ta.sma(ma(filtered_scores, min_range, bin_size, enable_ma), ma_smoothing)
ma_plot = plot(ma, “MA”, ma_color, 2)
ma_plot_top = plot(ma + atr / 2, “”, color.new(ma_color, 100), display = display.data_window, editable = false)
ma_plot_bottom = plot(ma – atr / 2, “”, color.new(ma_color, 100), display = display.data_window, editable = false)
fill(ma_plot, ma_plot_top, ma + atr / 2, ma, color.new(ma_color, 100), color.new(ma_color, 80), “Glow Top”)
fill(ma_plot, ma_plot_bottom, ma, ma – atr / 2, color.new(ma_color, 80), color.new(ma_color, 100), “Glow Bottom”)