Bonjour,
La conversion de cet indicateur trouvé sur tradingview est-elle possible? merci par avance
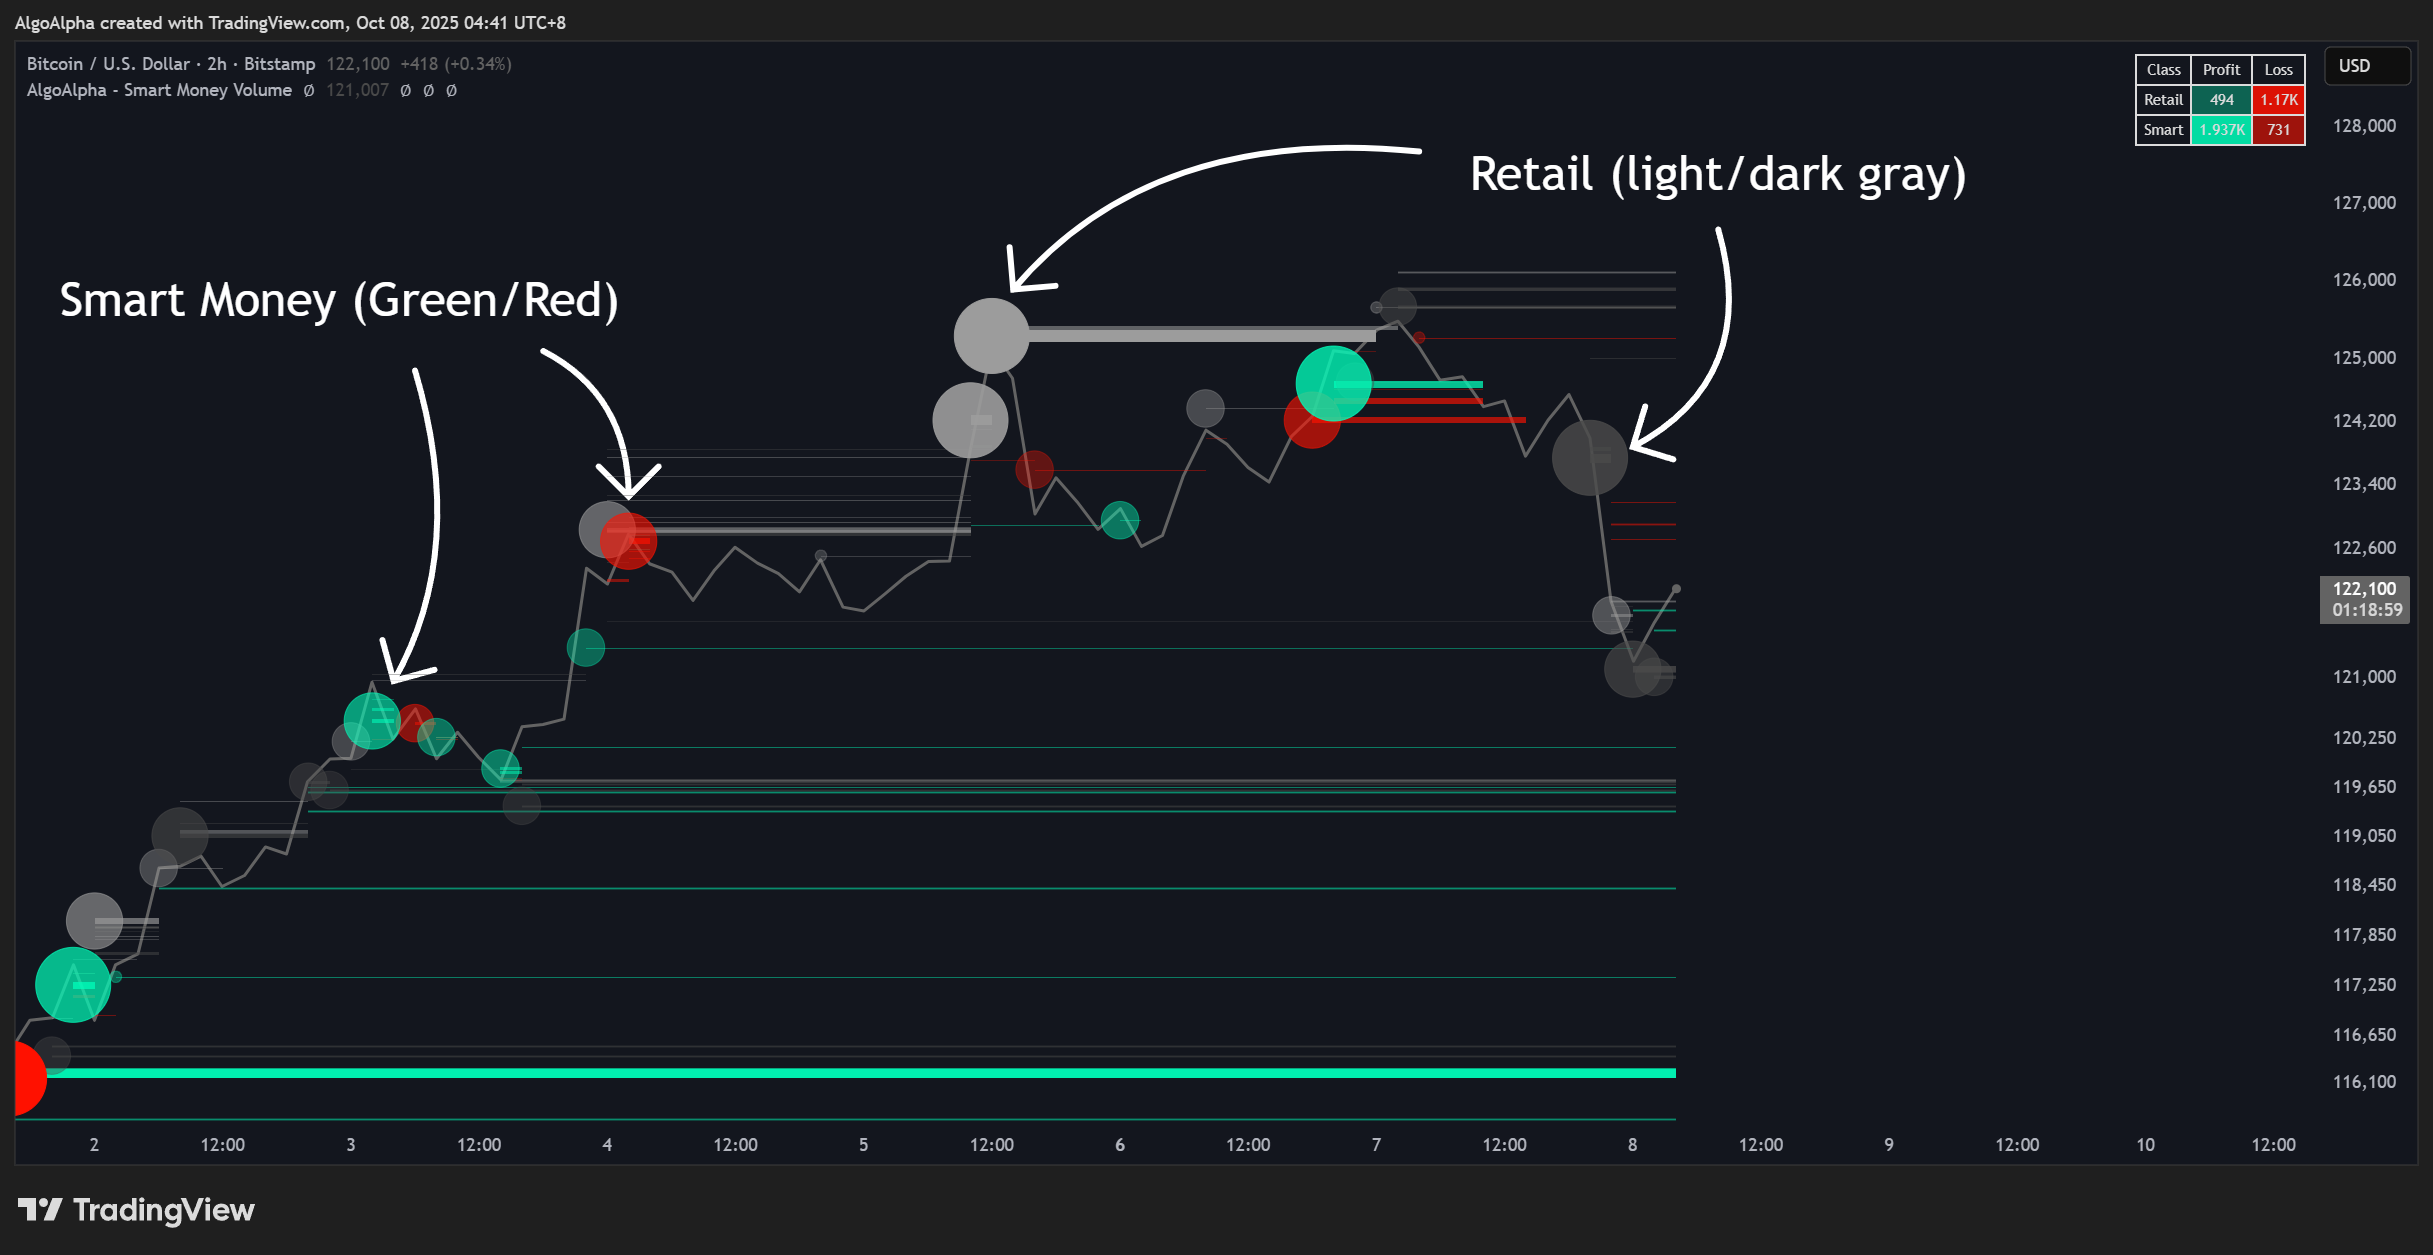
lien: https://fr.tradingview.com/script/POrDlSAK-Smart-Money-Volume-Activity-AlgoAlpha
Description:
Cet outil visualise le comportement des acteurs du marché de la smart money et des retails grâce à une analyse des volumes sur une période plus courte. Il détecte les pics de volume bien supérieurs à l’activité normale, les classe comme institutionnels ou particuliers et projette ces zones comme niveaux réactifs. Le script se met à jour dynamiquement à chaque barre, indiquant l’entrée des acteurs importants et vérifiant si ces événements restent rentables. Chaque événement est représenté par une ligne horizontale avec des marqueurs de bulles et synthétisé dans un tableau de résultats en temps réel comparant les acteurs du marché des capitaux intelligents et du commerce de détail.
Script:
// © AlgoAlpha
//@version=6
indicator(“Smart Money Volume Activity [AlgoAlpha]”, “AlgoAlpha – Smart Money Volume”, overlay = true, max_lines_count = 150, behind_chart = false)
zLen = input.int(50, “Period (Chart Bars)”, minval = 5, tooltip = “Number of chart bars to analyze when aggregating lower-timeframe volumes and computing Z-scores. Larger values smooth results but reduce sensitivity.”, group = “Calculations”)
thAbs = input.float(2, “Threshold (|Z|)”, step = 0.1, tooltip = “Minimum absolute Z-score required for a lower-timeframe volume event to be considered significant. Higher values show fewer but stronger events.”, group = “Calculations”)
ltf_ = input.timeframe(“5”, “Lower Timeframe Value”, tooltip = “Determines the lower timeframe used to calculate buying and selling volume”, group=”Calculations”)
who = input.string(“Both”, “Show”, options = [“Smart Money”, “Retail”, “Both”], tooltip = “Filter which class to include in levels, bubbles, and P/L table.”, group = “Calculations”)
levels = input.bool(true, “Show Levels”, tooltip = “Draw horizontal levels at significant lower-timeframe volume events.”, group = “Calculations”)
bubbles = input.bool(true, “Show Bubbles”, tooltip = “Display a bubble marker at the strongest event on each bar. Opacity scales with the event |Z|-score.”, group = “Calculations”)
showPLTable = input.bool(true, “Show P/L Table”, tooltip = “Show a table comparing profit/loss volumes for Retail vs Smart Money.”, group = “Appearance”)
table_size = input.string(“Small”, “Table Size”, options=[“Tiny”,”Small”,”Medium”,”Large”], tooltip = “Controls text size for the P/L table.”, group=”Appearance”)
plTablePosition = input.string(“top right”, “Table Position”, options=[“bottom center”,”bottom left”,”bottom right”,”middle center”,”middle left”,”middle right”,”top center”,”top left”,”top right”], tooltip = “Position of the P/L table on the chart.”, group = “Appearance”)
bullColor = input.color(#00ffbb, “Smart Money Color”, tooltip = “Color for Smart Money bullish events and profit cells.”, group=”Appearance”, inline = “smColors”)
bearColor = input.color(#ff1100, “”, tooltip = “Color for Smart Money bearish events and loss cells.”, group = “Appearance”, inline = “smColors”)
retailbullcol = input.color(#9c9c9c, “Retail Color”, tooltip = “Color for Retail bullish events.”, group=”Appearance”, inline = “retColors”)
retailbearcol = input.color(#4a4a4a, “”, tooltip = “Color for Retail bearish events.”, group = “Appearance”, inline = “retColors”)
tableSize(sz) =>
switch sz
“Tiny” => size.tiny
“Small” => size.small
“Medium” => size.normal
“Large” => size.large
posFromString(str) =>
switch str
“bottom center” => position.bottom_center
“bottom left” => position.bottom_left
“bottom right” => position.bottom_right
“middle center” => position.middle_center
“middle left” => position.middle_left
“middle right” => position.middle_right
“top center” => position.top_center
“top left” => position.top_left
“top right” => position.top_right
var table plTable = na
var int plLastCols = na
var int plLastRows = na
var string plLastPos = “”
var string plLastSize = “”
alphaForVal(v, vmax) =>
vmax <= 0 ? 85 : math.round(85 – math.min(1.0, v / vmax) * 70)
lt_v = request.security_lower_tf(syminfo.tickerid, ltf_, volume)
lt_c = request.security_lower_tf(syminfo.tickerid, ltf_, close)
lt_o = request.security_lower_tf(syminfo.tickerid, ltf_, open)
var vols = array.new_float()
res_size = lt_v.size()
maximum = zLen * res_size
indexes = array.new_int()
var line[] levelLines = array.new()
var float[] levelPrices = array.new()
var int[] levelTypes = array.new()
var int[] levelCreatedBars = array.new()
var int[] levelClasses = array.new()
var line[] levelGlow1Lines = array.new()
var float[] levelVols = array.new()
var float[] levelZs = array.new()
maxStored = 150
zStoredCap = 100
var float[] levelActiveVols = array.new()
float barMaxAbsZ = na
int barBubbleDir = na
float barBubblePrice = na
int barBubbleClass = na
// Per-bar event flags (independent of ‘who’ and visualization toggles)
var bool retailBullBar = false
var bool retailBearBar = false
var bool smartBullBar = false
var bool smartBearBar = false
if barstate.isnew
barMaxAbsZ := na
barBubbleDir := na
barBubblePrice := na
barBubbleClass := na
retailBullBar := false
retailBearBar := false
smartBullBar := false
smartBearBar := false
if res_size > 0
for i = res_size – 1 to 0
vols.unshift(lt_v.get(i))
while vols.size() > maximum
vols.pop()
if vols.size() > 0
for i = 0 to res_size-1
zscore = (vols.get(i) – vols.avg()) / vols.stdev()
if zscore > thAbs
indexes.unshift(i)
if indexes.size() > 0
for i = 0 to indexes.size() – 1
intra_close = lt_c.get(indexes.get(i))
intra_open = lt_o.get(indexes.get(i))
isBull = intra_close > intra_open
int typ = isBull ? 1 : -1
bodyMin = math.min(open, close)
bodyMax = math.max(open, close)
lvlPrice = intra_close
isAtClose = lvlPrice == close
isStrictInBody = lvlPrice > bodyMin and lvlPrice < bodyMax int cls = isAtClose ? 1 : (isStrictInBody ? 2 : 1) bool classAllowed = (who == “Both”) or (who == “Retail” and cls == 1) or (who == “Smart Money” and cls == 2) bool shouldCreate = levels and classAllowed evtVol = lt_v.get(indexes.get(i)) volsAvg = vols.avg() volsStdev = vols.stdev() zVal = volsStdev > 0 ? (evtVol – volsAvg) / volsStdev : 0.0
int widthZ = math.max(1, math.min(10, math.round(math.abs(zVal))))
// Mark event presence for alerts (ignore ‘who’ filter and display toggles)
if cls == 1
if isBull
retailBullBar := true
else
retailBearBar := true
else if cls == 2
if isBull
smartBullBar := true
else
smartBearBar := true
bool bubbleClassAllowed = (who == “Both”) or (who == “Retail” and cls == 1) or (who == “Smart Money” and cls == 2)
if bubbleClassAllowed and (na(barMaxAbsZ) or math.abs(zVal) > barMaxAbsZ)
barMaxAbsZ := math.abs(zVal)
barBubbleDir := isBull ? 1 : -1
barBubblePrice := lvlPrice
barBubbleClass := cls
if shouldCreate
lineColor = cls == 1 ? (isBull ? retailbullcol : retailbearcol) : (isBull ? bullColor : bearColor)
transpBase = math.round((10 – widthZ) * 80 / 9)
coreWidth = math.max(1, widthZ – 2)
midWidth = math.max(1, widthZ – 1)
colGlow1 = color.new(lineColor, math.min(80, transpBase + 20))
glow1 = line.new(bar_index, lvlPrice, bar_index, lvlPrice, xloc.bar_index, extend.none,
color = colGlow1, width = midWidth)
coreLine = line.new(bar_index, lvlPrice, bar_index, lvlPrice, xloc.bar_index, extend.none,
color = color.new(lineColor, transpBase), width = coreWidth)
array.unshift(levelGlow1Lines, glow1)
array.unshift(levelLines, coreLine)
array.unshift(levelPrices, lvlPrice)
array.unshift(levelTypes, typ)
array.unshift(levelCreatedBars, bar_index)
array.unshift(levelClasses, cls)
array.unshift(levelVols, evtVol)
array.unshift(levelZs, zVal)
while array.size(levelVols) > zStoredCap
array.pop(levelVols)
while array.size(levelZs) > zStoredCap
array.pop(levelZs)
array.unshift(levelActiveVols, evtVol)
if array.size(levelLines) > 0
for i = array.size(levelLines) – 1 to 0
if i < array.size(levelLines)
l = array.get(levelLines, i)
lvl = array.get(levelPrices, i)
created = array.get(levelCreatedBars, i)
l.set_x2(bar_index)
if i < array.size(levelGlow1Lines) array.get(levelGlow1Lines, i).set_x2(bar_index) ocMin = math.min(open, close) ocMax = math.max(open, close) crossesBody = bar_index > created and barstate.isconfirmed and (ocMin <= lvl and ocMax >= lvl)
if crossesBody
array.remove(levelLines, i)
array.remove(levelPrices, i)
array.remove(levelTypes, i)
array.remove(levelCreatedBars, i)
array.remove(levelClasses, i)
if i < array.size(levelGlow1Lines)
line.delete(array.remove(levelGlow1Lines, i))
if i < array.size(levelActiveVols) array.remove(levelActiveVols, i) while array.size(levelLines) > maxStored
array.pop(levelLines).delete()
if array.size(levelGlow1Lines) > maxStored
array.pop(levelGlow1Lines).delete()
array.pop(levelPrices)
array.pop(levelTypes)
array.pop(levelCreatedBars)
array.pop(levelClasses)
if array.size(levelActiveVols) > maxStored
array.pop(levelActiveVols)
retailProfitVol = 0.0
retailLossVol = 0.0
smartProfitVol = 0.0
smartLossVol = 0.0
sz = array.size(levelLines)
if sz > 0
for i = 0 to sz – 1
if i < array.size(levelActiveVols) and i < array.size(levelPrices) and i < array.size(levelTypes) and i < array.size(levelClasses) lvl = array.get(levelPrices, i) typ = array.get(levelTypes, i) cls = array.get(levelClasses, i) volA = array.get(levelActiveVols, i) inProfit = (typ == 1 and close >= lvl) or (typ == -1 and close <= lvl)
if cls == 1
if inProfit
retailProfitVol += volA
else
retailLossVol += volA
else if cls == 2
if inProfit
smartProfitVol += volA
else
smartLossVol += volA
if barstate.islast and showPLTable
cols = 3
rows = 3
needRecreate = na(plTable) or na(plLastCols) or na(plLastRows) or plLastCols != cols or plLastRows != rows or plLastPos != plTablePosition or plLastSize != table_size
if needRecreate
if not na(plTable)
table.delete(plTable)
plTable := table.new(position = posFromString(plTablePosition), columns = cols, rows = rows, bgcolor = chart.bg_color, border_width = 1, border_color = chart.fg_color, frame_color = chart.fg_color, frame_width = 1)
plLastCols := cols
plLastRows := rows
plLastPos := plTablePosition
plLastSize := table_size
table.clear(plTable, 0, 0, cols – 1, rows – 1)
headerSize = tableSize(table_size)
maxProfit = math.max(retailProfitVol, smartProfitVol)
maxLoss = math.max(retailLossVol, smartLossVol)
profAlphaRetail = alphaForVal(retailProfitVol, maxProfit)
profAlphaSmart = alphaForVal(smartProfitVol, maxProfit)
lossAlphaRetail = alphaForVal(retailLossVol, maxLoss)
lossAlphaSmart = alphaForVal(smartLossVol, maxLoss)
table.cell(plTable, 0, 0, “Class”, text_color = chart.fg_color, text_halign = text.align_center, text_size = headerSize)
table.cell(plTable, 1, 0, “Profit”, text_color = chart.fg_color, text_halign = text.align_center, text_size = headerSize)
table.cell(plTable, 2, 0, “Loss”, text_color = chart.fg_color, text_halign = text.align_center, text_size = headerSize)
table.cell(plTable, 0, 1, “Retail”, text_color = chart.fg_color, text_halign = text.align_center, text_size = headerSize)
table.cell(plTable, 1, 1, str.tostring(retailProfitVol, format.volume), text_color = chart.fg_color, bgcolor = color.new(bullColor, profAlphaRetail), text_halign = text.align_center, text_size = headerSize)
table.cell(plTable, 2, 1, str.tostring(retailLossVol, format.volume), text_color = chart.fg_color, bgcolor = color.new(bearColor, lossAlphaRetail), text_halign = text.align_center, text_size = headerSize)
table.cell(plTable, 0, 2, “Smart”, text_color = chart.fg_color, text_halign = text.align_center, text_size = headerSize)
table.cell(plTable, 1, 2, str.tostring(smartProfitVol, format.volume), text_color = chart.fg_color, bgcolor = color.new(bullColor, profAlphaSmart), text_halign = text.align_center, text_size = headerSize)
table.cell(plTable, 2, 2, str.tostring(smartLossVol, format.volume), text_color = chart.fg_color, bgcolor = color.new(bearColor, lossAlphaSmart), text_halign = text.align_center, text_size = headerSize)
bubbleEnabled = bubbles and not na(barMaxAbsZ) and not na(barBubblePrice) and not na(barBubbleDir)
wRaw = math.round(barMaxAbsZ)
wClamped = math.max(1, math.min(10, wRaw))
zForTransp = math.min(10.0, math.max(0.0, barMaxAbsZ))
bubbleTransp = bubbleEnabled ? math.round((10 – zForTransp) * 80 / 9) : 100
bubbleClassOk = (who == “Both”) or (who == “Retail” and barBubbleClass == 1) or (who == “Smart Money” and barBubbleClass == 2)
classBullColor = barBubbleClass == 1 ? retailbullcol : bullColor
classBearColor = barBubbleClass == 1 ? retailbearcol : bearColor
bubbleColor = barBubbleDir == 1 ? classBullColor : classBearColor
yTiny = bubbleEnabled and bubbleClassOk and wClamped <= 2 ? barBubblePrice : na ySmall = bubbleEnabled and bubbleClassOk and wClamped > 2 and wClamped <= 4 ? barBubblePrice : na yNormal = bubbleEnabled and bubbleClassOk and wClamped > 4 and wClamped <= 6 ? barBubblePrice : na yLarge = bubbleEnabled and bubbleClassOk and wClamped > 6 and wClamped <= 8 ? barBubblePrice : na yHuge = bubbleEnabled and bubbleClassOk and wClamped > 8 ? barBubblePrice : na
plotshape(yTiny, “Volume Bubble”, shape.circle, location.absolute, color.new(bubbleColor, bubbleTransp), 0, “”, na, size = size.tiny, force_overlay = true)
plotshape(ySmall, “Volume Bubble”, shape.circle, location.absolute, color.new(bubbleColor, bubbleTransp), 0, “”, na, size = size.normal, force_overlay = true)
plotshape(yNormal, “Volume Bubble”, shape.circle, location.absolute, color.new(bubbleColor, bubbleTransp), 0, “”, na, size = size.large, force_overlay = true)
plotshape(yLarge, “Volume Bubble”, shape.circle, location.absolute, color.new(bubbleColor, bubbleTransp), 0, “”, na, size = size.huge, force_overlay = true)
plotshape(yHuge, “Volume Bubble”, shape.circle, location.absolute, color.new(bubbleColor, bubbleTransp), 0, “”, na, size = size.huge, force_overlay = true)
// ALERTS
alertcondition(retailBullBar, “Retail Bull”, “Retail bullish event detected”)
alertcondition(retailBearBar, “Retail Bear”, “Retail bearish event detected”)
alertcondition(smartBullBar, “Smart Money Bull”, “Smart Money bullish event detected”)
alertcondition(smartBearBar, “Smart Money Bear”, “Smart Money bearish event detected”)