Bonjour,
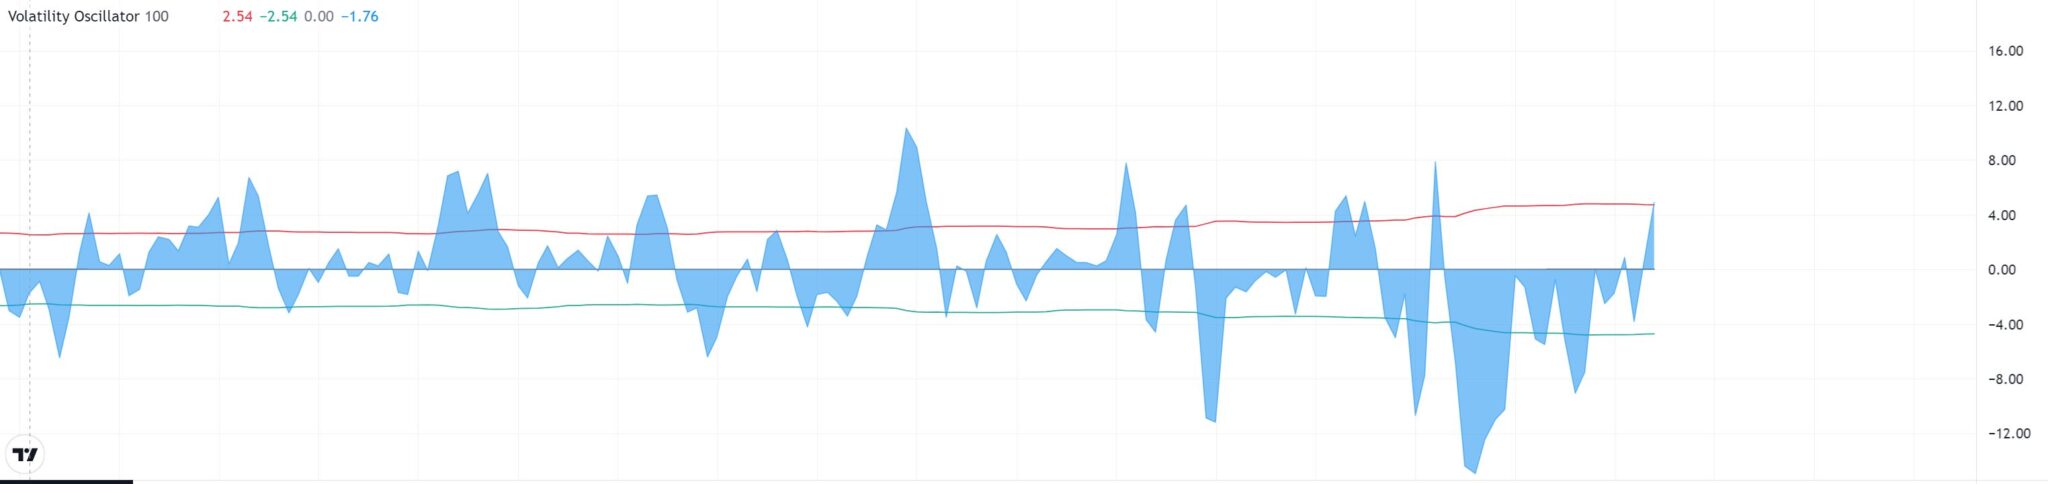
je souhaiterais avoir une conversion de ce code pour prorealtime il s’agit d’un indicateur de volatilité comme son nom l’indic
il sert a prend des mouvements quand il passe au dessus et en dessous de ces lignes bas/haut ( rouge – bleue ) photos jointes
merci voici le code
//@version=4
study("Volatility Oscillator", resolution = "")
length = input(100)
spike = close - open
x = stdev(spike,length)
y = stdev(spike,length) * -1

plot(spike, color = color.white, linewidth = 2, title = "Spike Linel")

p1 = plot(x, "Upper Line")
p2 = plot(y, "Lower Line")

plot(0, color= color.gray, title= "Zero Line")

plot(spike, color= color.blue, style=plot.style_area, transp=80, title = "Spike Fill")

osc2 = spike

lbR = 5
lbL = 5
rangeUpper =60
rangeLower = 5
plotBull = input(title="Plot Bullish", defval=true)
plotHiddenBull = input(title="Plot Hidden Bullish", defval=false)
plotBear = input(title="Plot Bearish", defval=true)
plotHiddenBear = input(title="Plot Hidden Bearish", defval=false)
delay_plot_til_closed = input(title="Delay diversion plot until candle is closed (don't repaint)", defval=false)
bearColor = color.red
bullColor = color.green
hiddenBullColor = color.new(color.green, 80)
hiddenBearColor = color.new(color.red, 80)
textColor = color.white
noneColor = color.new(color.white, 100)

repaint = (not(delay_plot_til_closed) or barstate.ishistory or barstate.isconfirmed)

plFound = na(pivotlow(osc2, lbL, lbR)) ? false : true
phFound = na(pivothigh(osc2, lbL, lbR)) ? false : true
_inRange(cond) =>
bars = barssince(cond == true)
rangeLower <= bars and bars <= rangeUpper //------------------------------------------------------------------------------ // Regular Bullish // Osc: Higher Low oscHL = osc2[lbR] > valuewhen(plFound, osc2[lbR], 1) and _inRange(plFound[1])

// Price: Lower Low

priceLL = low[lbR] < valuewhen(plFound, low[lbR], 1)
bullCond = plotBull and priceLL and oscHL and plFound and repaint

plotshape(
bullCond ? osc2[lbR] : na,
offset=-lbR,
title="Regular Bullish Label",
text="R",
style=shape.labelup,
location=location.absolute,
color=bullColor,
textcolor=textColor,
transp=0
)

//------------------------------------------------------------------------------
// Hidden Bullish
// Osc: Lower Low

oscLL = osc2[lbR] < valuewhen(plFound, osc2[lbR], 1) and _inRange(plFound[1]) // Price: Higher Low priceHL = low[lbR] > valuewhen(plFound, low[lbR], 1)
hiddenBullCond = plotHiddenBull and priceHL and oscLL and plFound and repaint

plotshape(
hiddenBullCond ? osc2[lbR] : na,
offset=-lbR,
title="Hidden Bullish Label",
text="H",
style=shape.labelup,
location=location.absolute,
color=bullColor,
textcolor=textColor,
transp=0
)

//------------------------------------------------------------------------------
// Regular Bearish
// Osc: Lower High

oscLH = osc2[lbR] < valuewhen(phFound, osc2[lbR], 1) and _inRange(phFound[1]) // Price: Higher High priceHH = high[lbR] > valuewhen(phFound, high[lbR], 1)

bearCond = plotBear and priceHH and oscLH and phFound and repaint

plotshape(
bearCond ? osc2[lbR] : na,
offset=-lbR,
title="Regular Bearish Label",
text="R",
style=shape.labeldown,
location=location.absolute,
color=bearColor,
textcolor=textColor,
transp=0
)

//------------------------------------------------------------------------------
// Hidden Bearish
// Osc: Higher High

oscHH = osc2[lbR] > valuewhen(phFound, osc2[lbR], 1) and _inRange(phFound[1])

// Price: Lower High

priceLH = high[lbR] < valuewhen(phFound, high[lbR], 1) hiddenBearCond = plotHiddenBear and priceLH and oscHH and phFound and repaint plotshape( hiddenBearCond ? osc2[lbR] : na, offset=-lbR, title="Hidden Bearish Label", text="H", style=shape.labeldown, location=location.absolute, color=bearColor, textcolor=textColor, transp=0 ) //barcolor(color = spike > 0 ? color.green : color.red )