


Conversion de l’indicateur The Echo Forecast du logiciel de trading View

Viewing 2 posts - 1 through 2 (of 2 total)

  • Author
    Posts
  • #212646 quote
    majidemajide
    Participant
    New

    study(“The Echo Forecast [LUX]”,”ECHO [LuxAlgo]”,overlay=true,max_bars_back=1000,max_lines_count=200)

    length = input(50,’Evaluation Window’,minval=0,maxval=200)

    fcast = input(50,’Forecast Window’,minval=1,maxval=200)

    fmode = input(‘Similarity’,’Forecast Mode’,options=[‘Similarity’,’Dissimilarity’])

    cmode = input(‘Cumulative’,’Forecast Construction’,options=[‘Cumulative’,’Mean’,’Linreg’])

    src = input(close)

    fcast_col = input(#2157f3,’Forecast Style’,inline=’fcast_style’,group=’Style’)

    fcast_style = input(‘· · ·’,”,options=[‘──’,’- – -‘,’· · ·’],inline=’fcast_style’,group=’Style’)

    show_area = input(true,’Show Area’,inline=’areas’,group=’Style’)

    fcast_area = input(color.new(#ff5d00,50),”,inline=’areas’,group=’Style’)

    corr_area = input(color.new(#0cb51a,50),”,inline=’areas’,group=’Style’)

    eval_area = input(color.new(color.gray,50),”,inline=’areas’,group=’Style’)

    //—-

    var lines = array.new_line(0)

    if barstate.isfirst

    for i = 0 to fcast-1

    array.push(lines,line.new(na,na,na,na))

    //—-

    n = bar_index

    d = change(src)

    top = highest(src,length+fcast*2)

    btm = lowest(src,length+fcast*2)

    if barstate.islast

    float val = na

    k = 0

    A = array.new_float(0)

    X = array.new_int(0)

    for i = 0 to fcast*2+length

    array.push(A,src[i])

    if cmode == ‘Linreg’

    array.push(X,n[i])

    a = array.slice(A,0,fcast-1)

    for i = 0 to length-1

    b = array.slice(A,fcast+i,fcast*2+i-1)

    r = array.covariance(a,b)/(array.stdev(a)*array.stdev(b))

    if fmode == ‘Similarity’

    val := r >= nz(val,r) ? r : val

    else

    val := r <= nz(val,r) ? r : val

    k := val == r ? i : k

    prev = src

    current = src

    for i = 0 to fcast-1

    e = d[fcast+k+(fcast-i-1)]

    if cmode == ‘Mean’

    current := array.avg(a) + e

    else if cmode == ‘Linreg’

    a = array.slice(A,0,fcast)

    x = array.slice(X,0,fcast)

    alpha = array.covariance(a,x)/array.variance(x)

    beta = array.avg(a) – alpha*array.avg(x)

    current := alpha*(n+i+1) + beta + e

    else

    current += e

    l = array.get(lines,i)

    line.set_xy1(l,n+i,prev)

    line.set_xy2(l,n+i+1,current)

    line.set_color(l,fcast_col)

    if fcast_style == ‘- – -‘

    line.set_style(l,line.style_dashed)

    else if fcast_style == ‘· · ·’

    line.set_style(l,line.style_dotted)

    prev := current

    if show_area

    box.delete(box.new(n-length-fcast*2+1,top,n-fcast+1,btm,

    border_color=na,

    bgcolor=eval_area)[1])

    box.delete(box.new(n-fcast+1,top,n,btm,

    border_color=na,

    bgcolor=fcast_area)[1])

    box.delete(box.new(n-k-fcast*2+1,btm,n-k-fcast,top,

    border_color=na,

    bgcolor=corr_area)[1])

    The-Echo-Forecast-LUxAlgo.pdf
    #258358 quote
    Iván GonzálezIván González
    Moderator
    Legend

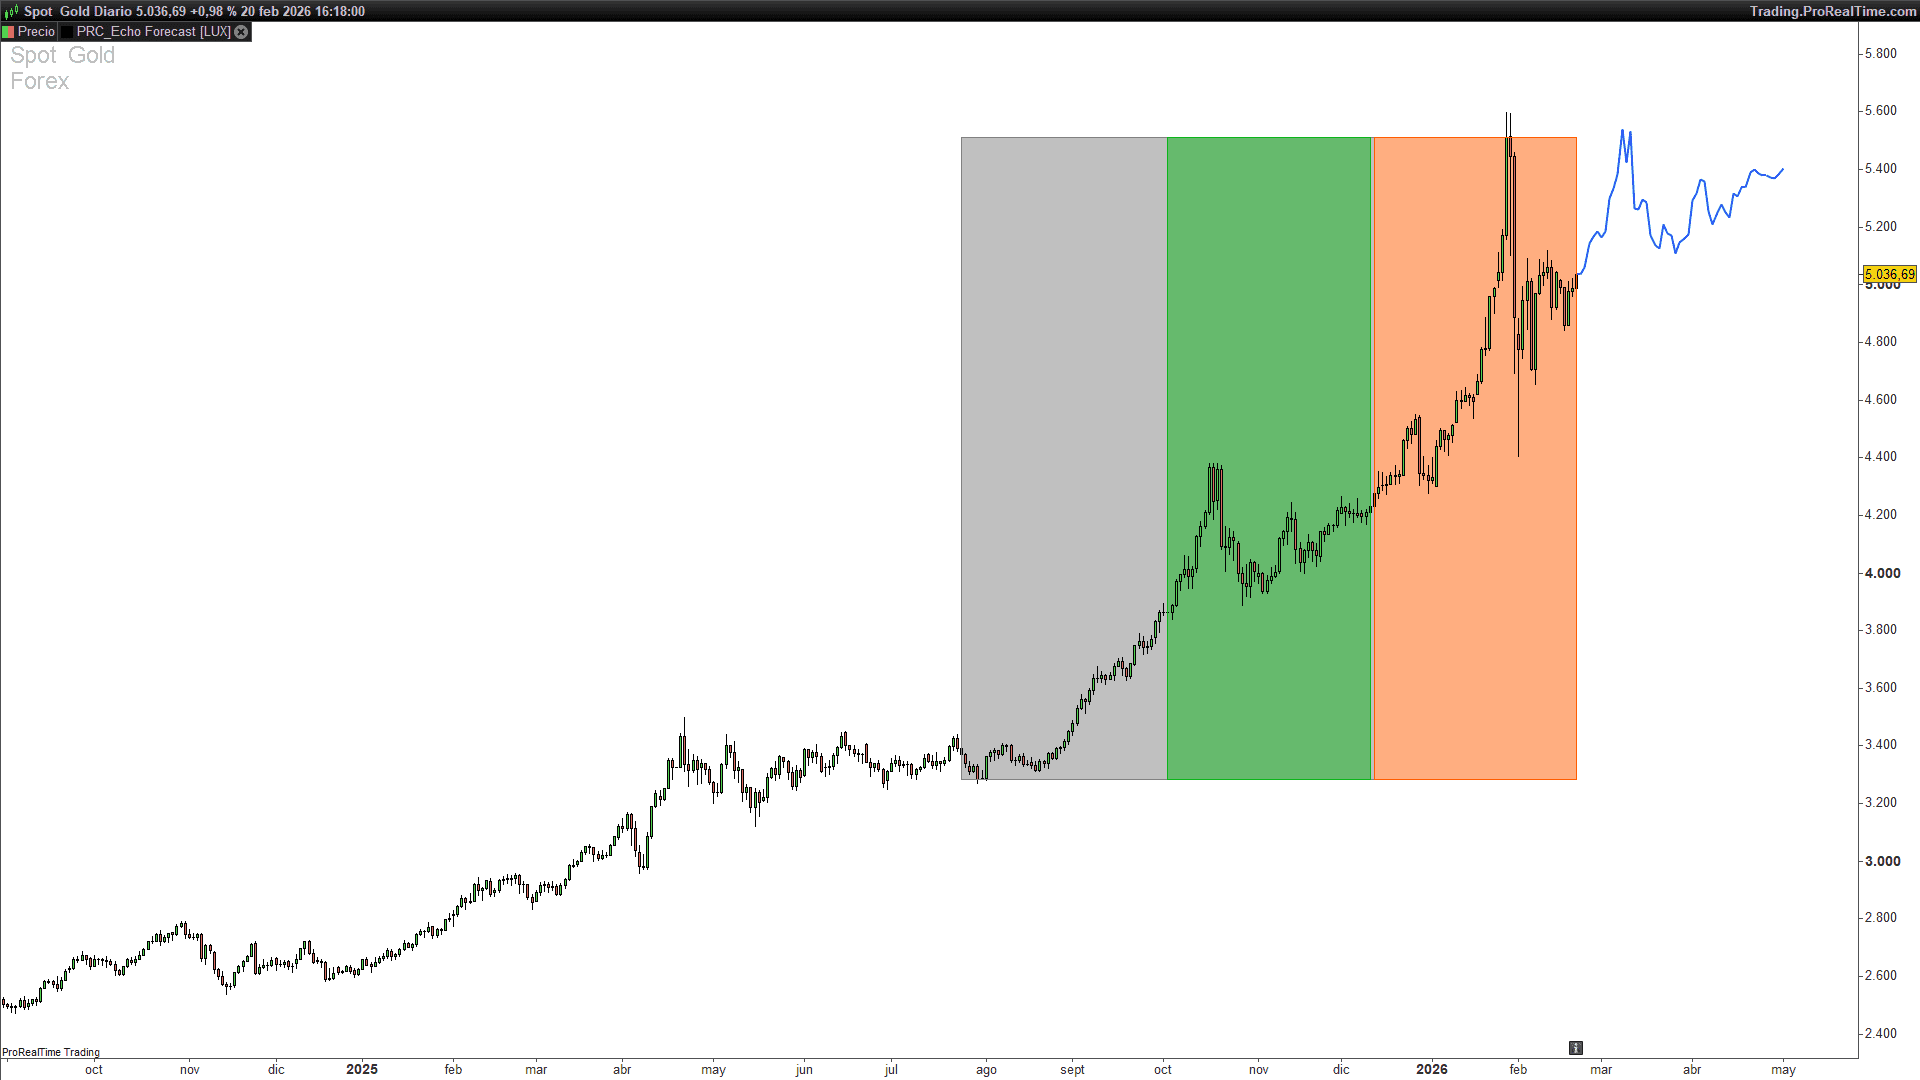
    Here it is!

    //---------------------------------------------------------------//
    // PRC_Echo Forecast [LUX] (by LuxAlgo)
    // version = 0
    // 20.02.2026
    // Iván González @ www.prorealcode.com
    // Sharing ProRealTime knowledge
    //---------------------------------------------------------------//
    defparam drawonlastbaronly = true
    //---------------------------------------------------------------//
    // === PARAMETERS ===
    //---------------------------------------------------------------//
    myLength = 50       // Evaluation Window (1 to 200)
    myFcast  = 50       // Forecast Window (1 to 200)
    fmode    = 0        // 0=Similarity, 1=Dissimilarity
    cmode    = 0        // 0=Cumulative, 1=Mean, 2=Linreg
    src      = close
    showArea = 1        // 1=show background areas, 0=hide
    //---------------------------------------------------------------//
    // === FORECAST LINE COLOR (RGB) ===
    //---------------------------------------------------------------//
    fcR = 33
    fcG = 87
    fcB = 243
    //---------------------------------------------------------------//
    // === AREA COLORS (RGB) ===
    //---------------------------------------------------------------//
    // Evaluation area (gray)
    eaR = 128
    eaG = 128
    eaB = 128
    // Recent/Forecast reference area (orange)
    faR = 255
    faG = 93
    faB = 0
    // Best correlation area (green)
    caR = 12
    caG = 181
    caB = 26
    // Area transparency (0=transparent, 255=opaque) ~50% = 127
    areaAlpha = 127
    //---------------------------------------------------------------//
    // === PRECALCULATIONS (every bar) ===
    //---------------------------------------------------------------//
    dd = src - src[1]
    totalPeriod = myLength + myFcast * 2
    
    
    topVal = highest[totalPeriod](src)
    btmVal = lowest[totalPeriod](src)
    //---------------------------------------------------------------//
    // === MAIN LOGIC (last bar only) ===
    //---------------------------------------------------------------//
    if islastbarupdate and barindex > totalPeriod then
    
    
    // -------------------------------------------//
    // STEP 1: Store historical prices in array
    // -------------------------------------------//
    totalBars = myFcast * 2 + myLength
    for i = 0 to totalBars do
    $srcArr[i] = src[i]
    next
    
    
    // Store barindex values for Linreg mode
    if cmode = 2 then
    for i = 0 to totalBars do
    $xArr[i] = barindex - i
    next
    endif
    
    
    // -------------------------------------------//
    // STEP 2: Statistics of recent window (slice a)
    // -------------------------------------------//
    sz = myFcast - 1
    
    
    // Mean of a
    sumA = 0
    for j = 0 to sz - 1 do
    sumA = sumA + $srcArr[j]
    next
    meanA = sumA / sz
    
    
    // Standard deviation of a
    ssA = 0
    for j = 0 to sz - 1 do
    devA = $srcArr[j] - meanA
    ssA = ssA + devA * devA
    next
    stdA = sqrt(ssA / sz)
    
    
    // -------------------------------------------//
    // STEP 3: Find best matching historical window
    // -------------------------------------------//
    bestCorr = undefined
    bestK = 0
    
    
    for i = 0 to myLength - 1 do
    // Slice b: starts at (myFcast + i), same size as a
    sB = myFcast + i
    
    
    // Mean of b
    sumB = 0
    for j = 0 to sz - 1 do
    sumB = sumB + $srcArr[sB + j]
    next
    meanB = sumB / sz
    
    
    // Standard deviation of b
    ssB = 0
    for j = 0 to sz - 1 do
    devB = $srcArr[sB + j] - meanB
    ssB = ssB + devB * devB
    next
    stdB = sqrt(ssB / sz)
    
    
    // Covariance(a, b)
    covAB = 0
    for j = 0 to sz - 1 do
    covAB = covAB + ($srcArr[j] - meanA) * ($srcArr[sB + j] - meanB)
    next
    covAB = covAB / sz
    
    
    // Pearson correlation
    denom = stdA * stdB
    if denom > 0 then
    corrVal = covAB / denom
    else
    corrVal = 0
    endif
    
    
    // Track best match
    if fmode = 0 then
    // Similarity: keep highest correlation
    if bestCorr = undefined then
    bestCorr = corrVal
    bestK = i
    elsif corrVal >= bestCorr then
    bestCorr = corrVal
    bestK = i
    endif
    else
    // Dissimilarity: keep lowest correlation
    if bestCorr = undefined then
    bestCorr = corrVal
    bestK = i
    elsif corrVal <= bestCorr then
    bestCorr = corrVal
    bestK = i
    endif
    endif
    next
    
    
    // -------------------------------------------//
    // STEP 4: Linreg precalculation (if needed)
    // -------------------------------------------//
    alphaLR = 0
    betaLR = 0
    
    
    if cmode = 2 then
    sumALR = 0
    sumXLR = 0
    for j = 0 to myFcast - 1 do
    sumALR = sumALR + $srcArr[j]
    sumXLR = sumXLR + $xArr[j]
    next
    meanALR = sumALR / myFcast
    meanXLR = sumXLR / myFcast
    
    
    covAX = 0
    varXX = 0
    for j = 0 to myFcast - 1 do
    covAX = covAX + ($srcArr[j] - meanALR) * ($xArr[j] - meanXLR)
    varXX = varXX + ($xArr[j] - meanXLR) * ($xArr[j] - meanXLR)
    next
    covAX = covAX / myFcast
    varXX = varXX / myFcast
    
    
    if varXX  0 then
    alphaLR = covAX / varXX
    endif
    betaLR = meanALR - alphaLR * meanXLR
    endif
    
    
    // -------------------------------------------//
    // STEP 5: Generate forecast and draw segments
    // -------------------------------------------//
    prevP = src
    currP = src
    
    
    for i = 0 to myFcast - 1 do
    // Historical change from the best matching window
    eIdx = myFcast + bestK + (myFcast - i - 1)
    e = dd[eIdx]
    
    
    if cmode = 1 then
    // Mean mode: average of recent window + historical change
    currP = meanA + e
    elsif cmode = 2 then
    // Linreg mode: regression projection + historical change
    currP = alphaLR * (barindex + i + 1) + betaLR + e
    else
    // Cumulative mode: accumulate changes from current price
    currP = currP + e
    endif
    
    
    // Draw forecast segment
    drawsegment(barindex + i, prevP, barindex + i + 1, currP) coloured(fcR, fcG, fcB) style(line, 2)
    
    
    prevP = currP
    next
    
    
    // -------------------------------------------//
    // STEP 6: Draw background areas
    // -------------------------------------------//
    if showArea = 1 then
    // Evaluation area (gray) - full evaluation zone
    drawrectangle(barindex - totalPeriod + 1, btmVal, barindex - myFcast + 1, topVal) coloured(eaR, eaG, eaB) fillcolor(eaR, eaG, eaB, areaAlpha)
    
    
    // Recent window area (orange) - the reference window
    drawrectangle(barindex - myFcast + 1, btmVal, barindex, topVal) coloured(faR, faG, faB) fillcolor(faR, faG, faB, areaAlpha)
    
    
    // Best correlation area (green) - the matched window
    drawrectangle(barindex - bestK - myFcast * 2 + 1, btmVal, barindex - bestK - myFcast, topVal) coloured(caR, caG, caB) fillcolor(caR, caG, caB, areaAlpha)
    endif
    
    
    endif
    //---------------------------------------------------------------//
    return


    XAUUSD-Diario.png XAUUSD-Diario.png
Viewing 2 posts - 1 through 2 (of 2 total)
  • You must be logged in to reply to this topic.

ProRealAI ProRealAI New

Stuck on this ProBuilder code?

Describe what this topic is trying to build, in plain English, and ProRealAI writes the ProRealTime™ indicator, screener or system for you.

Available in 7 languages
Try ProRealAI

TradingView to ProRealTime Translation Center

New Reply
Author
author-avatar
majide @majide Participant
Summary

This topic contains 1 reply,
has 1 voice, and was last updated by Iván GonzálezIván González

7 months ago.

Topic Details
Forum: TradingView to ProRealTime Translation Center Forum
Started: 04/01/2023
Status: Active
Attachments: 2 files
ProRealCode ProRealCode
Loading...

