Bonjour,
Je souhaite utiliser l’indicateur “Machine Learning Adaptative” de AlgoAlpha qui est en open source.
Serait-il possible de convertir le code en pj en langage ProBuilder pour ProRealTime.
En vous remerciant par avance.
Gilles
voici
//---------------------------------------------------------------//
// PRC_Machine Learning Adaptive SuperTrend (byAlgoAlpha)
// version = 0
// 26.08.2025
// Iván González @ www.prorealcode.com
// Sharing ProRealTime knowledge
//---------------------------------------------------------------//

//========================
// Inputs (configuración)
//========================
atrLen           = 10     // ATR Length (Pine: atr_len)
fact             = 3.0    // SuperTrend Factor (Pine: fact)
trainingPeriod   = 100    // Training Data Length (Pine: training_data_period)
highPct          = 0.75   // Percentil alto (Pine: highvol)
midPct           = 0.50   // Percentil medio (Pine: midvol)
lowPct           = 0.25   // Percentil bajo (Pine: lowvol)
maxIter          = 20     // Tope de iteraciones K-means para evitar bucles largos
eps              = 0.00001   // Umbral de convergencia

//========================
// Volatilidad (ATR)
//========================
atr = AverageTrueRange[atrLen](close)

// Rango de ATR en ventana de entrenamiento
upATR   = Highest[trainingPeriod](atr)
lowATR  = Lowest[trainingPeriod](atr)

// Inicialización de centroides por percentil (igual que Pine)
aMean = lowATR + (upATR - lowATR) * highPct
bMean = lowATR + (upATR - lowATR) * midPct
cMean = lowATR + (upATR - lowATR) * lowPct

//========================
// Estructuras para K-means
// (usamos la convención $arr[0] = contador)
//========================
$hv[0] = 0     // elementos cercanos a aMean (alta vol)
$mv[0] = 0     // elementos cercanos a bMean (media vol)
$lv[0] = 0     // elementos cercanos a cMean (baja vol)

//========================
// Bucle K-means
//========================
iter = 0
converged = 0

IF atr > 0 AND BarIndex >= trainingPeriod - 1 THEN

// Para comparar convergencia guardamos anteriores
prevA = aMean
prevB = bMean
prevC = cMean

WHILE converged = 0 DO

// Limpiar clusters
UnSet($hv)
UnSet($mv)
UnSet($lv)
$hv[0] = 0
$mv[0] = 0
$lv[0] = 0

// Asignación de cada ATR de la ventana al centroide más cercano
FOR i = 0 TO trainingPeriod - 1 DO
v = atr[i]
d1 = ABS(v - aMean)
d2 = ABS(v - bMean)
d3 = ABS(v - cMean)

IF d1 <= d2 AND d1 <= d3 THEN
$hv[$hv[0] + 1] = v
$hv[0] = $hv[0] + 1
ELSIF d2 <= d1 AND d2 <= d3 THEN
$mv[$mv[0] + 1] = v
$mv[0] = $mv[0] + 1
ELSE
$lv[$lv[0] + 1] = v
$lv[0] = $lv[0] + 1
ENDIF
NEXT

// Recalcular centroides (medias de cada cluster)
// Si algún cluster queda vacío, mantenemos el valor previo para estabilidad
IF $hv[0] > 0 THEN
sumA = 0
FOR j = 1 TO $hv[0] DO
sumA = sumA + $hv[j]
NEXT
aNew = sumA / $hv[0]
ELSE
aNew = aMean
ENDIF

IF $mv[0] > 0 THEN
sumB = 0
FOR j = 1 TO $mv[0] DO
sumB = sumB + $mv[j]
NEXT
bNew = sumB / $mv[0]
ELSE
bNew = bMean
ENDIF

IF $lv[0] > 0 THEN
sumC = 0
FOR j = 1 TO $lv[0] DO
sumC = sumC + $lv[j]
NEXT
cNew = sumC / $lv[0]
ELSE
cNew = cMean
ENDIF

// Comprobación de convergencia (cambios muy pequeños)
da = ABS(aNew - aMean)
db = ABS(bNew - bMean)
dc = ABS(cNew - cMean)

aMean = aNew
bMean = bNew
cMean = cNew

iter = iter + 1
IF (da < eps AND db < eps AND dc < eps) OR iter >= maxIter THEN
converged = 1
ENDIF

WEND

ENDIF

//========================
// Asignación del centroide actual
//========================
vdistA = ABS(atr - aMean)
vdistB = ABS(atr - bMean)
vdistC = ABS(atr - cMean)

cluster = 0   // 0=high, 1=medium, 2=low
assigned = aMean

IF vdistB < vdistA AND vdistB <= vdistC THEN
cluster = 1
assigned = bMean
ELSIF vdistC < vdistA AND vdistC < vdistB THEN
cluster = 2
assigned = cMean
ENDIF

//========================
// SuperTrend con ATR adaptativo
//========================
src = (high + low) / 2
up  = src + fact * assigned
dn  = src - fact * assigned

ONCE upperBand = up
ONCE lowerBand = dn
prevUpper = upperBand[1]
prevLower = lowerBand[1]

candUpper = up
candLower = dn

IF (candLower <= prevLower AND close[1] >= prevLower) THEN
lowerBand = prevLower
ELSE
lowerBand = candLower
ENDIF

IF (candUpper >= prevUpper AND close[1] <= prevUpper) THEN
upperBand = prevUpper
ELSE
upperBand = candUpper
ENDIF

// Dirección y SuperTrend
ONCE isuperTrend = src
prevST = isuperTrend[1]
IF BarIndex = 0 THEN
dir = 1
ELSE
IF prevST = prevUpper THEN
// Si venimos de banda superior, cambio a bajista solo si close > upperBand
IF close > upperBand THEN
dir = -1
ELSE
dir = 1
ENDIF
ELSE
// Si venimos de banda inferior, cambio a alcista solo si close < lowerBand
IF close < lowerBand THEN
dir = 1
ELSE
dir = -1
ENDIF
ENDIF
ENDIF

IF dir = -1 THEN
isuperTrend = lowerBand
ELSE
isuperTrend = upperBand
ENDIF

//========================
// Color dinámico
//========================
IF dir = 1 THEN
r = 255
g = 0
ELSE
r = 0
g = 255
ENDIF
colorbetween(isupertrend,src,r,g,0,30)

//========================
// Señales de entrada
//========================
if dir=1 and dir<>dir[1] then
drawarrowdown(barindex,isupertrend)coloured("red")
elsif dir=-1 and dir<>dir[1] then
drawarrowup(barindex,isupertrend)coloured("green")
endif

if islastbarupdate then
atr1=round(atr,2)
if cluster=0 then
drawtext("Current Volatility: HIGH(ATR:#atr1#)",-165,-100)anchor(topright,xshift,yshift)
elsif cluster=1 then
drawtext("Current Volatility: MEDIUM(ATR:#atr1#)",-165,-100)anchor(topright,xshift,yshift)
elsif cluster=2 then
drawtext("Current Volatility: LOW(ATR:#atr1#)",-165,-100)anchor(topright,xshift,yshift)
endif
drawrectangle(-330,-80,-10,-120)anchor(topright,xshift,yshift)
endif
//========================
// Salida
//========================
RETURN isuperTrend STYLE(Point,2) COLOURED(r,g,0)
Bonjour,
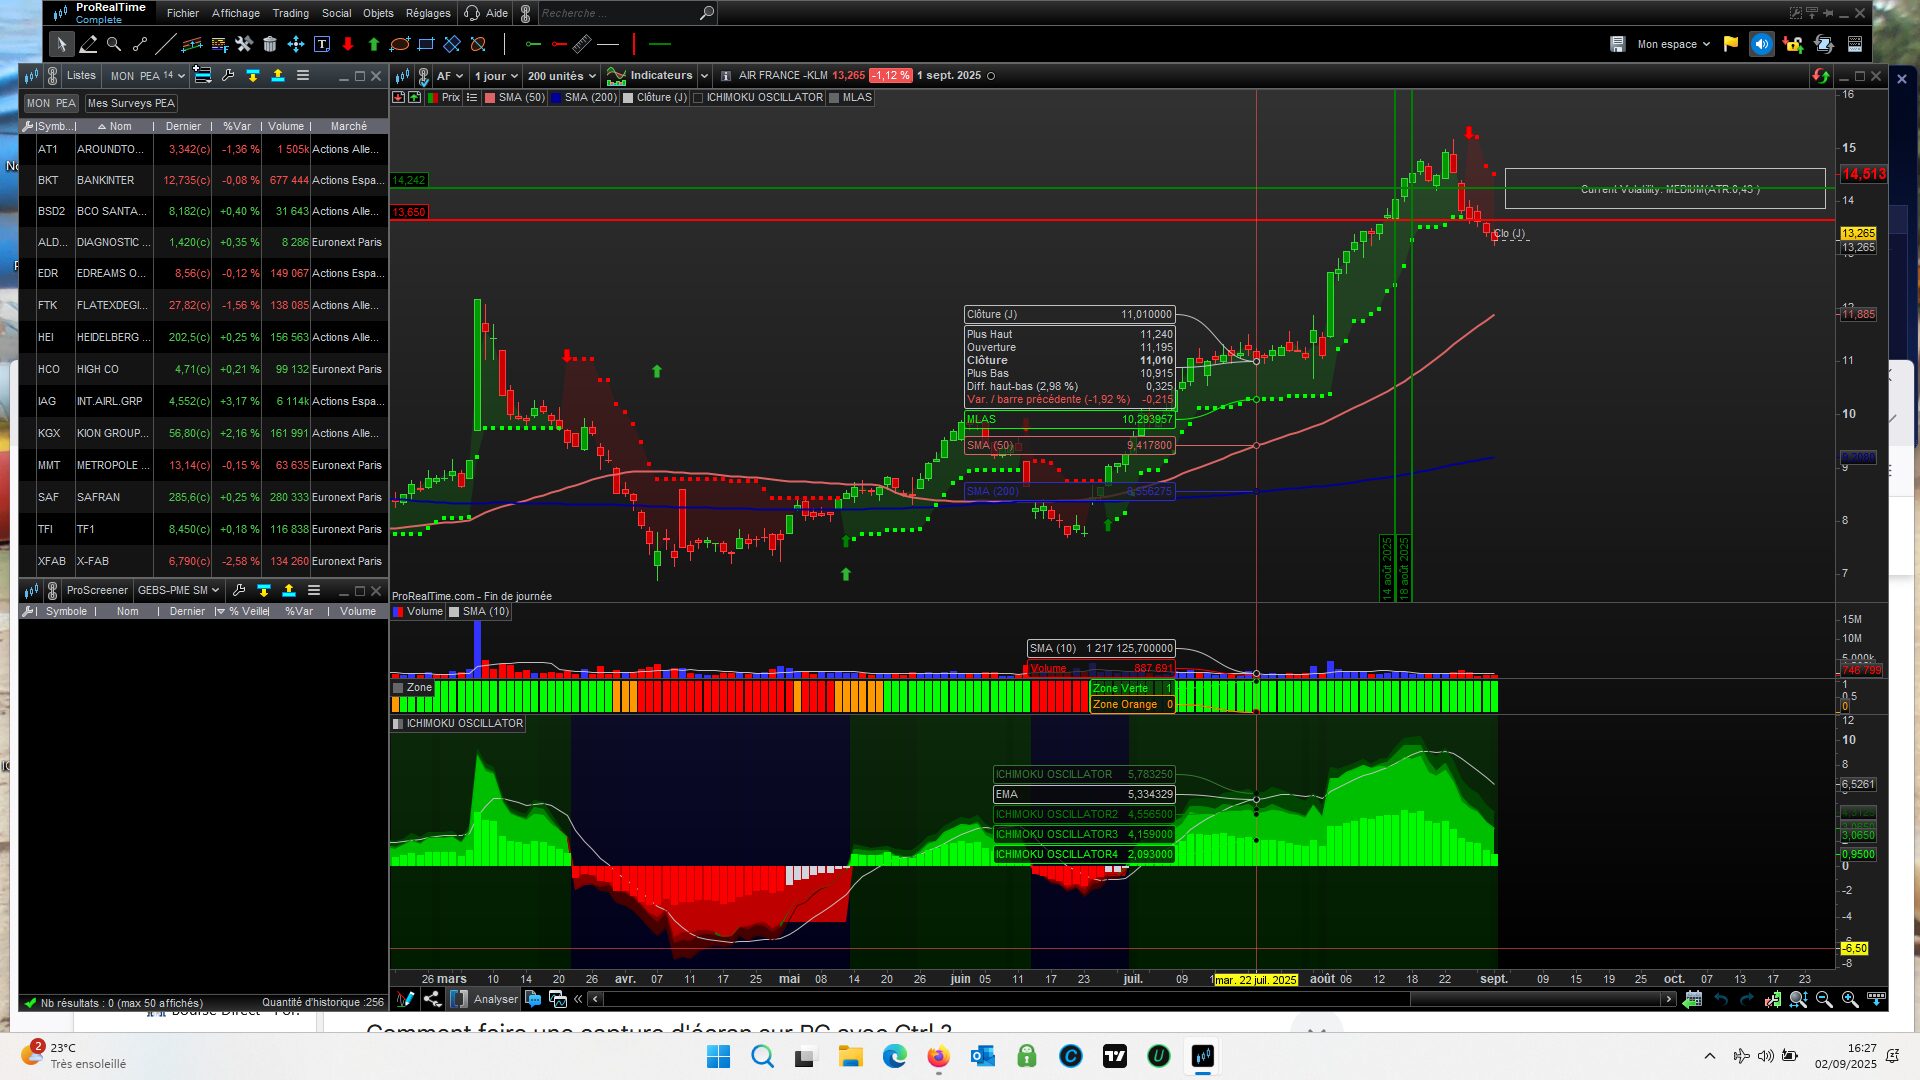
J’ai utilisé lindicateur traduit en PRT et le résultat est identique à l’original, cependant les symboles d’achat et de vente, les fleches vertes et rouge ne sont pas bien visibles car elles ressemblent trop aux bougies (voir fichier joint).
Ce serait parfait si vous pouviez les rendre plus visibles soit en mettant des flèches plus grosses ou en remplacant les fleches par des triangles ou autres symboles et/ou en mettant des couleurs differentes des bougies (jaune et bleu par exemple).
En vous remerciant par avance.
Gilou34.
Bonjour. On ne peut pas agrandir les flèches. À la place, on peut les remplacer par des triangles, par exemple en utilisant l’expression
DRAWTEXT("text", x1, y1, <font>, <style>, <size>) COLOURED(R,V,B,a)
Cherche les lignes où apparaissent drawarrowup / draarrowdown et remplace-les par celles-ci.
if dir=1 and dir<>dir[1] then
drawtext("▼",barindex,isupertrend, dialog,bold,30)coloured("red")
elsif dir=-1 and dir<>dir[1] then
drawtext("▲",barindex,isupertrend,dialog,bold,30)coloured("green")
endif