Bonsoir,
pour information, est-ce que vous pourriez convertir un code écrit en JAVA (chez mon autre courtier Dukascopy) pour l’adapter au format PRT?
Si oui, je mettrai le code dans l’endroit approprié.
Bonne soirée.
Merci de poster des images avant d’ajouter le code et de bien vérifier que ce code source n’est pas soumis à copyright.
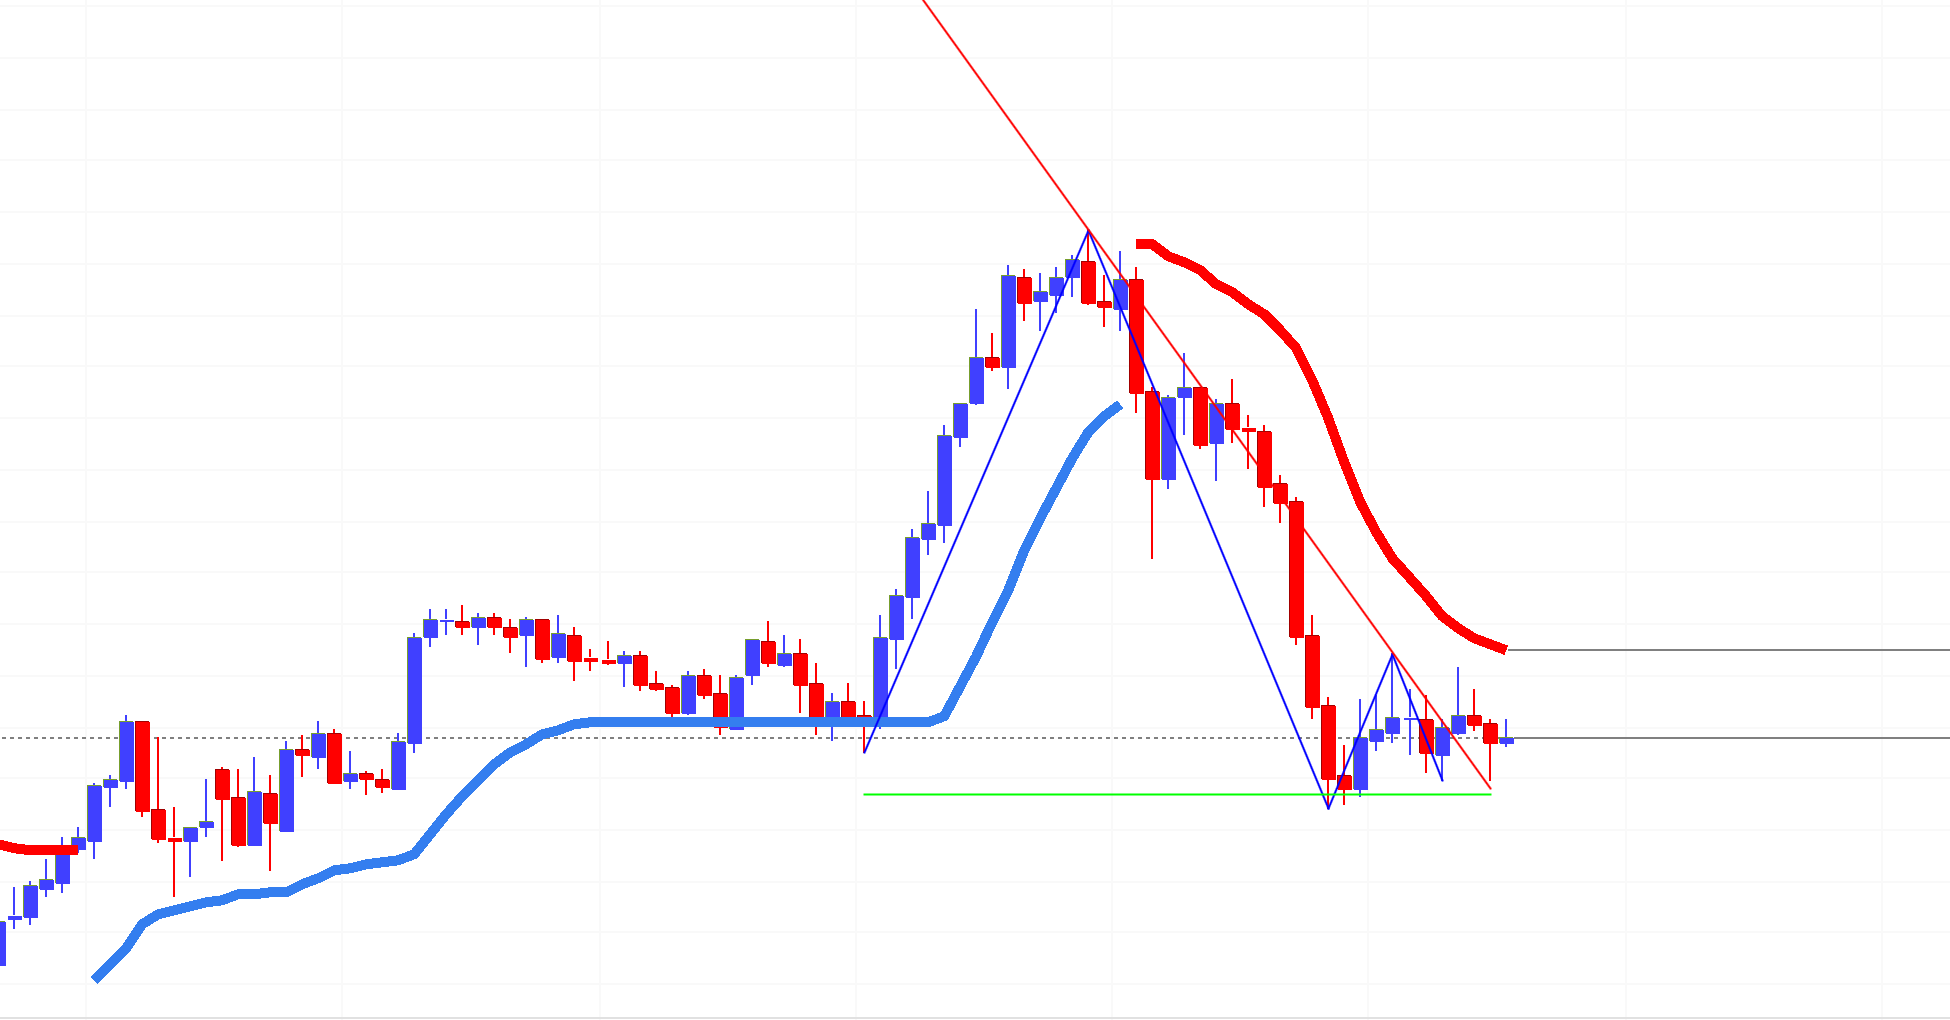
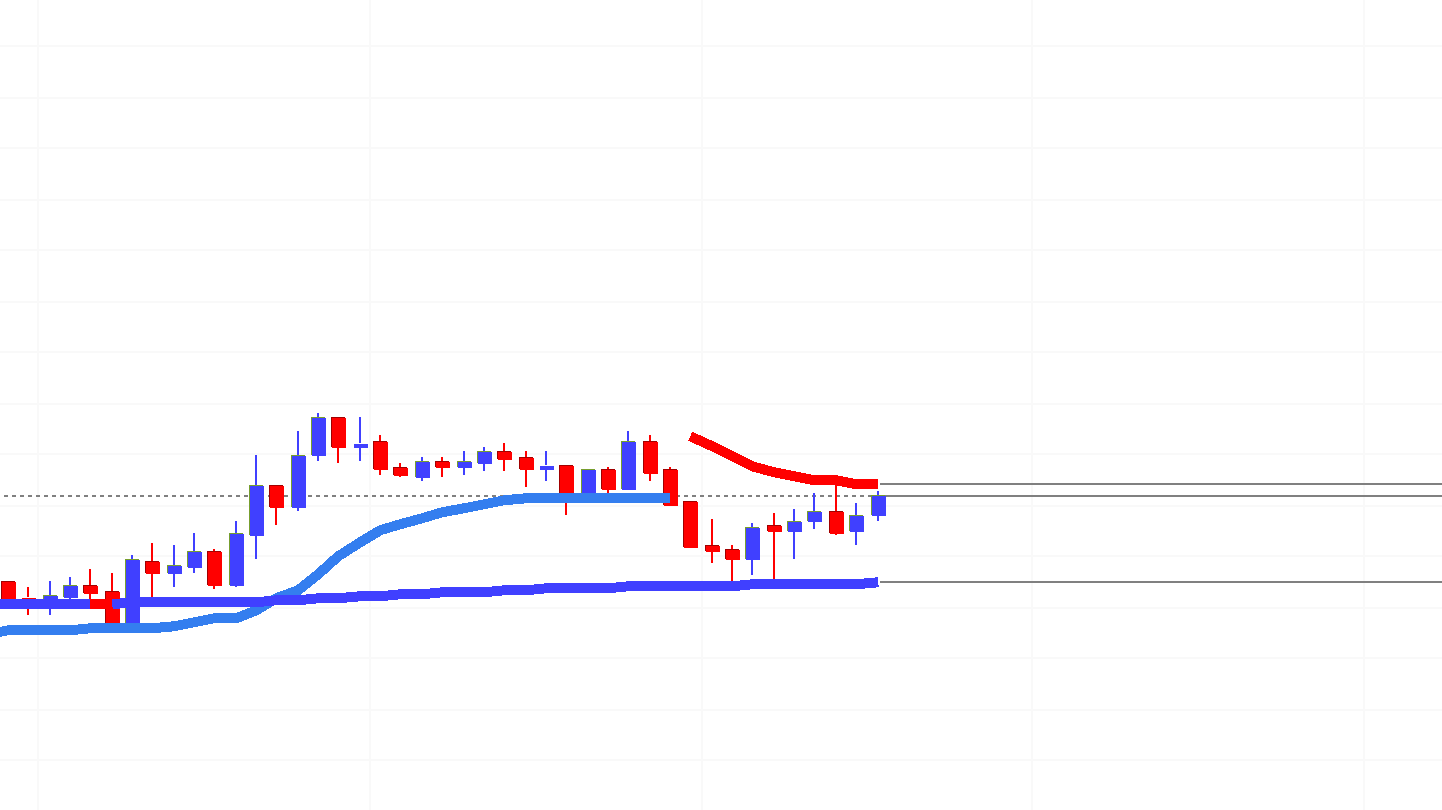
Voici une image de l’indicateur : il ressemble (me semble-t-il) au SAR.
et le code.
Je n’ai pas vu de copyright.
Merci.
package com.dukascopy.indicators;

import com.dukascopy.api.DefaultColors;
import com.dukascopy.api.indicators.DoubleRangeDescription;
import com.dukascopy.api.indicators.IIndicator;
import com.dukascopy.api.indicators.IIndicatorContext;
import com.dukascopy.api.indicators.IndicatorInfo;
import com.dukascopy.api.indicators.IndicatorResult;
import com.dukascopy.api.indicators.InputParameterInfo;
import com.dukascopy.api.indicators.IntegerRangeDescription;
import com.dukascopy.api.indicators.OptInputParameterInfo;
import com.dukascopy.api.indicators.OutputParameterInfo;

public class TrendEnvelopesIndicator1 implements IIndicator {
private IIndicator lwma;

private int timePeriod = 14;
private double deviation = 0.1;

private IndicatorInfo indicatorInfo;
private InputParameterInfo[] inputParameterInfos;
private OutputParameterInfo[] outputParameterInfos;
private OptInputParameterInfo[] optInputParameterInfos;

private final double[][][] inputs = new double[1][][];
private final double[][] outputs = new double[2][];

public void onStart(IIndicatorContext context) {
lwma = context.getIndicatorsProvider().getIndicator("LWMA");

indicatorInfo = new IndicatorInfo("TrendEnvelopes", "Trend Envelope", "Overlap Studies", true, false, true, 1, 2, 2);

inputParameterInfos = new InputParameterInfo[] {
new InputParameterInfo("Price", InputParameterInfo.Type.PRICE)
};

optInputParameterInfos = new OptInputParameterInfo[] {
new OptInputParameterInfo("Time Period", OptInputParameterInfo.Type.OTHER, new IntegerRangeDescription(timePeriod, 2, 500, 1)),
new OptInputParameterInfo("Deviation", OptInputParameterInfo.Type.OTHER, new DoubleRangeDescription(deviation, 0.01, 100, 0.01, 2))
};

outputParameterInfos = new OutputParameterInfo[] {
new OutputParameterInfo("Low Band", OutputParameterInfo.Type.DOUBLE, OutputParameterInfo.DrawingStyle.LINE),
new OutputParameterInfo("High Band", OutputParameterInfo.Type.DOUBLE, OutputParameterInfo.DrawingStyle.LINE)
};

outputParameterInfos[0].setColor(DefaultColors.ROYAL_BLUE);
outputParameterInfos[0].setGapAtNaN(true);
outputParameterInfos[1].setColor(DefaultColors.RED);
outputParameterInfos[1].setGapAtNaN(true);
}

public IndicatorResult calculate(int startIndex, int endIndex) {
if (startIndex - getLookback() < 0) {
startIndex = getLookback();
}
if (startIndex > endIndex) {
return new IndicatorResult(0, 0);
}

double[] dsma = new double[endIndex - startIndex + 1];
lwma.setInputParameter(0, inputs[0][1]);
lwma.setOptInputParameter(0, timePeriod);
lwma.setOutputParameter(0, dsma);
lwma.calculate(startIndex - 1, endIndex - 1);

double[] valuesLow = new double[endIndex - startIndex + 1];
double[] valuesHigh = new double[endIndex - startIndex + 1];
int trend = 0;

for (int i = startIndex, j = 0; i <= endIndex; i++, j++) {
//Inputs: 0 open, 1 close, 2 high, 3 low, 4 volume
valuesLow[j] = (1 - deviation / 100) * dsma[j];
valuesHigh[j] = (1 + deviation / 100) * dsma[j];

if (inputs[0][1][i] > valuesHigh[j]) {
trend = 1;
} else if (inputs[0][1][i] < valuesLow[j]) {
trend = -1;
}

if (trend > 0) {
outputs[1][j] = Double.NaN;
if (j > 0 && valuesLow[j] < valuesLow[j - 1]) {
valuesLow[j] = valuesLow[j - 1];
}
outputs[0][j] = valuesLow[j];
} else {
outputs[0][j] = Double.NaN;
if (j > 0 && valuesHigh[j] > valuesHigh[j - 1]) {
valuesHigh[j] = valuesHigh[j - 1];
}
outputs[1][j] = valuesHigh[j];
}
}

return new IndicatorResult(startIndex, endIndex - startIndex + 1);
}

public IndicatorInfo getIndicatorInfo() {
return indicatorInfo;
}

public InputParameterInfo getInputParameterInfo(int index) {
if (index < inputParameterInfos.length) {
return inputParameterInfos[index];
}
return null;
}

public OptInputParameterInfo getOptInputParameterInfo(int index) {
if (index < optInputParameterInfos.length) {
return optInputParameterInfos[index];
}
return null;
}

public OutputParameterInfo getOutputParameterInfo(int index) {
if (index < outputParameterInfos.length) {
return outputParameterInfos[index];
}
return null;
}

public void setInputParameter(int index, Object array) {
inputs[index] = (double[][]) array;
}

public void setOutputParameter(int index, Object array) {
switch (index) {
case 0:
outputs[index] = (double[]) array;
break;
case 1:
outputs[index] = (double[]) array;
break;
default:
throw new ArrayIndexOutOfBoundsException(index);
}
}

public void setOptInputParameter(int index, Object value) {
switch (index) {
case 0:
timePeriod = (Integer) value;
lwma.setOptInputParameter(0, timePeriod);
break;
case 1:
deviation = (Double) value;
break;
default:
throw new ArrayIndexOutOfBoundsException(index);
}
}

public int getLookback() {
return lwma.getLookback() + 1;
}

public int getLookforward() {
return 0;
}
}
Le code ci-dessous doit être correct, merci de confirmer.
Il s’agit en fait d’un breakout des bandes Enveloppes qui permet le passage de la tendance haussière à baissière et vice-versa.
timePeriod=14
Deviation=0.01

price=customclose

dsma = WeightedAverage[timePeriod](price)
valuesLow = (1 - deviation / 100) * dsma
valuesHigh = (1 + deviation / 100) * dsma

inputs=price

if (inputs > valuesHigh) then
trend = 1
elsif (inputs < valuesLow) then
trend = -1
endif

if (trend > 0) then
alpha1=0
if ( valuesLow < valuesLow[1]) then
valuesLow = valuesLow[1]
endif
if trend[1]>0 then
outputs0 = valuesLow
outputs1 = valueshigh
alpha0 = 255
else
drawtext("●",barindex,valueslow,dialog,bold,22) coloured(65,105,225)
endif
else
alpha0=0
if (valuesHigh > valuesHigh[1]) then
valuesHigh = valuesHigh[1]
endif
if trend[1]<0 then
outputs1 = valuesHigh
outputs0 = valueslow
alpha1 = 255
else
drawtext("●",barindex,valueshigh,dialog,bold,22) coloured(255,0,0)
endif
endif


return outputs0 coloured(65,105,225,alpha0) style(line,4), outputs1 coloured(255,0,0,alpha1) style(line,4)
Bonsoir,
c’est impeccable. Merci et bonne soirée. Par curiosité, cet indicateur se rapproche t il d’un indicateur existant pour PRT ?
Il s’agit d’un principe assez répandu de HiLo switch, si le prix tombe en dessous d’une bande alors on switch sur l’autre et vice-versa. Une autre version répandue avec les bandes de Bollinger : BBands stop
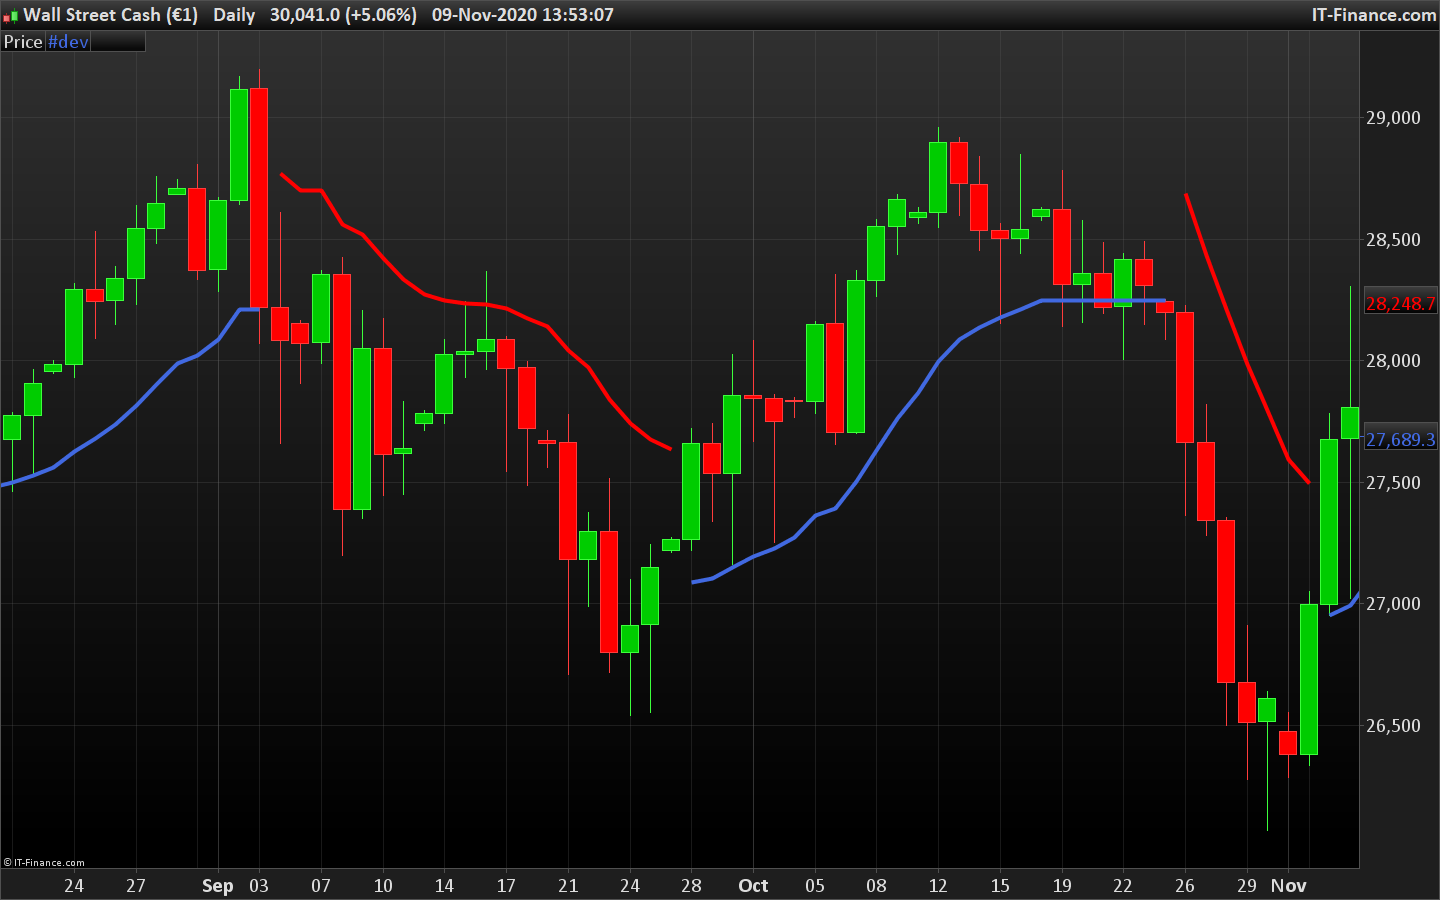
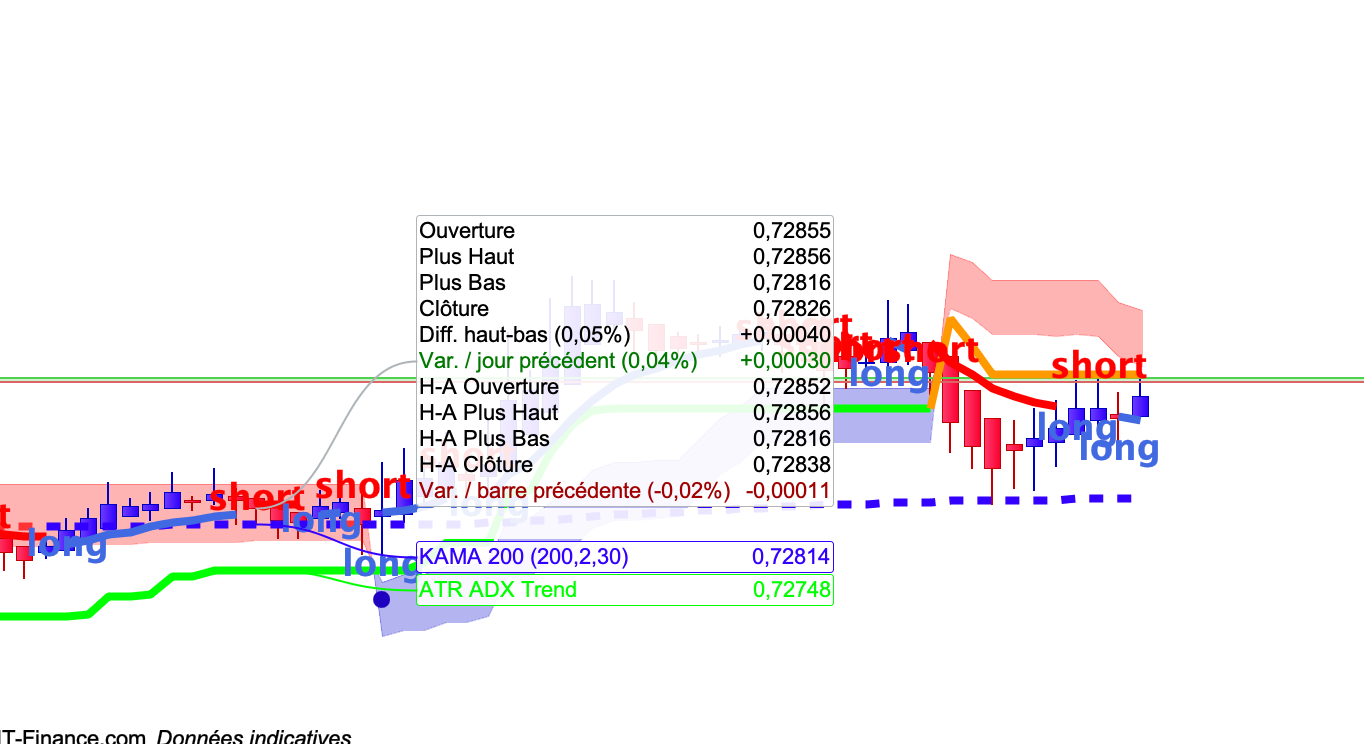
merci pour cette information. Juste une remarque : le signal est plus précoce sur IG que sur Dukascopy : copie écran 1 = IG / copie écran 2 = Dukascopy
Pas de signal chez Dukascopy.
 Fr7
Fr7Participant
Master
doble desviación privada = 0,1 ;
Nicolas il y a une petite erreur dans Déviation = 0.01
timePeriod = 14
Desviación = 0,1

precio = personalizadoclose

dsma = WeightedAverage [timePeriod] (precio)
valuesLow = (1 - desviación / 100) * dsma
valores Alto = (1 + desviación / 100) * dsma

insumos = precio

si (entradas> valores alto) entonces
tendencia = 1
elsif (input <valuesLow) luego
tendencia = -1
terminara si

si (tendencia> 0) entonces
alpha1 = 0
si (valuesLow <valuesLow [1]) entonces
valuesLow = valuesLow [1]
terminara si
si la tendencia [1]> 0 entonces
salidas0 = valoresBajo
salidas1 = valores alto
alpha0 = 255
más
drawtext ("●", barindex, valueslow, dialog, bold, 22) coloreado (65,105,225)
terminara si
más
alpha0 = 0
if (valuesHigh> valuesHigh [1]) entonces
valuesHigh = valuesHigh [1]
terminara si
si la tendencia [1] <0 entonces
salidas1 = valores Alto
salidas0 = valores bajo
alpha1 = 255
más
drawtext ("●", barindex, valueshigh, dialog, bold, 22) coloreado (255,0,0)
terminara si
terminara si


devuelve salidas0 color (65,105,225, alpha0) estilo (línea, 4), salidas1 color (255,0,0, alpha1) estilo (línea, 4)
Fr7Participant
Master
timePeriod=14
Deviation=0.1

price=customclose

dsma = WeightedAverage[timePeriod](price)
valuesLow = (1 - deviation / 100) * dsma
valuesHigh = (1 + deviation / 100) * dsma

inputs=price

if (inputs > valuesHigh) then
trend = 1
elsif (inputs < valuesLow) then
trend = -1
endif

if (trend > 0) then
alpha1=0
if ( valuesLow < valuesLow[1]) then
valuesLow = valuesLow[1]
endif
if trend[1]>0 then
outputs0 = valuesLow
outputs1 = valueshigh
alpha0 = 255
else
drawtext("●",barindex,valueslow,dialog,bold,22) coloured(65,105,225)
endif
else
alpha0=0
if (valuesHigh > valuesHigh[1]) then
valuesHigh = valuesHigh[1]
endif
if trend[1]<0 then
outputs1 = valuesHigh
outputs0 = valueslow
alpha1 = 255
else
drawtext("●",barindex,valueshigh,dialog,bold,22) coloured(255,0,0)
endif
endif


return outputs0 coloured(65,105,225,alpha0) style(line,4), outputs1 coloured(255,0,0,alpha1) style(line,4)