Conversion code RSI SWING de TV

Viewing 8 posts - 1 through 8 (of 8 total)
  • Author
    Posts
  • #231709 quote
    maxlys
    Participant
    Senior

    Bonjour,

    Serait-il possible de convertir le code ci dessous de TV a PRRT ?

    Avec si possible la possibilité de faire afficher ou pas (au choix) les lignes.

    En vous remerciant

    // This source code is subject to the terms of the Mozilla Public License 2.0 at https://mozilla.org/MPL/2.0/
    // © BalintDavid
    
    // WHAT IT DOES AND HOW TO USE:
    // In the Input page you configure the RSI
    // 
    // The indicator draws swings on the chart based on RSI extremes
    // Example: Lines are draws from OVERSOLD to OVERBOUGHT and vice-versa
    // If we keep geing in deeper OVERBOUGHT or OVERSOLD, the swinglines follow the price, till another cycle is complete
    // In the labels you see the swing's relation to the structure: If the swing high is higher then the previous, it becomes Higher High aka HH
    
    //@version=4
    study("RSI Swing Indicator", overlay=true, max_bars_back=1000)
    
    // RSI Settings for user
    rsiSource = input(title="RSI Source", type=input.source, defval=close)
    rsiLength = input(title="RSI Length", type=input.integer, defval=7)
    rsiOverbought = input(title="RSI Overbought", type=input.integer, defval=70, minval=51, maxval=100)
    rsiOvesold = input(title="RSI Oversold", type=input.integer, defval=30, minval=1, maxval=49)
    
    // RSI value based on inbuilt RSI
    rsiValue = rsi(rsiSource, rsiLength)
    
    // Get the current state
    isOverbought = rsiValue >= rsiOverbought
    isOversold = rsiValue <= rsiOvesold
    
    // State of the last extreme 0 for initialization, 1 = overbought, 2 = oversold
    var laststate = 0
    
    // Highest and Lowest prices since the last state change
    var hh = low
    var ll = high
    
    // Labels
    var label labelll = na
    var label labelhh = na
    
    // Swing lines
    var line line_up = na
    var line line_down = na
    
    var last_actual_label_hh_price = 0.0
    var last_actual_label_ll_price = 0.0
    
    #231802 quote
    Iván González
    Moderator
    Master

    Bonjour, je pense que vous n'avez pas copié tout le code… Si vous insérez également un exemple de graphique, mieux c'est.

    #231806 quote
    maxlys
    Participant
    Senior

    Bonjour

    Effectivement le code ne c’est pas copié en totalité, je n’avais pas fait attention.

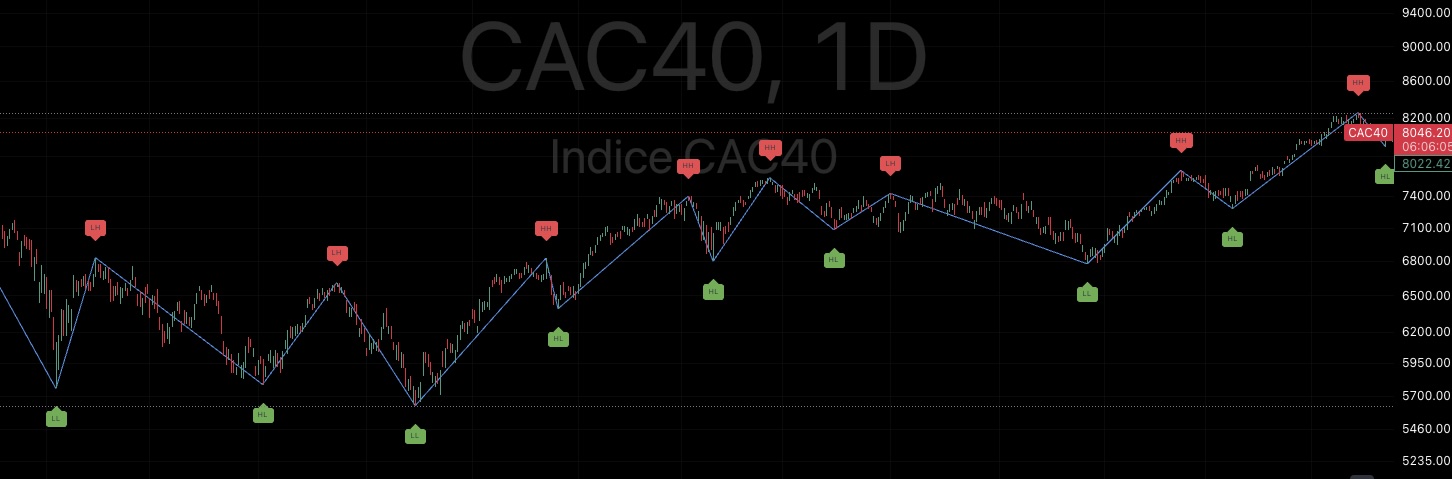
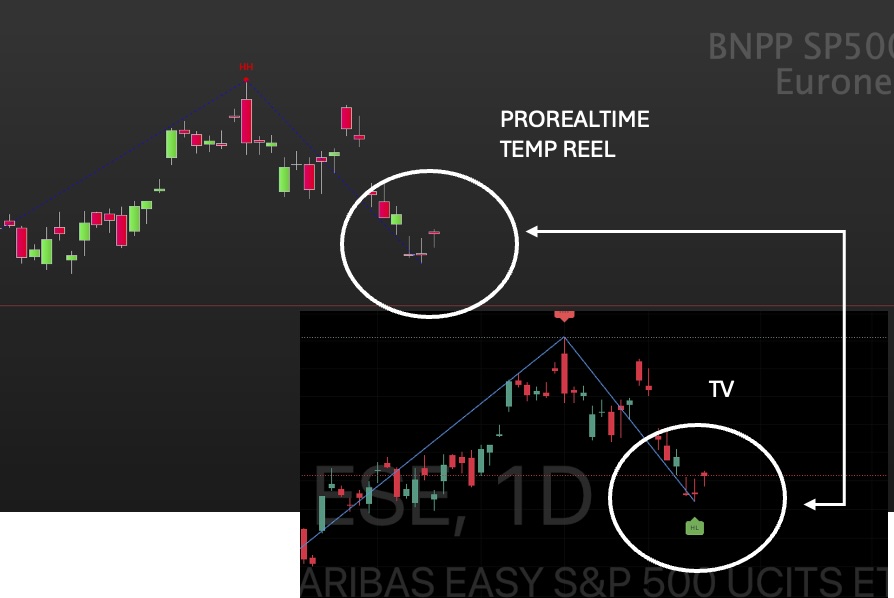
    Sur la photo indication des haut et bas indiqué par cet indicateur ( avec possibilité de les reliers par une ligne (bleu) mais ligne pas essentielle.

    Merci


    // This source code is subject to the terms of the Mozilla Public License 2.0 at https://mozilla.org/MPL/2.0/
    // © BalintDavid
    
    // WHAT IT DOES AND HOW TO USE:
    // In the Input page you configure the RSI
    // 
    // The indicator draws swings on the chart based on RSI extremes
    // Example: Lines are draws from OVERSOLD to OVERBOUGHT and vice-versa
    // If we keep geing in deeper OVERBOUGHT or OVERSOLD, the swinglines follow the price, till another cycle is complete
    // In the labels you see the swing's relation to the structure: If the swing high is higher then the previous, it becomes Higher High aka HH
    
    
    //@version=4
    study("RSI Swing Indicator", overlay=true, max_bars_back=1000)
    
    // RSI Settings for user
    rsiSource = input(title="RSI Source", type=input.source, defval=close)
    rsiLength = input(title="RSI Length", type=input.integer, defval=7)
    rsiOverbought = input(title="RSI Overbought", type=input.integer, defval=70, minval=51, maxval=100)
    rsiOvesold = input(title="RSI Oversold", type=input.integer, defval=30, minval=1, maxval=49)
    
    // RSI value based on inbuilt RSI
    rsiValue = rsi(rsiSource, rsiLength)
    
    // Get the current state
    isOverbought = rsiValue >= rsiOverbought
    isOversold = rsiValue <= rsiOvesold
    
    // State of the last extreme 0 for initialization, 1 = overbought, 2 = oversold
    var laststate = 0
    
    // Highest and Lowest prices since the last state change
    var hh = low
    var ll = high
    
    // Labels
    var label labelll = na
    var label labelhh = na
    
    // Swing lines
    var line line_up = na
    var line line_down = na
    
    var last_actual_label_hh_price = 0.0
    var last_actual_label_ll_price = 0.0
    
    
    // FUNCTIONS
    obLabelText() =>
        if(last_actual_label_hh_price < high)
            "HH"
        else
            "LH"
    //plot(last_actual_label_hh_price)
    osLabelText() =>
        if(last_actual_label_ll_price < low)
            "HL"
        else
            "LL"
    
    // Create oversold or overbought label
    createOverBoughtLabel(isIt) =>
        if(isIt)
            label.new(x=bar_index, y=na ,yloc=yloc.abovebar, style=label.style_label_down, color=color.red, size=size.tiny, text=obLabelText())
        else
            label.new(x=bar_index, y=na ,yloc=yloc.belowbar, style=label.style_label_up, color=color.green, size=size.tiny, text=osLabelText())
           
            
    // Move the oversold swing and label
    moveOversoldLabel() =>
        label.set_x(labelll, bar_index)
        label.set_y(labelll, low)
        label.set_text(labelll, osLabelText())
        line.set_x1(line_down, bar_index)
        line.set_y1(line_down, low)
    
    moveOverBoughtLabel() =>
        label.set_x(labelhh, bar_index)
        label.set_y(labelhh, high)
        label.set_text(labelhh, obLabelText())
        line.set_x1(line_up, bar_index)
        line.set_y1(line_up, high)
    
    // We go from oversold straight to overbought NEW DRAWINGS CREATED HERE
    if(laststate == 2 and isOverbought)
        hh := high
        labelhh := createOverBoughtLabel(true)
        last_actual_label_ll_price := label.get_y(labelll)
        labelll_ts = label.get_x(labelll)
        labelll_price = label.get_y(labelll)
        line_up := line.new(x1=bar_index, y1=high, x2=labelll_ts, y2=labelll_price, width=1)
    
    // We go from overbought straight to oversold  NEW DRAWINGS CREATED HERE
    if(laststate == 1 and isOversold)
        ll := low
        labelll := createOverBoughtLabel(false)
        last_actual_label_hh_price := label.get_y(labelhh)
        labelhh_ts = label.get_x(labelhh)
        labelhh_price = label.get_y(labelhh)
        line_down := line.new(x1=bar_index, y1=high, x2=labelhh_ts, y2=labelhh_price, width=1)
    
    
    // If we are overbought
    if(isOverbought)
        if(high >= hh)
            hh := high
            moveOverBoughtLabel()
        laststate := 1
        
    // If we are oversold
    if(isOversold)
        if(low <= ll)
            ll := low
            moveOversoldLabel()
        laststate := 2
        
        
    // If last state was overbought and we are overbought
    if(laststate == 1 and isOverbought)
        if(hh <= high)
            hh := high
            moveOverBoughtLabel()
        
    //If we are oversold and the last state was oversold, move the drawings to the lowest price
    if(laststate == 2 and isOversold)
        if(low <= ll)
            ll := low
            moveOversoldLabel()
    
    
    // If last state was overbought
    if(laststate == 1)
        if(hh <= high)
            hh := high
            moveOverBoughtLabel()
            
    // If last stare was oversold
    if(laststate == 2)
        if(ll >= low)
            ll := low
            moveOversoldLabel()
    #231826 quote
    Iván González
    Moderator
    Master

    Bonjour
    Voici le code traduit :
    https://www.prorealcode.com/prorealtime-indicators/rsi-swing-indicator/

    //--------------------------------------------------------------//
    //PRC_RSI Swing Indicator
    //version = 0
    //23.04.24
    //Iván González @ www.prorealcode.com
    //Sharing ProRealTime knowledge
    //--------------------------------------------------------------//
    //----Inputs----------------------------------------------------//
    rsisource=customclose
    rsiLength=7
    rsioverbought=70
    rsioversold=30
    //--------------------------------------------------------------//
    //-----RSI value------------------------------------------------//
    rsivalue=rsi[rsilength](rsiSource)
    //-----Current State--------------------------------------------//
    isOverbought = rsiValue >= rsiOverbought
    isOversold = rsiValue <= rsioversold
    //--------------------------------------------------------------//
    //-----High and low channel-------------------------------------//
    //---Low: calculated when is not overbought
    if isOverbought then
    notob=0
    else
    notob=notob+1
    pl=lowest[notob](low)
    plx=barindex-barssince(pl=low)
    endif
    //---High: calculated when is not oversold
    if isOversold then
    notos=0
    else
    notos=notos+1
    ph=highest[notos](high)
    phx=barindex - barssince(ph=high)
    endif
    //--------------------------------------------------------------//
    //-----Pivot Points (High&Low)----------------------------------//
    //---Check after exit oversold state
    if isoversold[1] and not isoversold then
    prevlastosx=lastosx//keep the previous pivot barindex
    lastosx=plx//set the new pivot barindex
    //---Draw only if is the last high
    if lastosx>lastobx and prevlastosx < lastobx then
    lasty1=y1
    x1=phx[1]
    y1=ph[1]
    drawpoint(x1,y1,2)coloured("red")
    drawsegment(x1,y1,x2,y2)coloured("blue")style(dottedline)
    if lasty1 > y1 then
    drawtext("LH",x1,y1+0.5*tr)coloured("red")
    else
    drawtext("HH",x1,y1+0.5*tr)coloured("red")
    endif
    endif
    endif
    //---Check after exit overbought state
    if isOverbought[1] and not isOverbought then
    prevlastobx=lastobx//keep the previous pivot barindex
    lastobx=phx//set the new pivot barindex
    //---Draw only if is the last low
    if lastobx>lastosx and prevlastobx < lastosx then
    lasty2=y2
    x2=plx[1]
    y2=pl[1]
    drawpoint(x2,y2,2)coloured("green")
    drawsegment(x2,y2,x1,y1)coloured("blue")style(dottedline)
    if lasty2 > y2 then
    drawtext("LL",x2,y2-0.5*tr)coloured("green")
    else
    drawtext("HL",x2,y2-0.5*tr)coloured("green")
    endif
    endif
    endif
    //--------------------------------------------------------------//
    //-----Draw the last segment------------------------------------//
    if islastbarupdate then
    if x1 > x2 then
    drawsegment(x1,y1,plx,pl)coloured("blue")style(dottedline)
    else
    drawsegment(x2,y2,phx,ph)coloured("blue")style(dottedline)
    endif
    endif
    //--------------------------------------------------------------//
    return
    
    #231837 quote
    maxlys
    Participant
    Senior

    Bonjour

    Merci pour le retour rapide.

    J’ai installé l’indicateur sur PRT Temps réel ( et aussi fin de journée), sur plusieurs sous jacents contrairement a TV le dernier low ou Hi ne s’affiche pas.

    pour quelle raison ? (voir photo jointe)

    Merci

    #231840 quote
    Iván González
    Moderator
    Master

    Bonjour Il n’est pas affiché car il n’a pas encore été réellement généré. C’est pour cette raison qu’il n’est pas étiqueté. Dans le code TV, ils l’ont mis à titre provisoire, mais j’ai choisi de ne pas le mettre car c’est trompeur. Comme vous pouvez le voir sur le graphique, la ligne bleue en pointillés le marque, mais elle ne le marque pas.

    Si vous souhaitez l’ajouter, vous pouvez le faire en suivant la même logique que dans les lignes de code où la balise est placée.

    #231843 quote
    maxlys
    Participant
    Senior

    OK merci pour l’information.

    Cet indicateur dans TV repeint donc ?

    pour vous il s’affiche a quel moment ? Après x bougies ?


    Merci

    #231852 quote
    Iván González
    Moderator
    Master

    Les étiquettes sont affichées lorsque les conditions des lignes de code 44 ou 62 sont remplies. Il n'y a pas de nombre défini de bougies, car elles dépendent du fait que le stock soit suracheté ou survendu.

Viewing 8 posts - 1 through 8 (of 8 total)
  • You must be logged in to reply to this topic.

Conversion code RSI SWING de TV


ProBuilder : Indicateurs & Outils Personnalisés

New Reply
Author
author-avatar
maxlys @maxlys Participant
Summary

This topic contains 7 replies,
has 2 voices, and was last updated by Iván González
1 year, 9 months ago.

Topic Details
Forum: ProBuilder : Indicateurs & Outils Personnalisés
Language: French
Started: 04/19/2024
Status: Active
Attachments: 2 files
Logo Logo
Loading...