

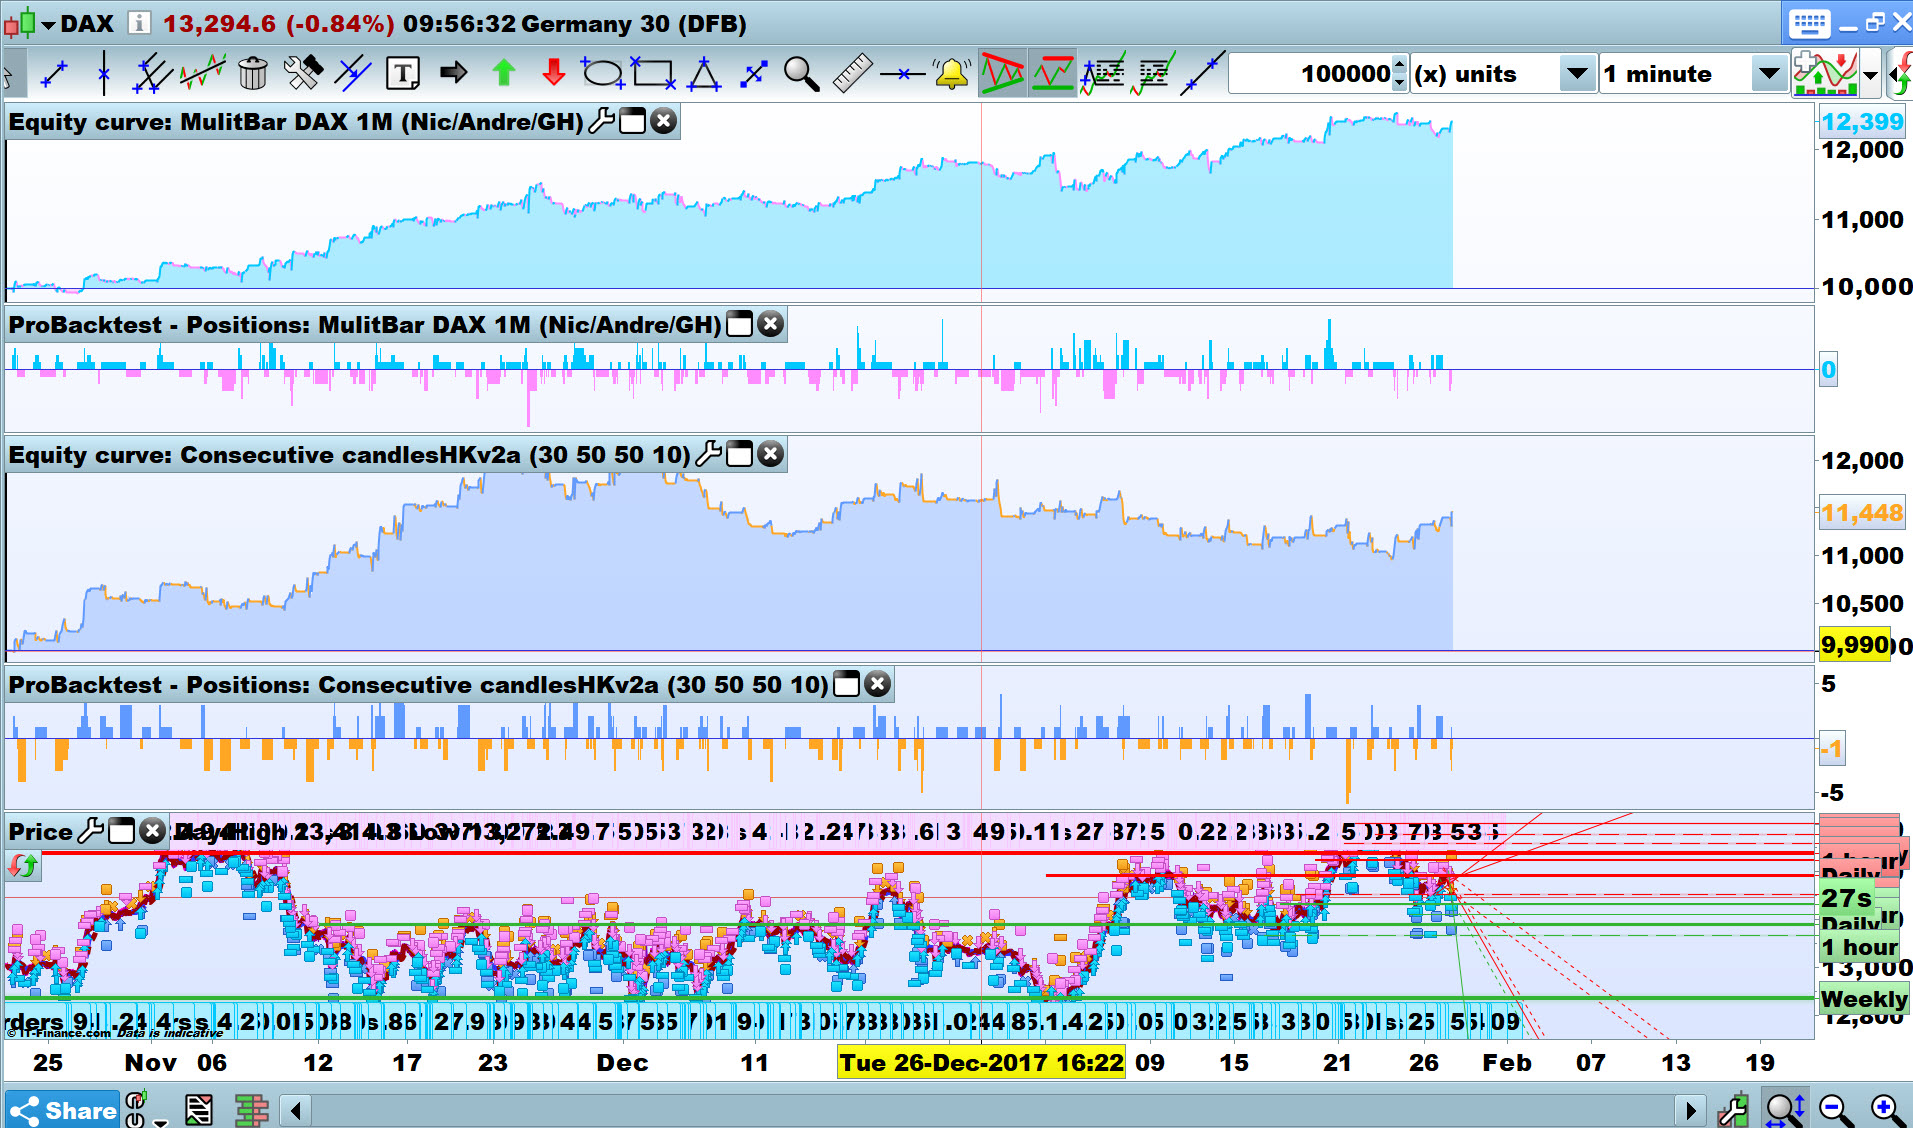
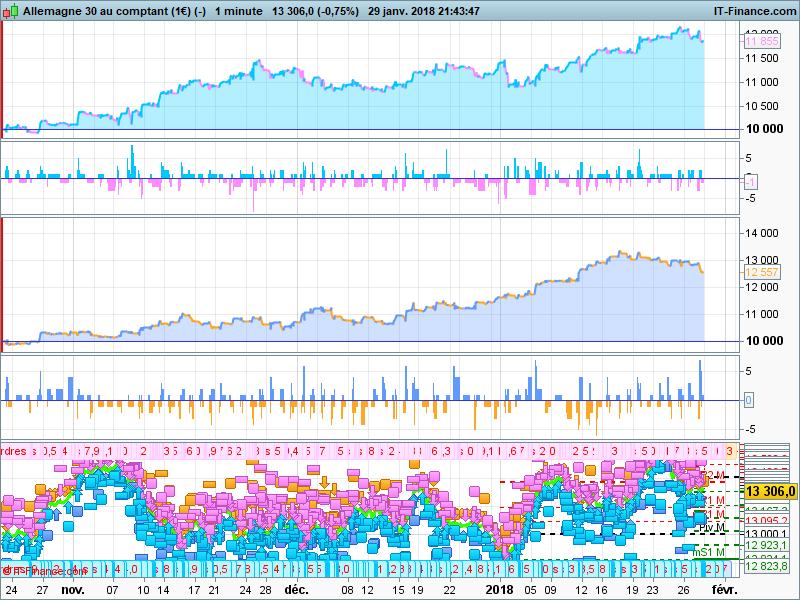
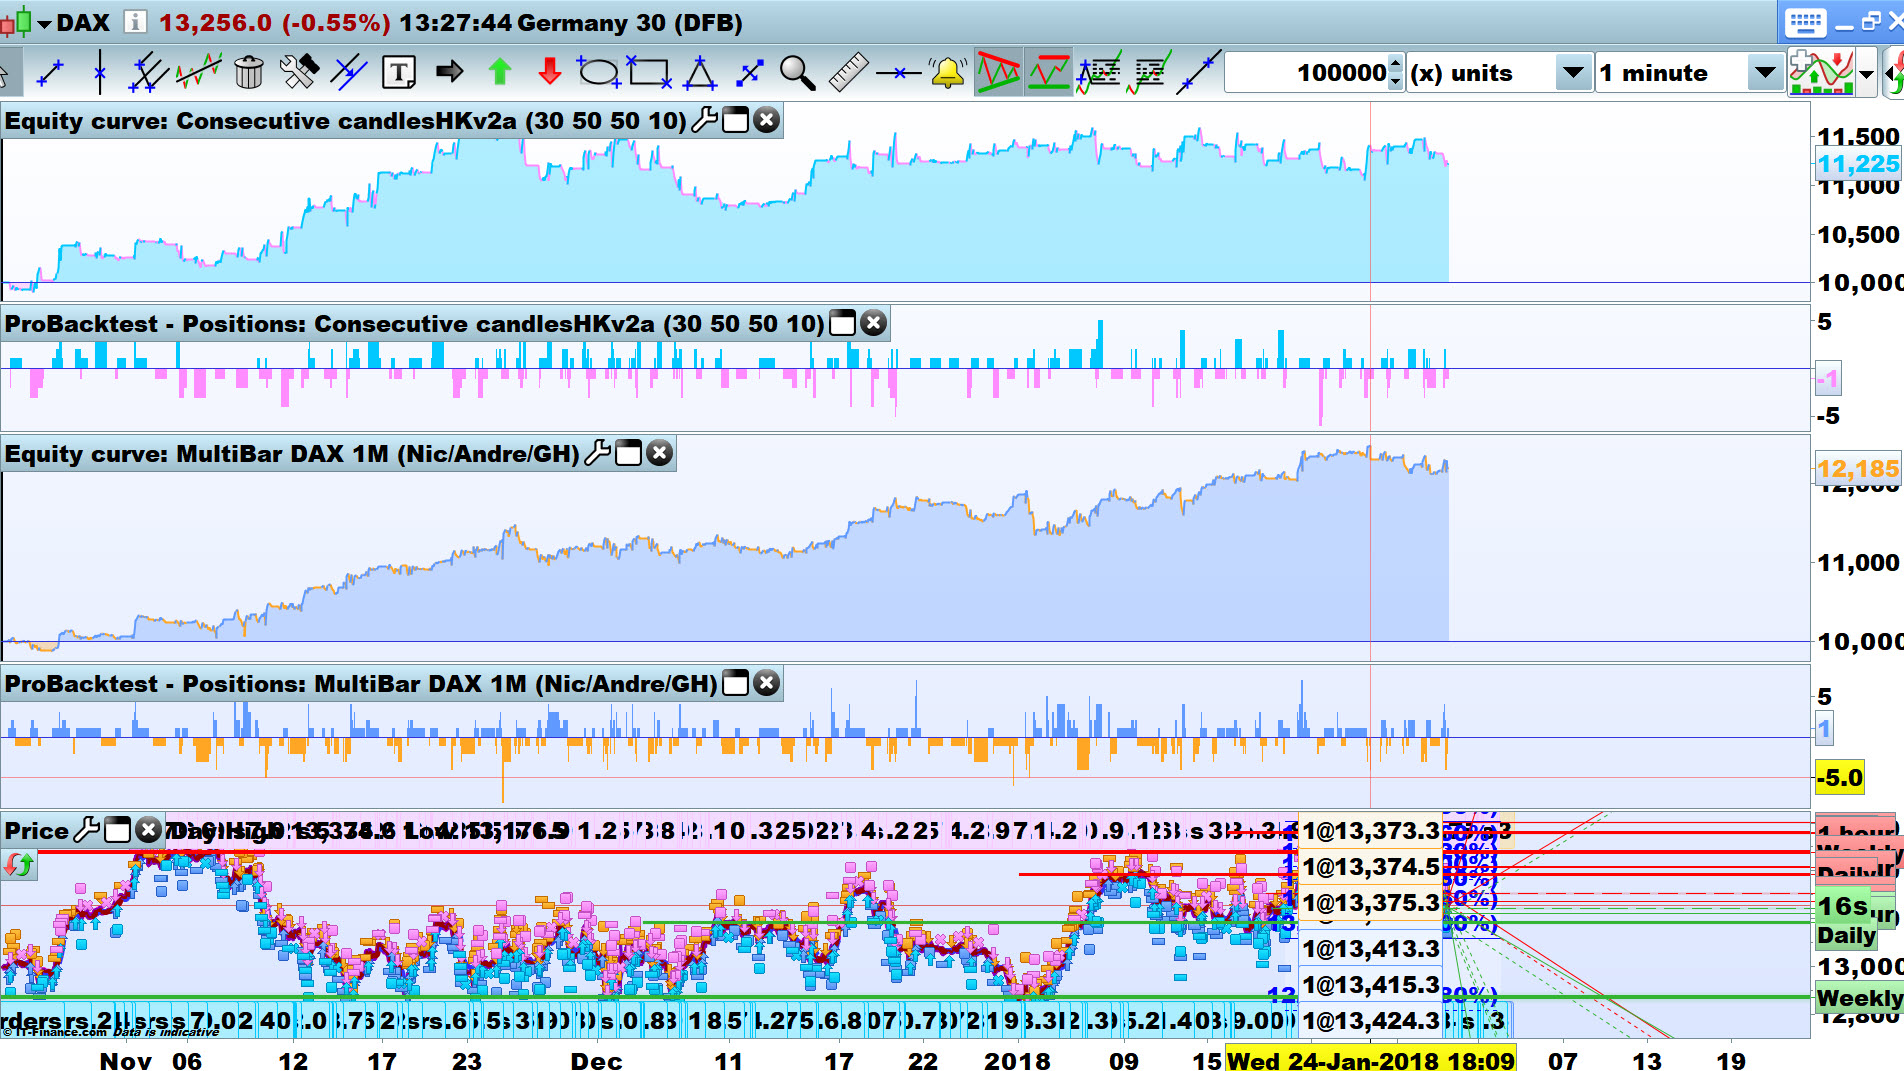
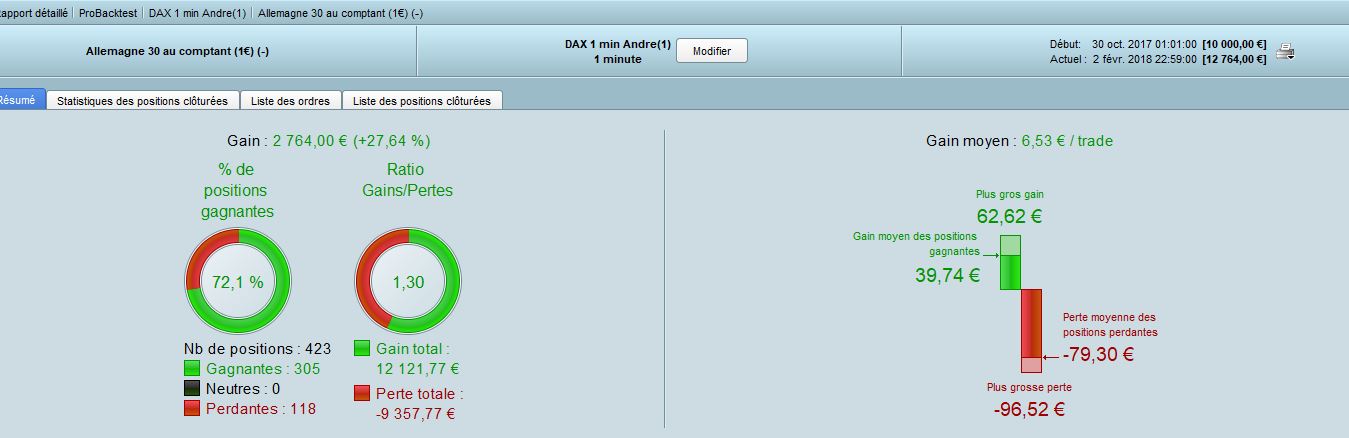
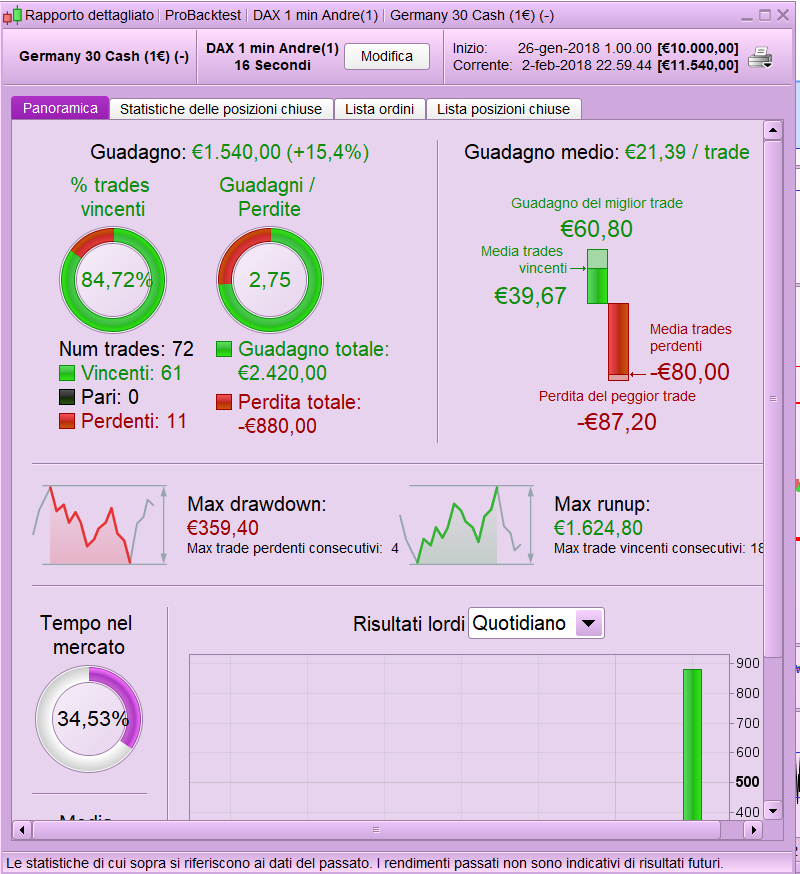
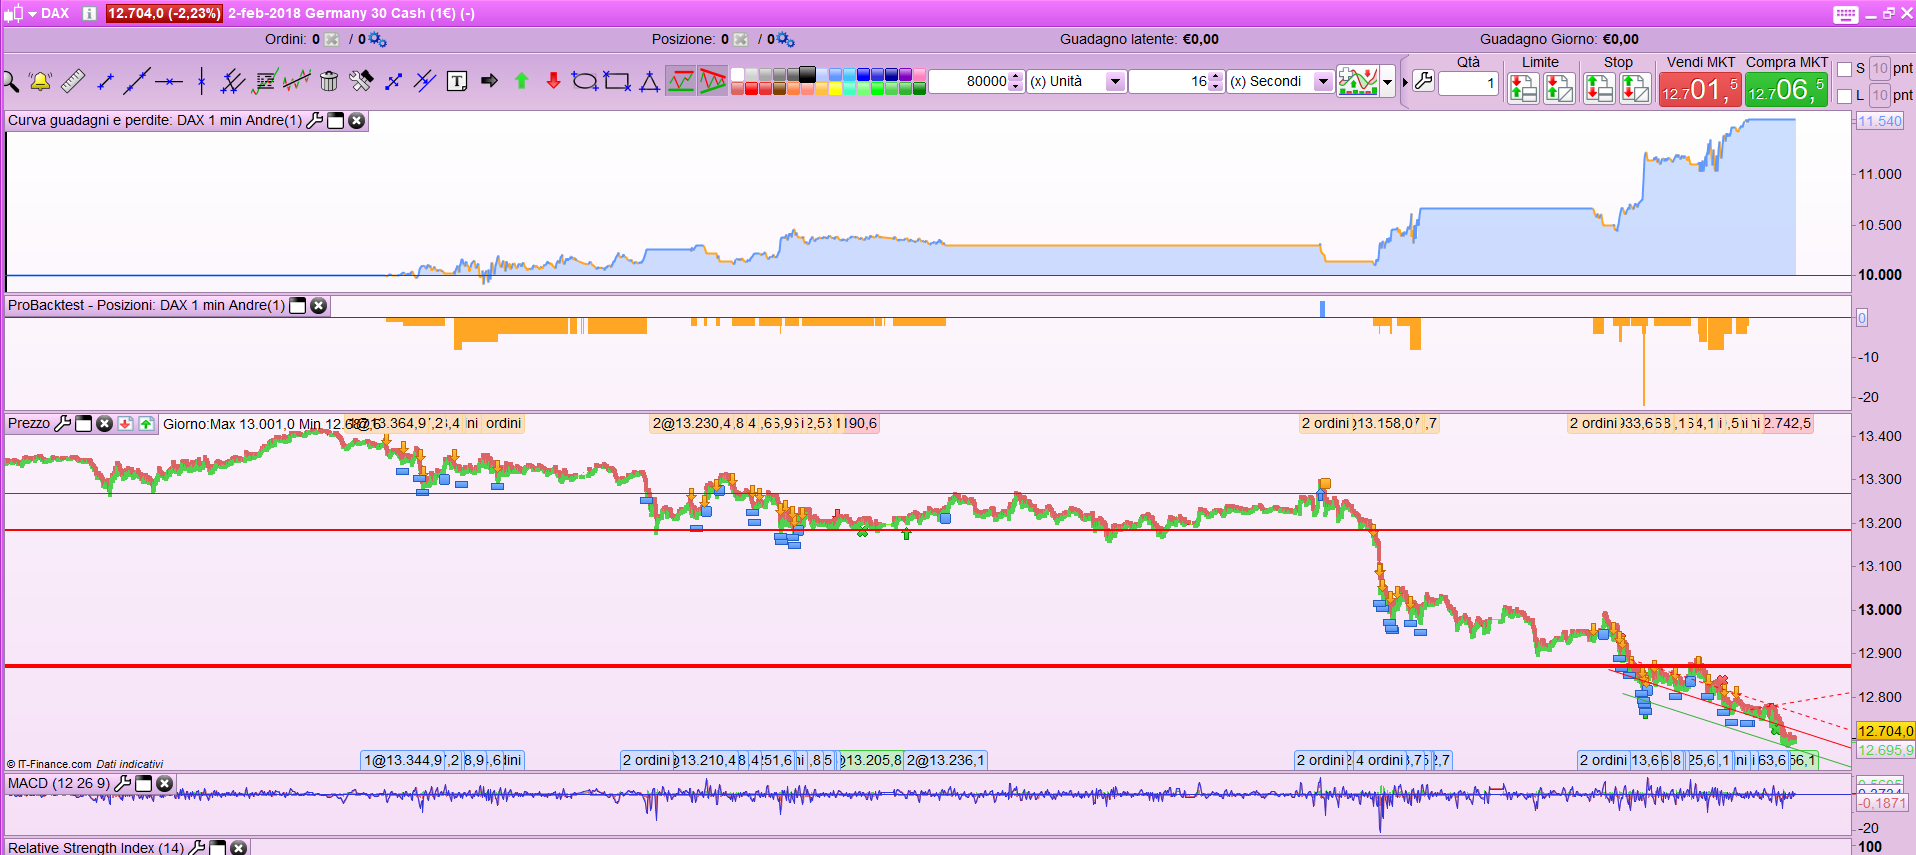
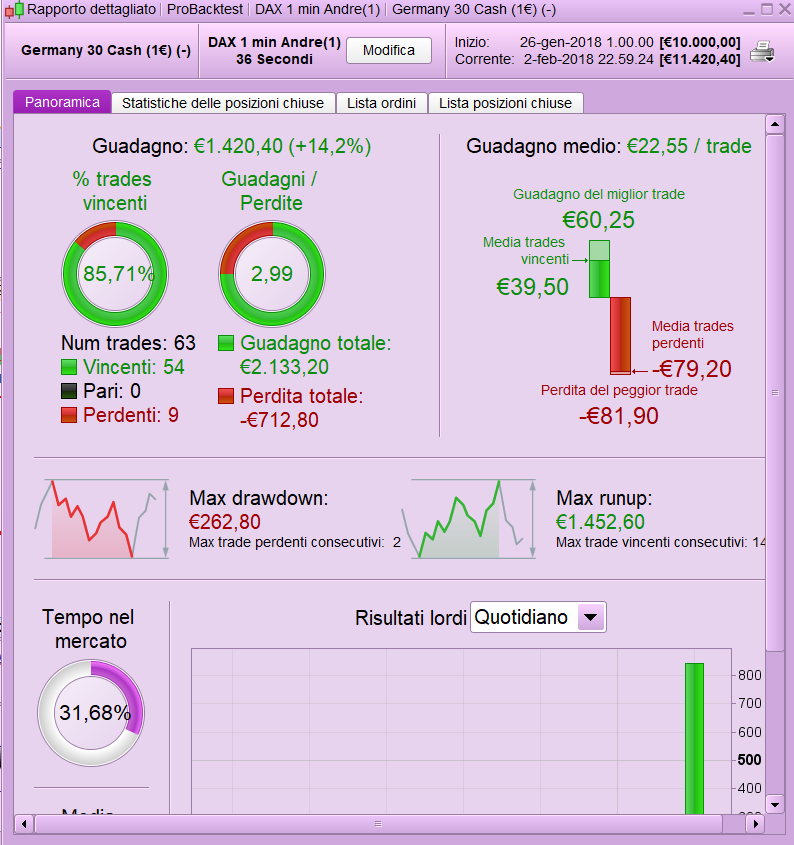
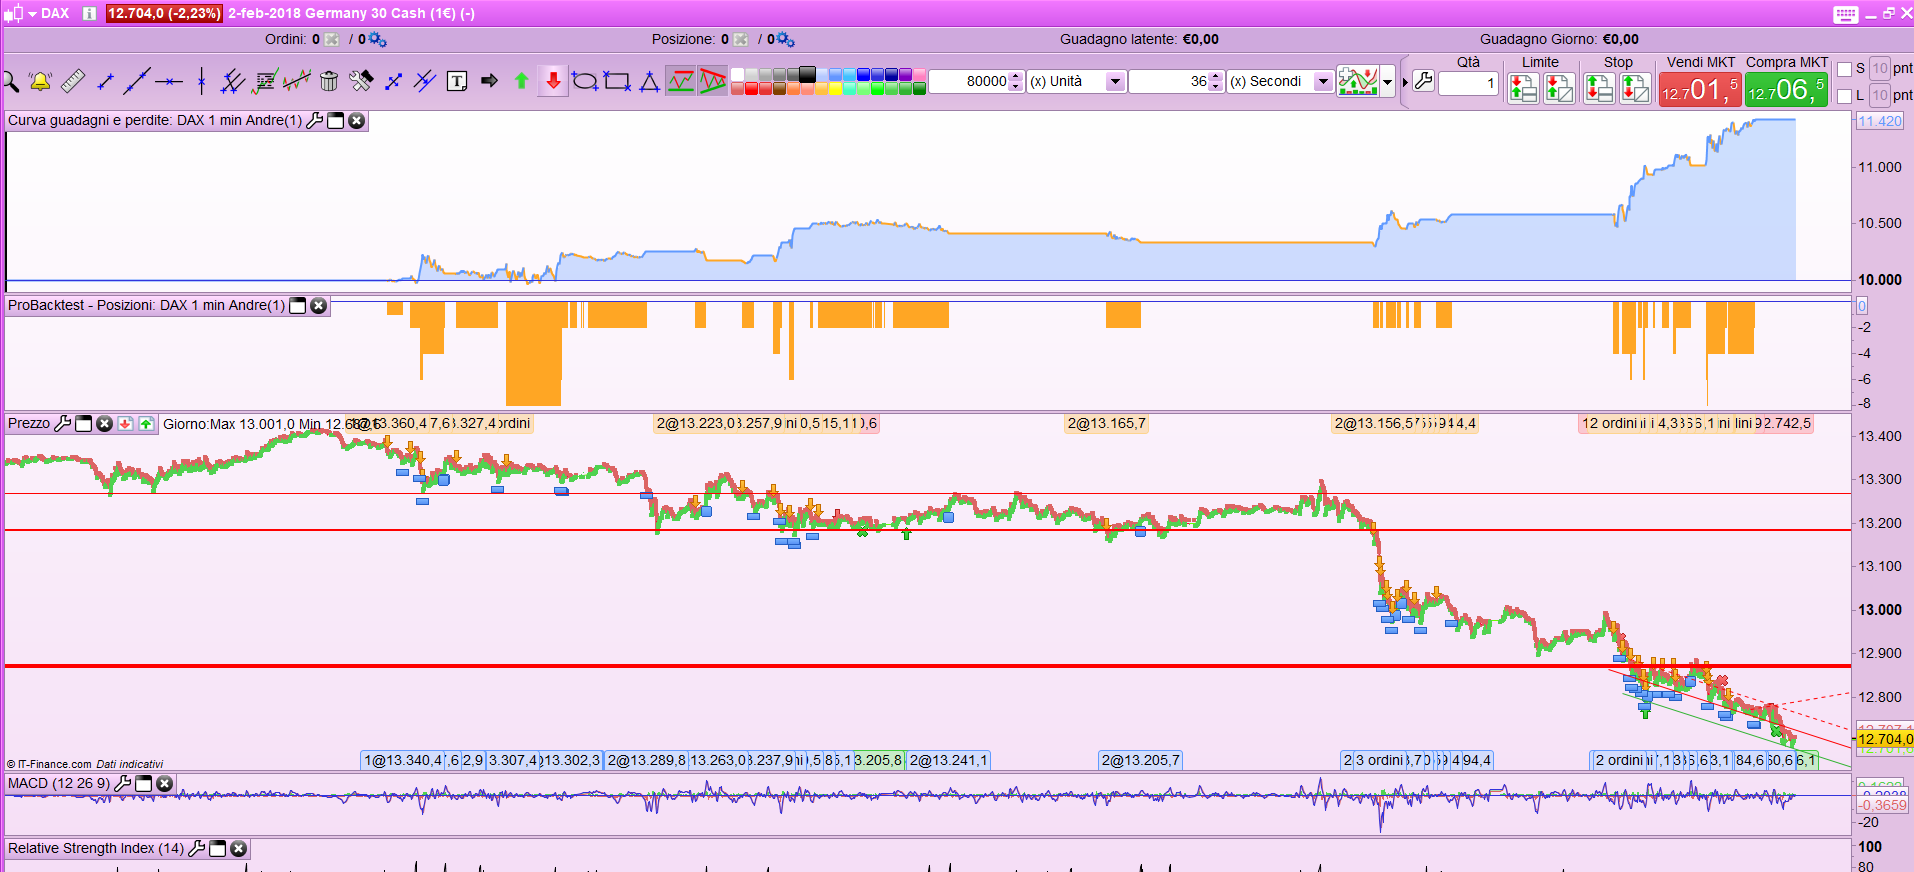
Consecutive bullish or bearish candlesticks – DAX
- You must be logged in to reply to this topic.
New Reply

Author
Summary
This topic contains 26 replies,
has 6 voices, and was last updated by ![]()
8 years, 1 month ago.
Topic Details
| Forum: | ProOrder: Automated Strategies & Backtesting |
| Language: | English |
| Started: | 01/18/2018 |
| Status: | Active |
| Attachments: | 23 files |
Loading...