Bonjour,
Merci de m’aider si vous avez un petit moment.
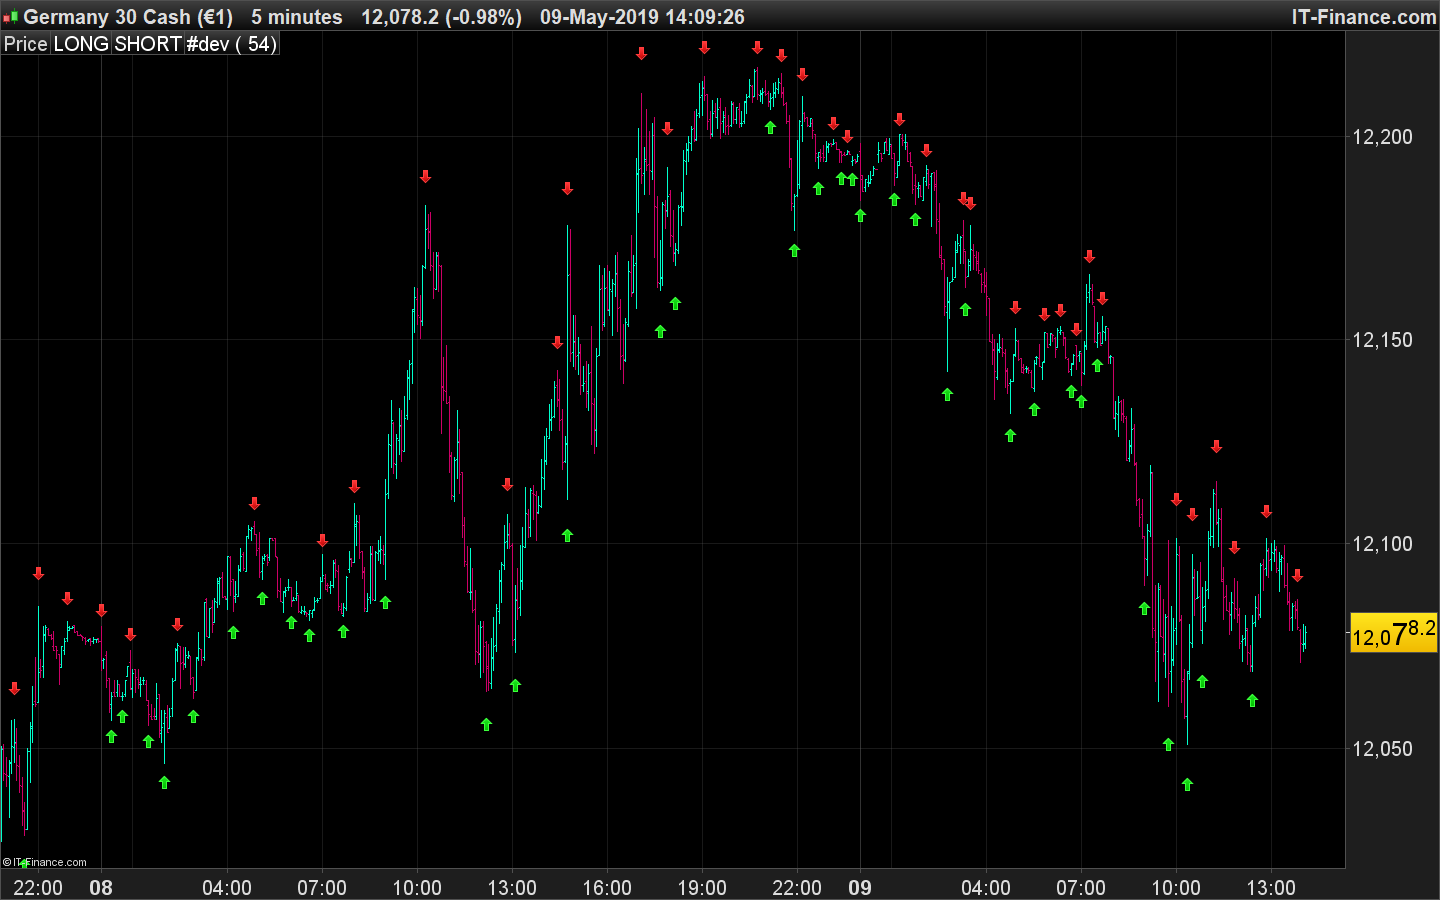
Dans le code ci-dessous les signaux se font sous forme d’histogramme, quelles modifications apportées pour que les signaux apparaissent sous forme de flèche sur le graphique de prix ? Merci d’avance.
Vincent
once rr=1
mb=average[20](typicalprice)
k=48
n=(k*2)-4
p=(n/2)-1

h1=DPO[n](high)

moyh=high-h1
hi=(moyh-moyh[1]+(high[p])/n)*n
hi=(round(hi*100))/100
l1=dpo[n](low)

moyl=low-l1
lo=(moyl-moyl[1]+(low[p])/n)*n
lo=(round(lo*100))/100
clo1=dpo[n](close)

moyc=close-clo1
clot=(moyc-moyc[1]+(close[p])/n)*n
clot=(round(clot*100))/100
cond1=(high>high[1] and high>high[2])
cond2=(cond1 and high>hi[46]) and (barindex>bari or rr=-1)
if cond1 and cond2 then
flagg=1
targeth=high
targetl=lo[46]
else
flagg=0
signa=mb
endif
for zz=0 to 45
if clot[45-zz]<targetl and hi[45-zz]<=targeth and flagg=1  then
signa=high+(averagetruerange[20](close))*.5
rr=1
bari=barindex+zz+2
break
elsif     hi[45-zz]>targeth then
signa=mb
break
endif
next
condi=(low<low[1] and low<low[2]) and low<lo[46] and (barindex>bar or rr=1)
if condi then
fflag=1
target1=low
target2=hi[46]
else
fflag=0
siigna=mb
endif
for kk=0 to 45
if clot[45-kk]>target2 and lo[45-kk]>=target1 and fflag=1 then
siigna=low-(averagetruerange[20](close))*.5
rr=-1
bar=barindex+kk+2
break
elsif lo[45-kk]<target1 then
siigna=mb
break
endif
next
if barindex < 100 then
signa=undefined
siigna=undefined
endif
golong = (siigna < mb)
goshort = (signa > mb)*-1
return golong as  "LONG",goshort as "SHORT",0
Voir la fin du code, l’utilisation des instructions DRAWARROWUP et DRAWARROWDOWN. Si tes variables golong ou goshort sont différentes de zéro alors on affiche des flèches au dessus ou en dessous de la bougie.
once rr=1
mb=average[20](typicalprice)
k=48
n=(k*2)-4
p=(n/2)-1

h1=DPO[n](high)

moyh=high-h1
hi=(moyh-moyh[1]+(high[p])/n)*n
hi=(round(hi*100))/100
l1=dpo[n](low)

moyl=low-l1
lo=(moyl-moyl[1]+(low[p])/n)*n
lo=(round(lo*100))/100
clo1=dpo[n](close)

moyc=close-clo1
clot=(moyc-moyc[1]+(close[p])/n)*n
clot=(round(clot*100))/100
cond1=(high>high[1] and high>high[2])
cond2=(cond1 and high>hi[46]) and (barindex>bari or rr=-1)
if cond1 and cond2 then
flagg=1
targeth=high
targetl=lo[46]
else
flagg=0
signa=mb
endif
for zz=0 to 45
if clot[45-zz]<targetl and hi[45-zz]<=targeth and flagg=1  then
signa=high+(averagetruerange[20](close))*.5
rr=1
bari=barindex+zz+2
break
elsif     hi[45-zz]>targeth then
signa=mb
break
endif
next
condi=(low<low[1] and low<low[2]) and low<lo[46] and (barindex>bar or rr=1)
if condi then
fflag=1
target1=low
target2=hi[46]
else
fflag=0
siigna=mb
endif
for kk=0 to 45
if clot[45-kk]>target2 and lo[45-kk]>=target1 and fflag=1 then
siigna=low-(averagetruerange[20](close))*.5
rr=-1
bar=barindex+kk+2
break
elsif lo[45-kk]<target1 then
siigna=mb
break
endif
next
if barindex < 100 then
signa=undefined
siigna=undefined
endif
golong = (siigna < mb)
goshort = (signa > mb)*-1
atr=AverageTrueRange[14](close)
if golong<>0 then
drawarrowup(barindex,low-atr/2) coloured(0,200,0)
endif
if goshort<>0 then
drawarrowdown(barindex,high+atr/2) coloured(200,0,0)
endif

return golong as  "LONG",goshort as "SHORT",0
Cool merci… Ca fait déjà 2 fois que tu m’aides, c’est vraiment sympa d’avoir pris du temps.
Merci beaucoup 😉
Bonjour Nicolas,
Je t’avais remercié avant même de tester ce que tu avais fait. Donc pas de souci je trouve ça déjà super sympa que vous aidiez comme ça gratuitement.
Mais après test ça ne marche pas… alors j’ai cherché mais bien sûr j’ai pas trouvé, je te remets un code plus simple, juste un surachat survente rsi mais avec le même bout de code que tu m’avais fait… normalement je devrais avoir des flèches qui s’affichent mais toujours pas… Est-ce que toi tu vois où se situe le problème ?
Merci
RSI14 = RSI[14](close)
condition1 = RSI14 > 70
condition2 = RSI14 < 30

// Conditions rsi

IF condition1 THEN
ACHAT1 = 1
else
ACHAT1 = 0

ENDIF

IF condition2 THEN
VENTE1 = -1
ELSE
vente1 = 0
ENDIF

if ACHAT1<>0 then
drawarrowup(barindex,low/2) coloured(0,200,0)
endif

if vente1<>0 then
drawarrowdown(barindex,high/2) coloured(200,0,0)
endif

return ACHAT1 as "ACHAT1", VENTE1 as "VENTE1",0
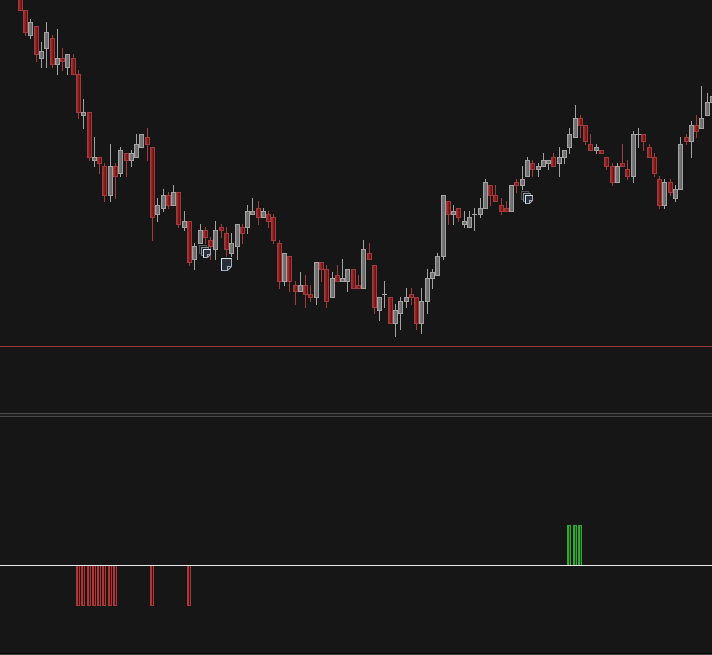
Tes flèches sont mal placées, tu les mets à 1/2 du Low ou du High, c’est qui est hors champ de vision puisque ces valeurs en prix sont trop faibles !
Une solution assez utilisée c’est d’ajouter une taille en point fixe ou un multiple de l’ATR:
drawarrowup(barindex,low-averagetruerange[14]*1.5) coloured(0,200,0)
Ben je dois vraiment être à côté de la plaque… je comprends pas du tout, j’ai remplacé le code par le tien et ça ne fonctionne toujours pas. Je te joins le code et copie d’écran.
Sincèrement désolé Nicolas…
Et encore merci
RSI14 = RSI[14](close)
condition1 = RSI14 > 70
condition2 = RSI14 < 30

// Conditions rsi

IF condition1 THEN
ACHAT1 = 1
else
ACHAT1 = 0

ENDIF

IF condition2 THEN
VENTE1 = -1
ELSE
vente1 = 0
ENDIF

if ACHAT1<>0 then
drawarrowup(barindex,low-averagetruerange[14]*1.5) coloured(0,200,0)
endif

if vente1<>0 then
drawarrowdown(barindex,high-averagetruerange[14]*1.5) coloured(0,200,0)
endif

return ACHAT1 as "ACHAT1", VENTE1 as "VENTE1",0
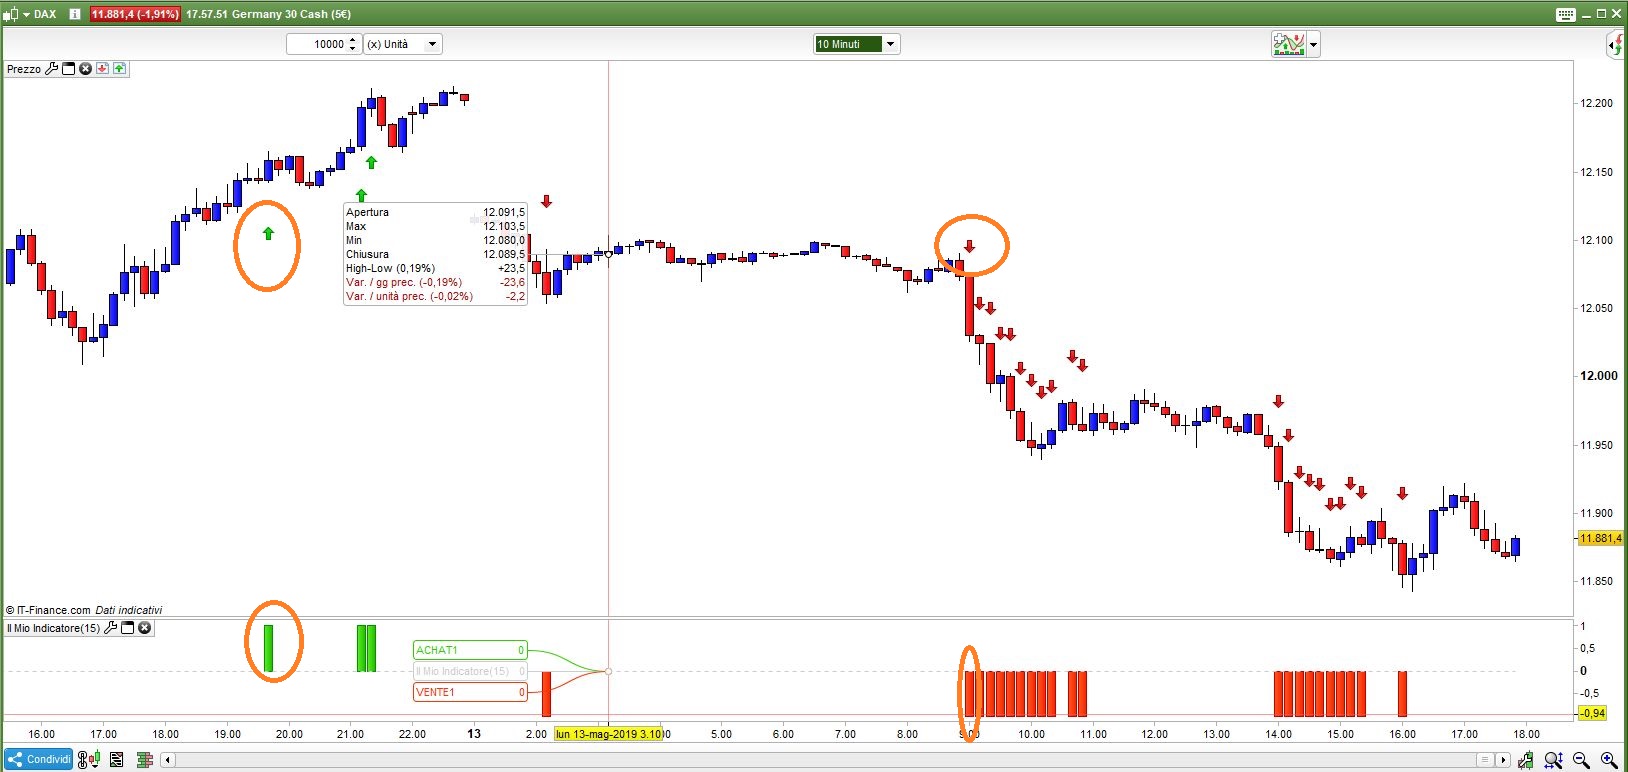
Si vous utilisez la valeur 0, ou 1 ou -1, vous verrez que la ligne est bien loin du prix actuel, disons que DAX est 11900 et que vous voulez en voir 1 !!! Il sera affiché bien en dessous comme une ligne plate !!!! Cela devrait faire:
RSI14 = RSI[14](close)
condition1 = RSI14 > 70
condition2 = RSI14 < 30
// Conditions rsi
IF condition1 THEN
   ACHAT1 = 1
else
   ACHAT1 = 0
ENDIF
IF condition2 THEN
   VENTE1 = -1
ELSE
   vente1 = 0
ENDIF
if ACHAT1<>0 then
   drawarrowup(barindex,low-averagetruerange[14]*1.5) coloured(0,200,0)
elsif vente1<>0 then
   drawarrowdown(barindex,high+averagetruerange[14]*1.5) coloured(200,00,0)
endif
return// ACHAT1 as "ACHAT1", VENTE1 as "VENTE1",0
de plus, c’est HIGH + , pas ” high- ” pour tirer les flèches vers le bas. J’ai aussi changé de couleur.
Vous pouvez conserver deux versions différentes du même indicateur, l’une pour tracer un histogramme au-dessous du tableau des prix et l’autre pour tracer des flèches au-dessus du tableau des prix.
D’abord merci Roberto d’avoir pris du temps c’est sympa…
Bon sinon c’est un truc de fou cette histoire, j’ai juste fait un copié collé du code que vous m’avez repris et corrigé et je n’ai toujours rien. Je vous fait passer le graph du dow en UT 1 minute + le code que j’ai copié collé… Désespérant… juste pour avoir besoin d’afficher des flèches je comprend pas que je galère autant alors qu’apparemment il suffisait juste de copier votre code. Si vous avez une réponse je suis preneur sinon tant pis je laisserai tomber… pas grave.
Merci quand même.
RSI14 = RSI[14](close)
condition1 = RSI14 > 70
condition2 = RSI14 < 30
// Conditions rsi
IF condition1 THEN
ACHAT1 = 1
else
ACHAT1 = 0
ENDIF
IF condition2 THEN
VENTE1 = -1
ELSE
vente1 = 0
ENDIF
if ACHAT1<>0 then
drawarrowup(barindex,low-averagetruerange[14]*1.5) coloured(0,200,0)
elsif vente1<>0 then
drawarrowdown(barindex,high+averagetruerange[14]*1.5) coloured(200,00,0)
endif
return// ACHAT1 as "ACHAT1", VENTE1 as "VENTE1",0
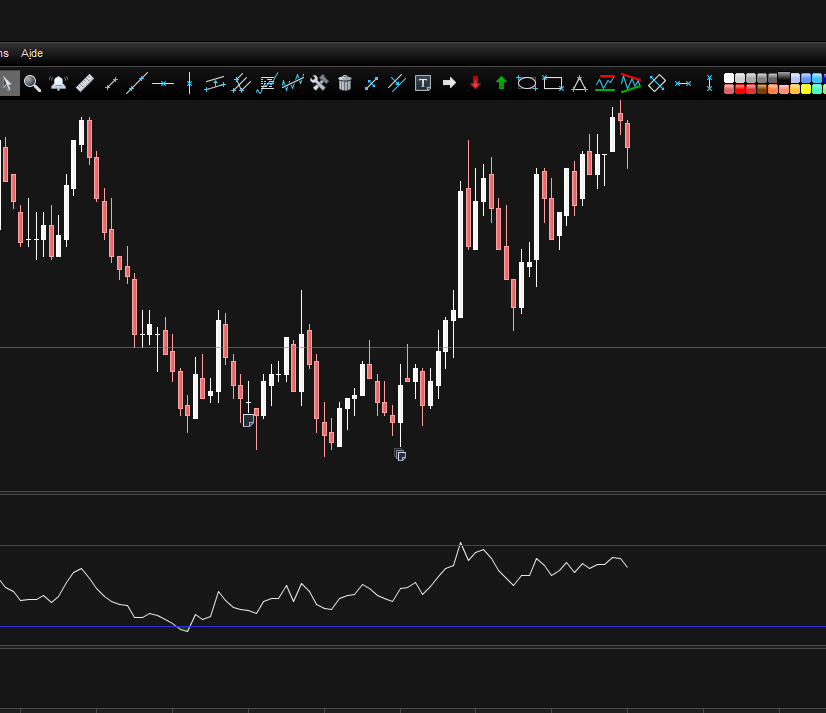
Je suppose que vous installez votre indicateur au-dessous de votre graphique, au lieu de sur votre graphique.
Vous devez cliquer sur la clé à molette située à côté de l’étiquette de prix dans le coin supérieur gauche de votre graphique, puis ajouter l’indicateur en le sélectionnant dans la liste déroulante.
Bien vu Roberto !!!
Je suis vraiment trop bête… c’était ça le problème et je n’y avais pas du tout pensé. Je trade avec une autre plateforme d’habitude et je commence juste avec PRT donc pas encore bien habitué.
En tout un TRES GRAND MERCI !!!
C’est vraiment super sympa j’apprécie que vous passiez du temps comme ça pour aider les débutants comme nous c’est cool !
Encore merci et bonne soirée.
Vincent
C’est très gentil de votre part, merci. Ne pas savoir quelque chose parce que vous êtes nouveau sur PRT ne vous rend pas stupide.
C’était la même chose pour moi il y a trois ans. Nicolas a dû travailler dur pour me faire savoir beaucoup de choses (comme celle de la clé).
Tout le monde ici est encouragé à aider ceux qui ont besoin d’aide. Amusez-vous bien dans le trading!
Merci encore, c’est que j’essaie de me mettre à PRT et au codage en même temps, c’est vraiment passionnant le codage mais ça ne tolère pas les approximations. Donc il va falloir du temps pour y arriver un peu plus tout seul.
A bientôt Roberto
Bonjour, Je suis nouveau sur PRT et je cherche des signaux Long. Votre indicateur semble sur-perfomer d’autres que jai pu trouver ici et là, au moins sur des Small Caps cotées sur Euronext. Merci pour ce partage.
Sur quelle unité de temps votre indicateur fonctionne-t-il le mieux?
Résultats backtests?
Merci encore
Re-bonjour, auriez-vous un scanner pour détécter les signaux Long / Short qui foncontionnerait avec votre indicateur?
Merci
Khaled