Bonjour,
j’ai programmé un petit indicateur :
// Distance moyenne cours / KAMA50

Period = 50
FastPeriod = 2
SlowPeriod = 30

Fastest = 2 / (FastPeriod + 1)
Slowest = 2 / (SlowPeriod + 1)
if barindex < Period+1 then
Kama=close
else
Num = abs(close-close[Period])
Den = summation[Period](abs(close-close[1]))
ER = Num / Den
Alpha = SQUARE(ER *(Fastest - Slowest )+ Slowest)
KAMA = (Alpha * Close) + ((1 -Alpha)* Kama[1])
endif


avg = kama


if close > avg then
distanceup = abs(close - avg)
endif

if close < avg then
distancedown = abs(close - avg)
endif

a = average[50](distanceup)
b = average[50](distancedown)


return avg+A as "borne haute", avg-b as "borne basse"
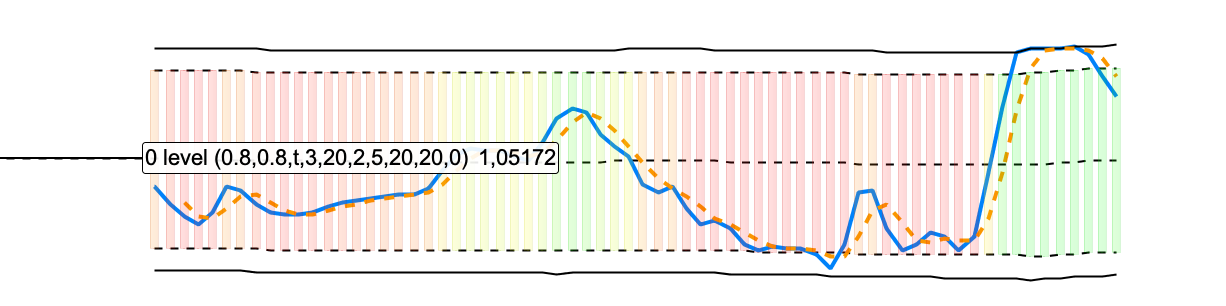
La couleur de remplissage de l’indicateur (qui est une forme de bandeau) se fait par la fonction “remplissage” de PRT. Mais j’aimerai en fait que la couleur de chaque UT soit liée à un autre indicateur (par ex un STO ou autre). Est-ce possible avec la fonction “Drawcandle” (J’aimerai que le bandeau revêt cette forme identique à la pièce jointe) ? Merci.
Précision : le graphique en pièce jointe est issu du programme suivant (trouvé sur ce site). Merci à l’auteur.
//PRC_OnChart Oscillator | indicator
//23.05.2018
//Nicolas @ www.prorealcode.com
//Sharing ProRealTime knowledge
///////////////////////INDICATOR_UNIVERSAL
maPrice = customclose
bandedge= UniversalPeriod
whitenoise= (maPrice - maPrice[min(UniversalPeriod,UniversalFilter)])/2
if barindex>bandedge then
// super smoother filter
a1= Exp(-1.414 * 3.14159 / bandedge)
b1= 2*a1 * Cos(1.414*180 /bandedge)
c2= b1
c3= -a1 * a1
c1= 1 - c2 - c3
filt= c1 * (whitenoise + whitenoise[1])/2 + c2*filt[1] + c3*filt[1]

filt1 = filt

if ABS(filt1)>pk[1] then
pk = ABS(filt1)
else
pk = 0.991 * pk[1]
endif

if pk=0 then
denom = -1
else
denom = pk
endif

if denom = -1 then
result = result[1]
else
result = filt1/pk
endif
endif

///////////////////////////////////////////////////

dTR = 0
for i = 0to ATRperiod-1
dTR=dTR+max(abs(Dhigh(i)-Dlow(i)),max(abs(Dhigh(i)-Dclose(i+1)),abs(Dlow(i)-Dclose(i+1))))
next
dtr=dtr/MAX(1,TightenChannel)
avgRange = dTR

maValue = average[max(1,AveragePeriod),AverageMethod](maPrice)

ResultValue = RESULT

Buffer1=maValue
Buffer2=maValue+(avgRange*((overBought)))
Buffer3=maValue-(avgRange*((overSold)))
Buffer4=maValue+(ResultValue)/1*avgRange
Buffer5=maValue+(avgRange*((10/10)))
Buffer6=maValue+(avgRange*((-10/10)))


if UniAvg  then
UniAvgline=Average[UniAvgPeriod](buffer4)
ELSE
UniAvgline=UNDEFINED
endif

MyUNI = result
R = 50+(200-MyUNI*400)
G =50+(200+MyUNI*500)

DRAWCANDLE(Buffer2, Buffer3, Buffer2, Buffer3)coloured(R,G,0,40)

return Buffer1 coloured(0,0,0) style(dottedline,1) as "0 level", Buffer2 coloured(0,0,0) style(dottedline,1) as "overbought level", Buffer3 coloured(0,0,0) style(dottedline,1) as "oversold level", Buffer4 coloured(0,130,250) style(LINE,2) as "UNIVERSAL VALUE",Buffer5 AS"1 level",Buffer6 AS"-1 level",UniAvgline coloured(250,150,0) style(dottedline,2) AS" UniversalAverage"
Oui c’est possible bien sûr. Si tu ajoutes un DRAWCANDLE qui utilise les valeurs de tes variables “borne haute” et “borne basse”, tu auras le même effet. Après pour le choix des couleurs, c’est toi qui voit, ou alors faudrait me l’expliquer un peu mieux car j’ai rien compris pour le moment 😆
merci. Et bien par exemple, si le MACD est positif, je voudrais que la couleur de “drawcandle” soit bleu (c’est un exemple).
Merci.
Voilà ce que ça pourrait donner avec ta condition sur le MACD, donc tu peux modifier cela à ta convenance maintenant.
// Distance moyenne cours / KAMA50

Period = 50
FastPeriod = 2
SlowPeriod = 30

Fastest = 2 / (FastPeriod + 1)
Slowest = 2 / (SlowPeriod + 1)
if barindex < Period+1 then
Kama=close
else
Num = abs(close-close[Period])
Den = summation[Period](abs(close-close[1]))
ER = Num / Den
Alpha = SQUARE(ER *(Fastest - Slowest )+ Slowest)
KAMA = (Alpha * Close) + ((1 -Alpha)* Kama[1])
endif


avg = kama


if close > avg then
distanceup = abs(close - avg)
endif

if close < avg then
distancedown = abs(close - avg)
endif

a = average[50](distanceup)
b = average[50](distancedown)

imacd = MACD[12,26,9](close)

if imacd>0 then
cr=0
cg=0
cb=255
else
cr=255
cg=0
cb=0
endif
drawcandle(avg+A,avg+A,avg-b,avg-b) coloured(cr,cg,cb,50)

return avg+A as "borne haute", avg-b as "borne basse"
Une question additionnelle : à quoi sert le 50 dans le code couleur ? merci.
Il sert à contrôler la transparence, c’est une valeur comprise entre 0 et 250.