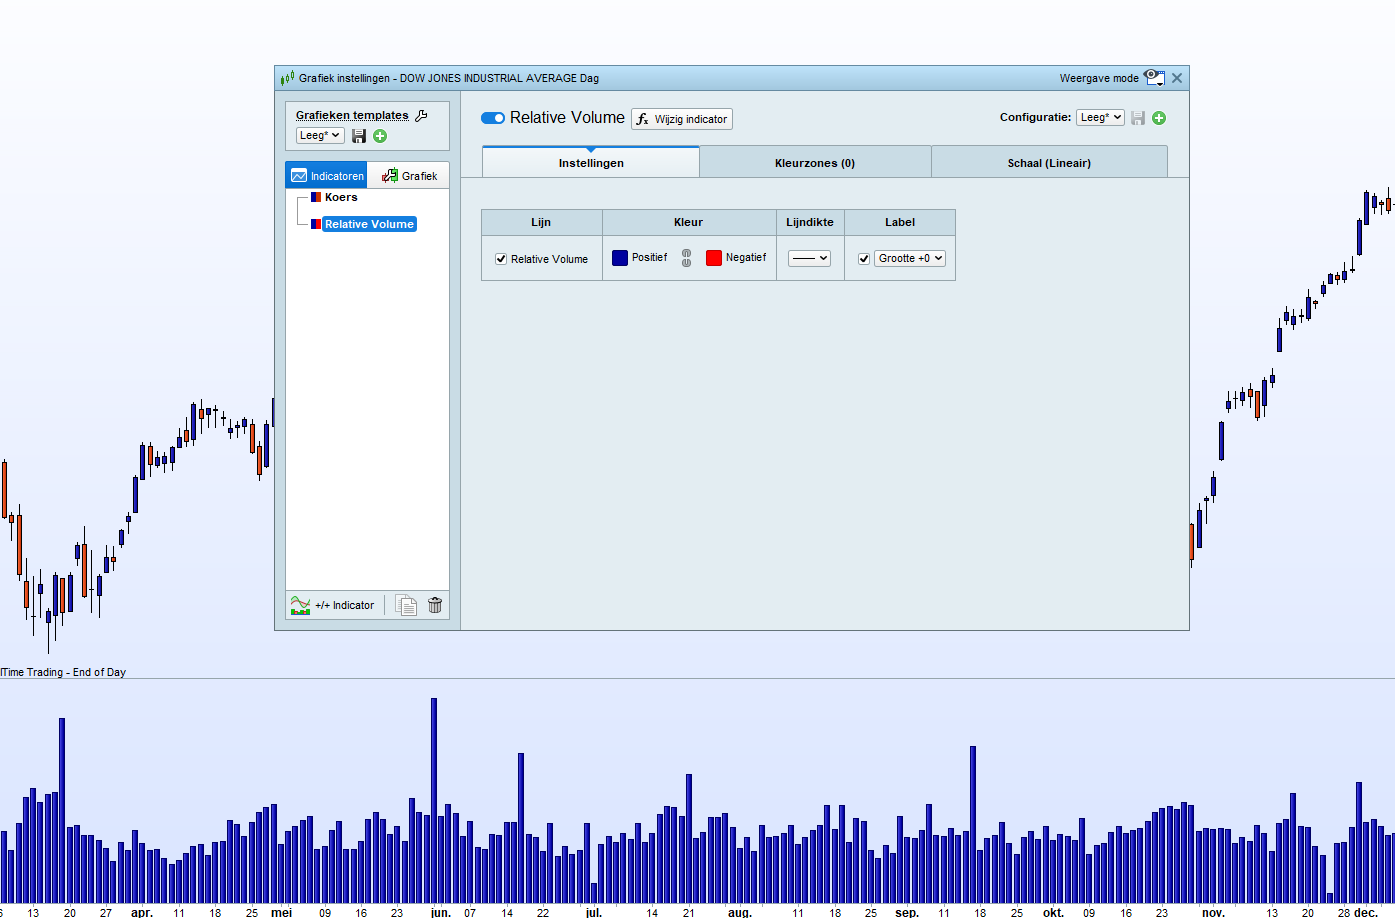
Hi, Some how I cannot manage to color the histogram of the intraday Relative Volume indicator by Nicolas below, into blue for positive and red for negative (attached picture).
Does anybody know which line must be added to the code for this?
//Relative Volume indicator by Nicolas

Period = 21 //X days averaging period

intraindex = intradaybarindex
$ivol[intraindex] = volume

$gvol[barindex] = volume
$gintraindex[barindex] = intraindex

count = 0
sum = 0
for i = barindex downto 0 do
if $gintraindex[i]=intraindex then //found same intraday bar
sum=sum+$gvol[i]
count=count+1
endif
if count=period then
break
endif
next

avg = sum/period
rvol = $ivol[intraindex] / avg

return rvol style(histogram)//$ivol[intraindex], avg coloured(0,0,0)
 JS
JSParticipant
Veteran
Hi Marcel
The values of the indicator are always greater than zero (no negative values) so you can only set the color of the positive values manually.
Here is the code to color the histogram:
//Relative Volume indicator by Nicolas

Period = 21 //X days averaging period

intraindex = intradaybarindex
$ivol[intraindex] = volume

$gvol[barindex] = volume
$gintraindex[barindex] = intraindex

count = 0
sum = 0
for i = barindex downto 0 do
if $gintraindex[i]=intraindex then //found same intraday bar
sum=sum+$gvol[i]
count=count+1
endif
if count=period then
break
endif
next

avg = sum/period
rvol = $ivol[intraindex] / avg

If rvol>rvol[1] then
R=0
G=255
B=0
ElsIf rvol<rvol[1] then
R=255
G=0
B=0
EndIf


return rvol style(histogram)Coloured(R,G,B)//$ivol[intraindex], avg coloured(0,0,0)
JSParticipant
Veteran
into blue for positive and red for negative 🙂
//Relative Volume indicator by Nicolas

Period = 21 //X days averaging period

intraindex = intradaybarindex
$ivol[intraindex] = volume

$gvol[barindex] = volume
$gintraindex[barindex] = intraindex

count = 0
sum = 0
for i = barindex downto 0 do
if $gintraindex[i]=intraindex then //found same intraday bar
sum=sum+$gvol[i]
count=count+1
endif
if count=period then
break
endif
next

avg = sum/period
rvol = $ivol[intraindex] / avg

If rvol>rvol[1] then
R=0
G=0
B=255
ElsIf rvol<rvol[1] then
R=255
G=0
B=0
EndIf


return rvol style(histogram)Coloured(R,G,B)//$ivol[intraindex], avg coloured(0,0,0)
Thanks JS,
I have adjusted your idea for the code slightly to my original idea, so that the colors now correspond to the colors of the candles. This works a bit easier for me because I have built a screener that selects American stocks with RVol >2.
//Relative Volume indicator by Nicolas

Period = 21 //X days averaging period

intraindex = intradaybarindex
$ivol[intraindex] = volume

$gvol[barindex] = volume
$gintraindex[barindex] = intraindex

count = 0
sum = 0
for i = barindex downto 0 do
if $gintraindex[i]=intraindex then //found same intraday bar
sum=sum+$gvol[i]
count=count+1
endif
if count=period then
break
endif
next

avg = sum/period
rvol = $ivol[intraindex] / avg

If open>close then
//If rvol>rvol[1] then
R=204
G=51
B=0
ElsIf open<close then
//ElsIf rvol<rvol[1] then
R=0
G=51
B=153

EndIf


return rvol style(histogram)Coloured(R,G,B)//$ivol[intraindex], avg coloured(0,0,0)
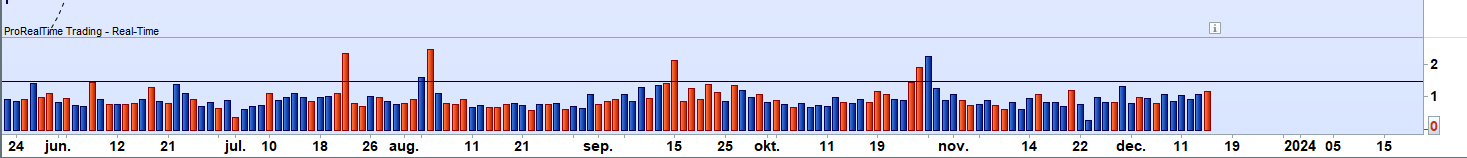
Hi,
Here’s the next hurdle.
It appears that the horizontal line (image) is not held by the indicator as an added indicator or loose line.
This means that every time I open the graph the line has disappeared.
Does anyone know how I can add a solid horizontal line (at 1.5) to the indicator?
//Relative Volume indicator by Nicolas

Period = 21 //X days averaging period

intraindex = intradaybarindex
$ivol[intraindex] = volume

$gvol[barindex] = volume
$gintraindex[barindex] = intraindex

count = 0
sum = 0
for i = barindex downto 0 do
if $gintraindex[i]=intraindex then //found same intraday bar
sum=sum+$gvol[i]
count=count+1
endif
if count=period then
break
endif
next

avg = sum/period
rvol = $ivol[intraindex] / avg

If open>close then
//If rvol>rvol[1] then
R=204
G=51
B=0
ElsIf open<close then
//ElsIf rvol<rvol[1] then
R=0
G=51
B=153

EndIf


return rvol style(histogram)Coloured(R,G,B)//$ivol[intraindex], avg coloured(0,0,0)
JSParticipant
Veteran
Hi Marcel,
If you only want a permanent horizontal line in the indicator, you can add the following line in your code (before “Return”):
DrawHLine(1.5) Coloured(“Red”)