A try to create an Earn & Loss’s indicator
I’m sorry for my bad english, i’ll do my best. Thanks for your understanding
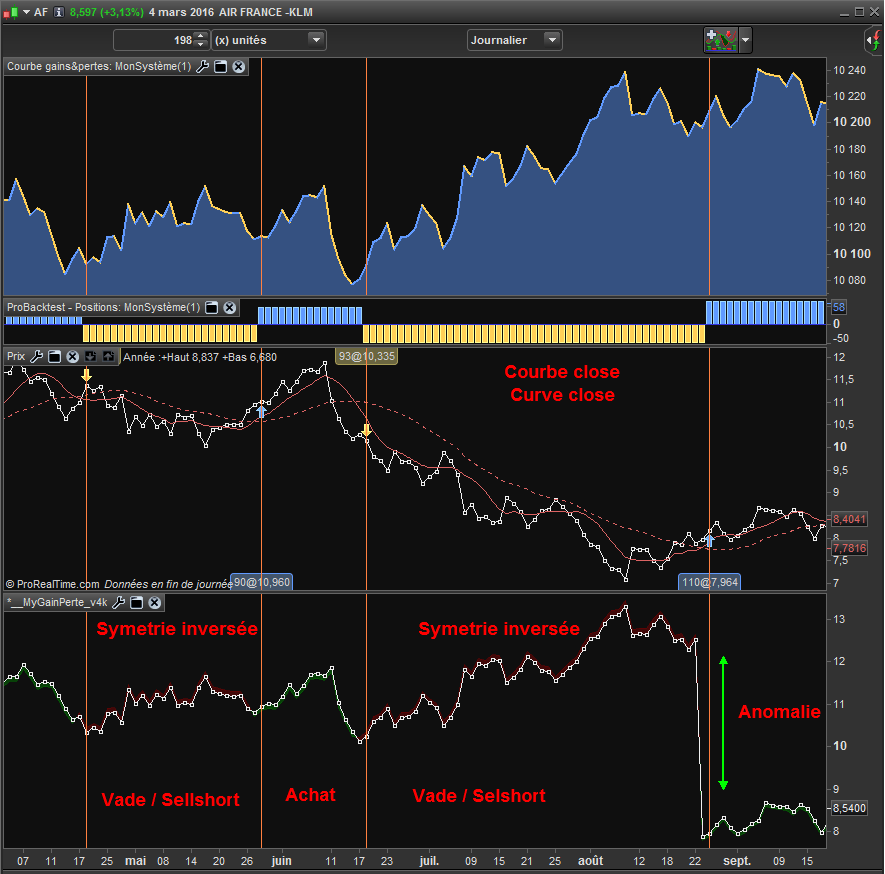
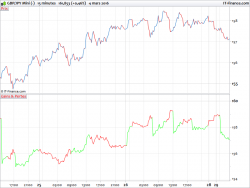
By observing the curve Earnings(Gains) and losses of Prorealtime, I noticed..
– Earnings, it is only the price’ curve which evolve in hight direction , synchronized with a strategy,like a SellShort while the prices evolve in the low direction.
-Losses, it is only a price’symmetry on an axis X (wich must be identified), Buying while the prices evolve in the low direction.
I tried to coding into my thought. The result contains somes anomalies. I need your help to erase thoses anomalies
Best regards
Bonjour
En observant la courbe Gains et pertes de Prorealtime, j’ai constaté..
– les gains, ce n’est que la courbe des prix qui évoluent à la hausse en synchronisation avec une strategie, (une strategie de VADE pendant que les prix evoluent à la baisse)
– les pertes, ce n’est que la symétrie des prix sur un axe X ( à identifier), desynchronisé avec une stratégie (une strategie d’ACHAT pendant que les prix évolue à la baisse).
J’ai tenté de coder dans le sens de cette reflexion. Le résultat comporte des anomalies. Je sollicite votre aide pour corriger les anomalies.
Merci d’avance pour vos contributions
Bien à Vous
/// Exemple: strategie 1 //////////////////////
stk=Stochastic[14,3](close)
if stk crosses over 20 then
position=1
elsif stk crosses under 80 then
position=-1
else
//position=undefined
endif

/// Exemple : strategire 2 //////////////////////
//c1=Average[7](close)
//c2=Average[20](close)
//
//if c1 crosses over c2 then
//position=1
//elsif c1 crosses under c2 then
//position=-1
//else
////position=undefined
//endif

//**************************************************************************//
//                      PROCEDURE                                           //
//**************************************************************************//
GainsPertes=undefined
Color=undefined

///////////////////////   ACHAT  ///////////////////
if position=1 then
cpt=1
Inversion=barindex                   // Mémorise le cours d'inversion
GainsPertes=close[cpt]               // ensuite je bloque dans cette section

//*** couleur de la Position de la strategie : Vert  pour la l'ACHAT  ****
Color=GainsPertes-(GainsPertes *0.01)


/////////////////////   VADE  ///////////////////
elsif position=-1 then
cpt=(barindex-Inversion)             // Nombre de jour depuis le l'Inversion
VarJ=(100-(close/close[cpt])*100)    //
GainsPertes=close[cpt] + (close[cpt]*VarJ/100)

//*** couleur de la Position de la strategie : Rouge pour la VADE  ****
Color=GainsPertes+(GainsPertes *0.01)


/////////////////////   EXCEPTIONS///////////////////

else

endif

///////////////////// Finalement  ///////////////////////////////
RETURN GainsPertes as "Gains & Pertes",Color as "    G & P Color"
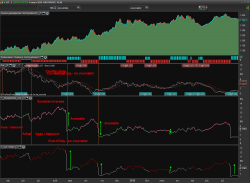
An example of the anomalie.
Hello RicLg,
If you just want to have your profit and loss curve coloured by trade side (long or short), just use my adapted code below. It’s a quickly fix I made, i think that your curve problem came from a non-adapted use of the ‘couloured by’ instruction.
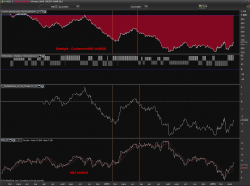
Here is how it looks now :
/// Exemple: strategie 1 //////////////////////
stk=Stochastic[14,3](close)
if stk crosses over 20 then
position=1
elsif stk crosses under 80 then
position=-1
else
//position=undefined
endif

/// Exemple : strategire 2 //////////////////////
//c1=Average[7](close)
//c2=Average[20](close)
//
//if c1 crosses over c2 then
//position=1
//elsif c1 crosses under c2 then
//position=-1
//else
////position=undefined
//endif

//**************************************************************************//
//                      PROCEDURE                                           //
//**************************************************************************//
GainsPertes=undefined
Color=undefined

///////////////////////   ACHAT  ///////////////////
if position=1 then
cpt=1
Inversion=barindex                   // Mémorise le cours d'inversion
GainsPertes=close[cpt]               // ensuite je bloque dans cette section

//*** couleur de la Position de la strategie : Vert  pour la l'ACHAT  ****
//Color=GainsPertes-(GainsPertes *0.01)
Color = 1

/////////////////////   VADE  ///////////////////
elsif position=-1 then
cpt=(barindex-Inversion)             // Nombre de jour depuis le l'Inversion
VarJ=(100-(close/close[cpt])*100)    //
GainsPertes=close[cpt] + (close[cpt]*VarJ/100)

//*** couleur de la Position de la strategie : Rouge pour la VADE  ****
//Color=GainsPertes+(GainsPertes *0.01)
Color = -1

/////////////////////   EXCEPTIONS///////////////////

else

endif

///////////////////// Finalement  ///////////////////////////////
RETURN GainsPertes coloured by Color as "Gains & Pertes"//,Color as "    G & P Color"
Hello Nicolas
I tested the code with the modifications proposed, Anomalie’s problem still remains
i think the problem may come in section /// Achat /// GainsPertes=close[cpt]
I’t can make difference but scale is Enf of day .
You’re right, I think that the problem is that you store the candlestick Close at each new trade as the start of the next curve section. But you should use the last known value of the curve instead, because it is where your “profit and loss” curve may continue.
I’m currently trying to recode the whole thing in my own point of view, it gives me headache 🙂 Should not code at Sunday evening 🙂
Thanks Nicolas and i’m sorry for your headache , i go on on my coding, with another approch, hihihi
We may compare the final search at the end.
Hello, Nicola
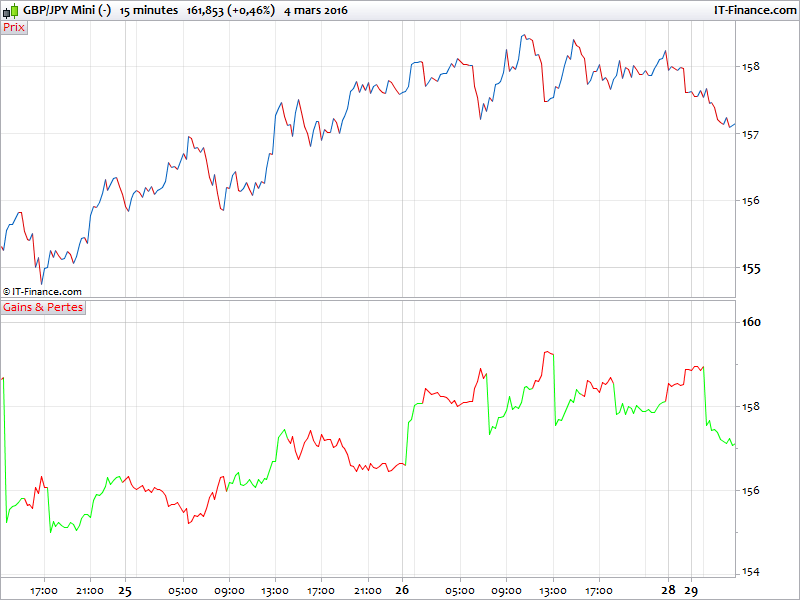
Do you think the same code would work in Intraday?
*Could we have a pre-visualization before submiting a topic?
Hello Ric, you can edit your post after it has been submitted, there are buttons just above your avatar. And yes this code would work for any timeframe, I dont see any restrictions that could make it not fully function in intraday! 🙂
Do you mean the avatar inside the topic submited? if so there are no buttons allowing re-edit.
Is the avatar of the login? same remark
You only have 5 minutes to edit your last post :

Surprenant, Firefox 39.03 affiche uniquement Reply et #3480 ,et rien d’autre
Windows 7 (64 bit)

Bonjour,
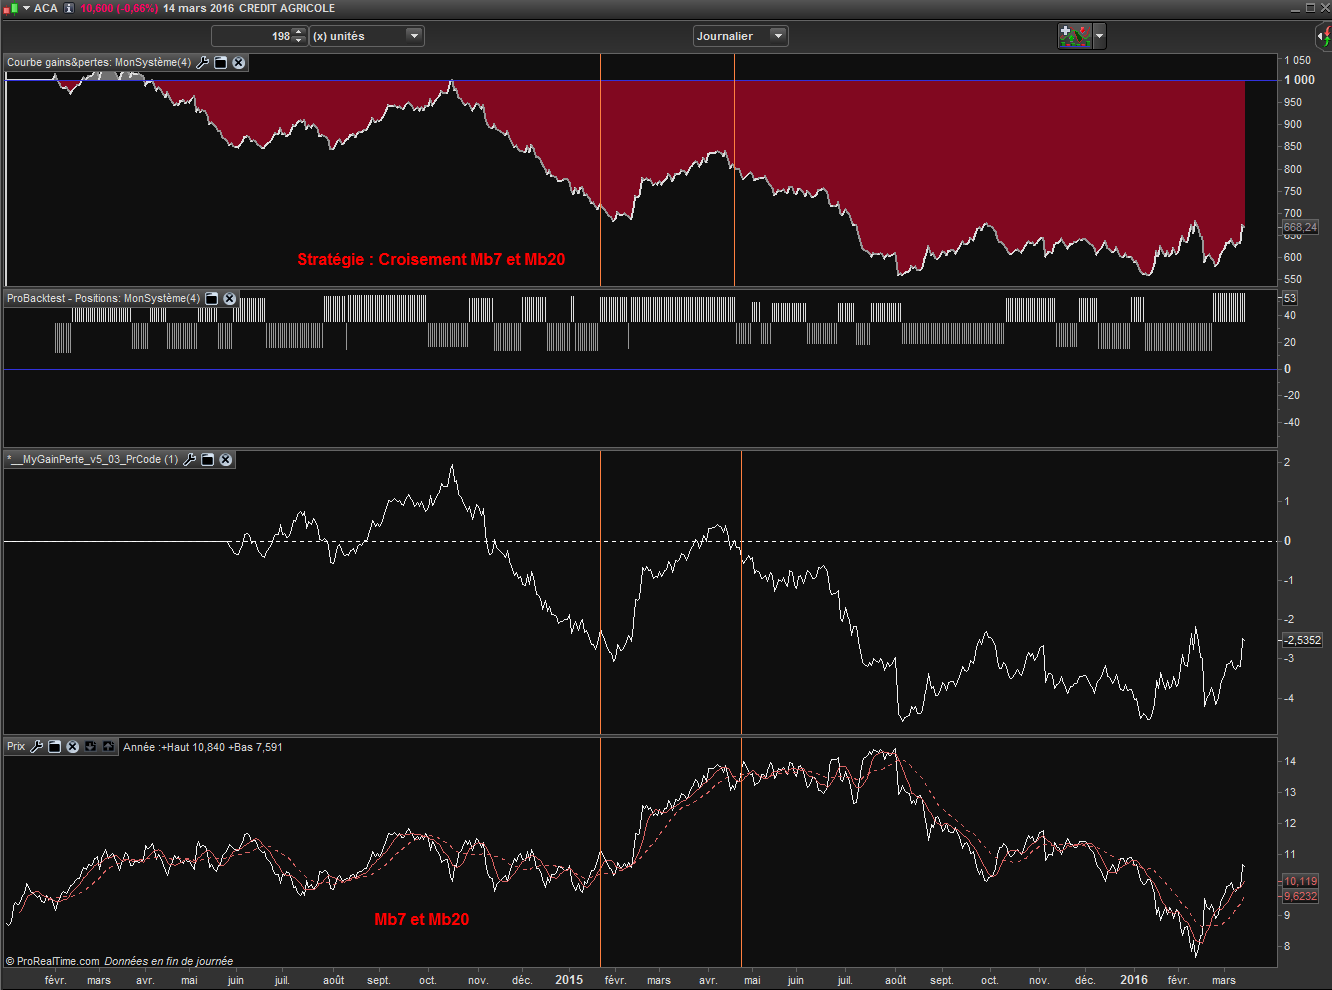
Voici le code complet dans son état actuel, cela necessite quelques ajustements très certainement.
Merci pour vos suggestions et amélirations.
A bientôt
* En journalier – End of Day
* Pourriez-vous confirmez si cela fonctionne en intraday , s’il vous plait, Merci
* Could you confirm if the code will work in Intraday, thank you.
/// Exemple : strategire 2 //////////////////
c1=Average[7](close)
c2=Average[20](close)

if c1 crosses over c2 then
position=1
elsif c1 crosses under c2 then
position=-1
else
//position=undefined
endif


//**************************************************************************//
//                      PROCEDURE                                           //
//**************************************************************************//

closeMemoA=barindex  //
varJ=((100-(close/close[1])*100)*-1)/100   // Variation journalière 0.0145 (+1.45%)

if barindex > 100 then  // varier selon vos besoins

///////////////////////   ACHAT  ///////////////////
if position=1 then
//bloc=20
prixInversion=close[closememoA-(closeMemoV)] // Axe
GainsPertes=GainsPertes  +( prixInversion*varj)

//*** en invisible pour le remplissage ****
ColorRemplissage=GainsPertes-(GainsPertes *0.02)
color=1


///////////////////   VADE  ///////////////////
elsif position=-1 then
//bloc=10

closeMemoA=closeMemoA[1]
closememoV=barindex
prixInversion=close[closememov-(closeMemoA+1)]  // Axe
GainsPertes=GainsPertes  +( prixInversion*-varj)

//*** en invisible pour le remplissage  ****
ColorRemplissage=GainsPertes+(GainsPertes *0.02)
color=-1

///////////////////   EXCEPTIONS ///////////////////
else
//bloc=1

endif
else      // barindex
endif     // Fin barindex
///////////////////// Finalement  ///////////////////////////////

return GainsPertes coloured by color as "G&P Mb 7-20",ColorRemplissage as "    G&P Remplissage"
Merci RicLG ça semble fonctionner correctement!