I want to code indicator lines to change colour as they cross a key threshold – whether those thresholds are part of the ‘text book’ indicator or a self-selected adaptation of the indicator. I only day trade Indexes on a combination of 5 & 2m or 15 & 2m charts (depends on volatility), with occasional reference to 60m. The context of the 2m chart within the longer periods is interesting, but more difficult to see without colour changes at the key levels. ( I also have other key levels of Momentum that I have devised myself which help also – but changing colour at these levels is a sophistication I do not envisage using yet, although my understanding of basic coding suggests that could follow, if this is ‘cracked’ first).
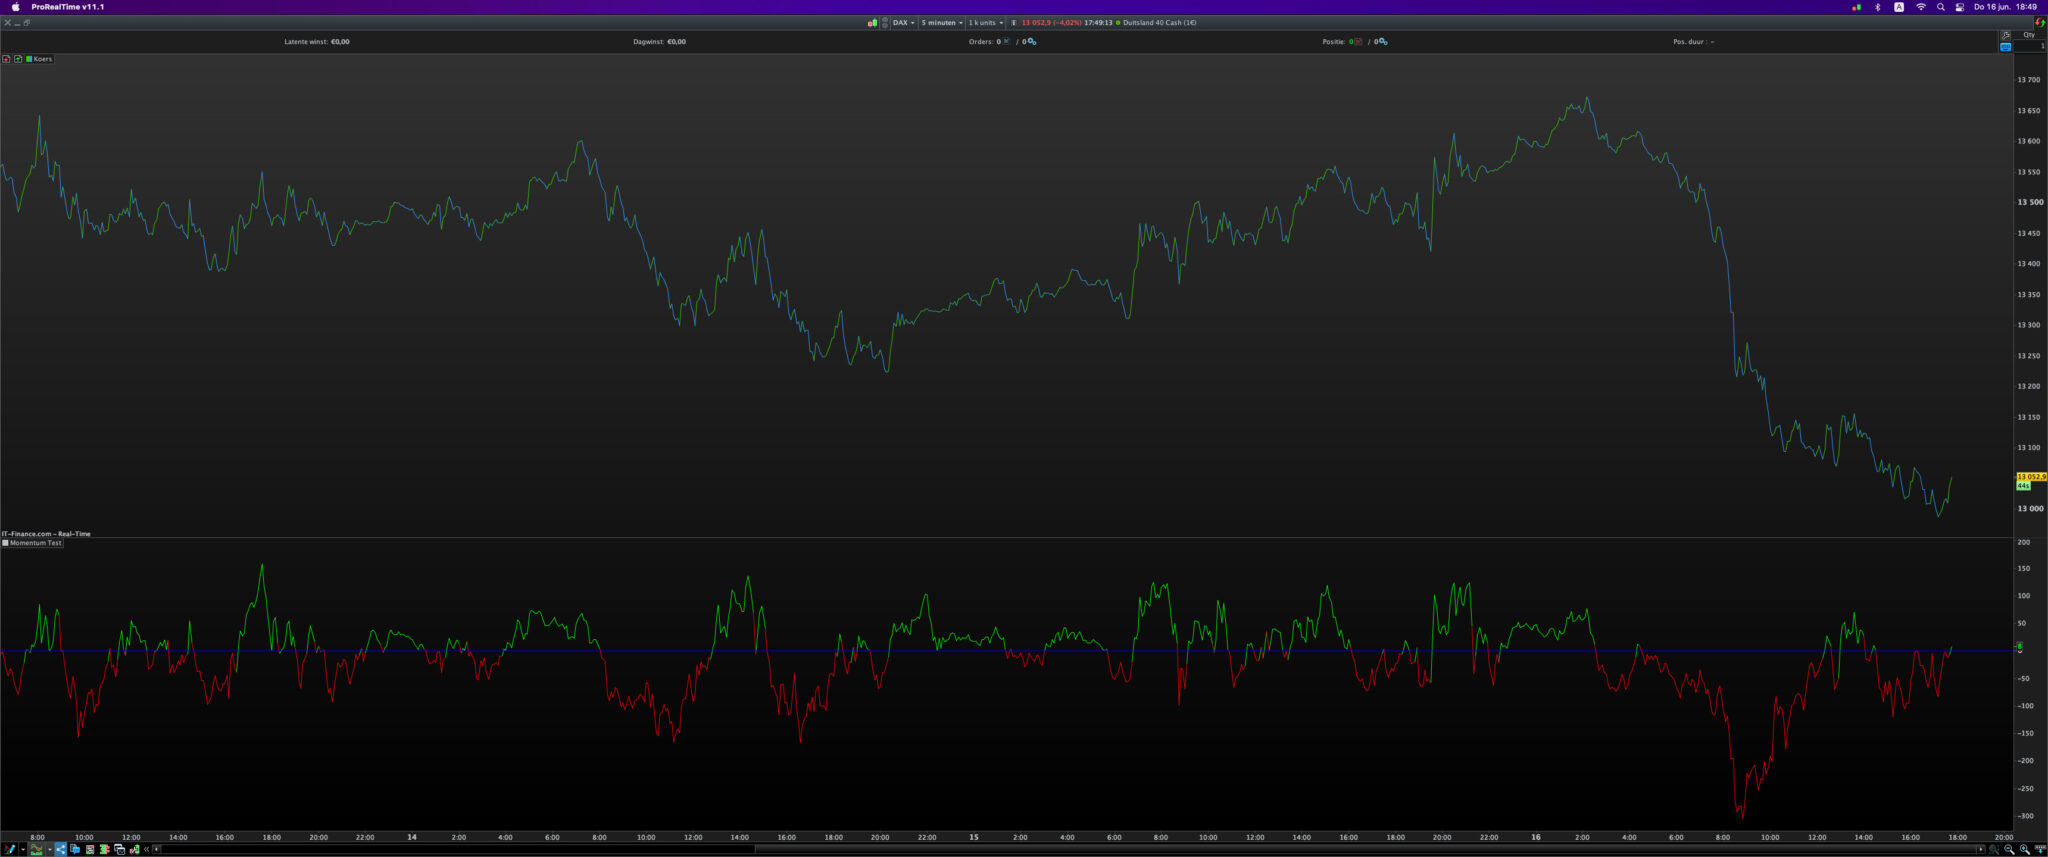
So, can anyone show me how to code the change of colour of the Momentum line when it crosses the Zero line? It changes colour if I ‘select’ the Histogram version of Momentum, but not the line version? I don’t understand why not!!
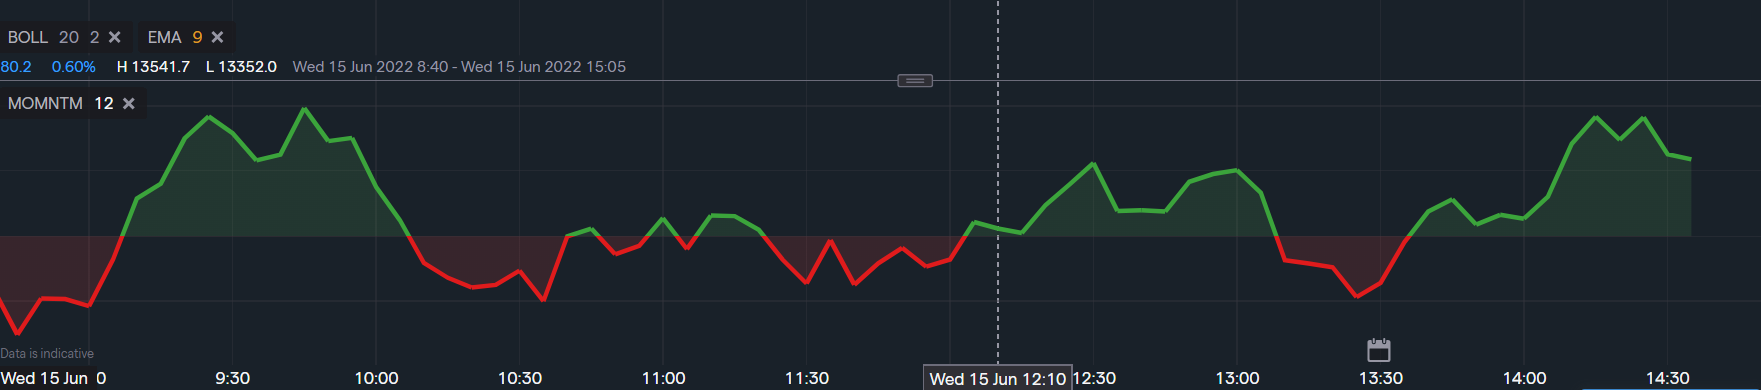
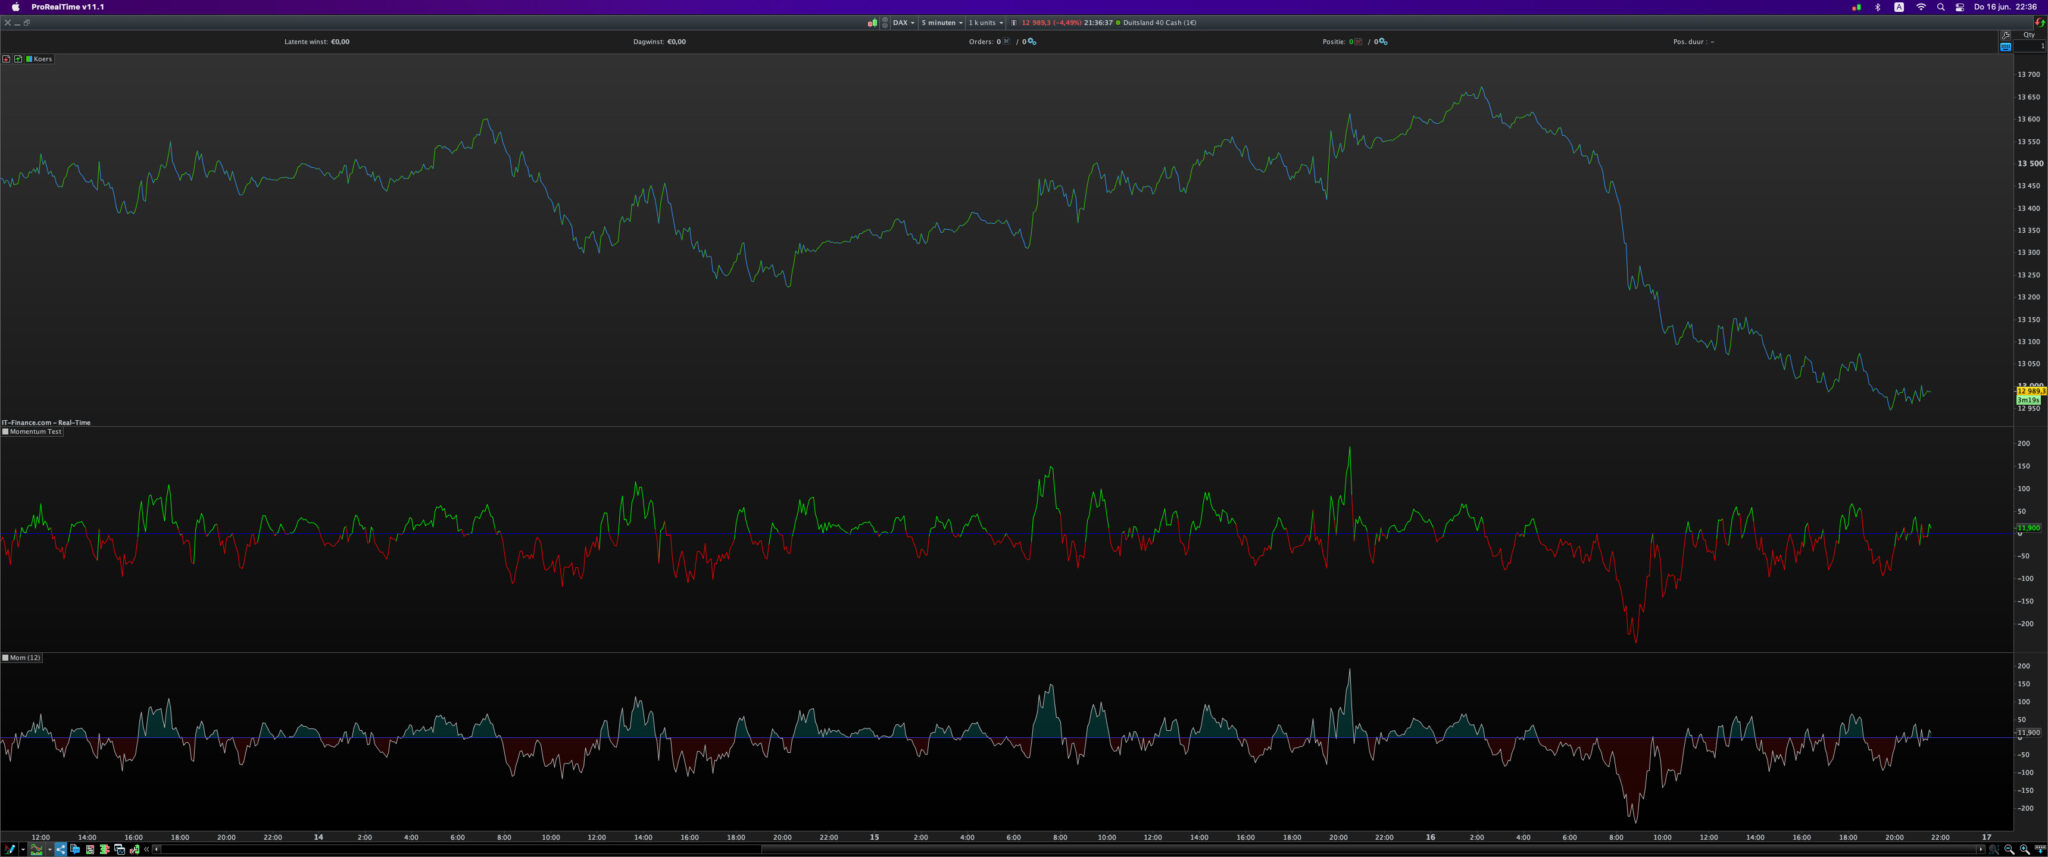
In PRT I can only get the Momentum line to change from e.g. Green to Red (or the reverse) if it changes direction, but it does so regardless of whether it is above or below the zero threshold line. This creates a messy picture and is not helpful. The histogram is also less clear than the colour changing at zero – per the IG Main Platform.
My coding skills are not up to understanding how to do this! Can anyone help, please? It must be possible because it already exists in the IG Main Platform – and PRT designs their platforms for them!
If this is not formally possible indeed (I just don’t know), what I would do is :
Have two Indicators, both doing the same.
Give both a different colour. Remember, they behave exactly the same.
Set the Alpha value (4th parameter of the RGB clause) to 0 (now it’s 100% transparent) of the one you don’t want to see. And vise versa.
If you can’t do this in the Indicator Code, do it after the call in the Strategy Code (if you use that anyway).
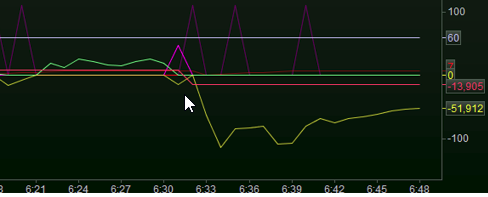
Below you see a (weak) example at play between the green line and the yellow line, which in my case is the difference between profit (green) and loss (yellow). Thus, it crosses the virtual “zero” line of gain.
Edit : It really is not the best example because the one how knows can see that I actually do something different there (if the one indicator (the profit) does not apply it starts to show zero while the other one continues which *was* at zero). … But I don’t have a better example of what I said above at hand. The principle is similar.
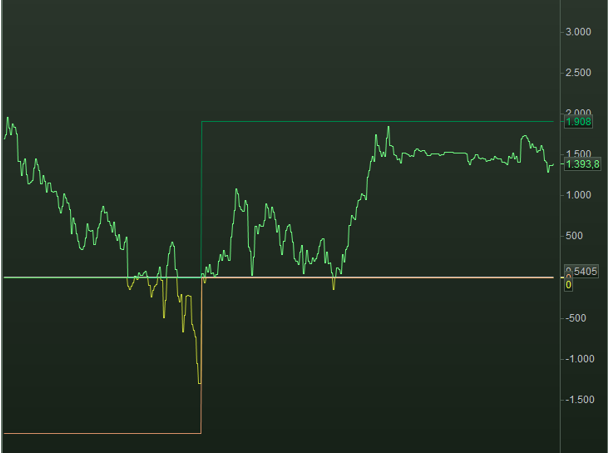
Here you can see a bit better what I mean. And notice that the above or below zero is not related to Indicator possibilities. It could have been just as well a threshold of 90, or the one crossing something else. It is about the principle of not using the one (like green) when you like to see the other (like yellow). And you can do this by switching off the one with Alpha value zero, while you assign “visible” (like 255) to the other.
Peter,
Thank you for such quick replies. My level of sophistication is such that I do not understand your meaning, however. Can you explain it to me like I am 12 yrs old (I am really 67!!).
So grateful for your interest.
Ian
Hi Ian – Oh I surely would to that. But I rather hear first from @robertogozzi or @Nicolas whether there’s a normal way to do this. If not, it may even help more people.
It’s of not much use to get acquainted with backdoor solutions if the normal – and with that simpler solutions exist as well.
On a side note, do notice that an Indicator can do more with colour changes than Strategy Code – in which latter not even an other colour for up vs down is possible. And I am *not* the very best with Indicators.
(I am really 67!!).
No worries. We all are. 🙂 🙂
 JS
JSParticipant
Veteran
Once n = 20
Once Hline = 0

xMom = Momentum[n]

DrawHLine(HLine) Coloured(0,0,200)

if xMom Crosses Over 0 then
r = 0
g = 255
elsif xMom Crosses Under 0 then
r = 255
g = 0
endif

Return xMom coloured(r,g,0)
Maybe this is a start…
If i’m following this right, and if its just the effects of the uptrend/downtrend border colors, then here’s my none coding solution. This will work when color zones are present and can be used on other indicators as well.
- Go to Momentum Settings – leftMouseClick>indicatorNameLabel>Configure>[Settings-Momentum]
- Hide the border color’s by making them the same color as the background color.
- Alternatively you can set the border color’s the same and just use as a highlight border of the color zone’s.
- Choosing the ‘Color zones’ allows the zone colors and intensity by ‘Opacity’ to be changed.
JSParticipant
Veteran
Hi @Druby
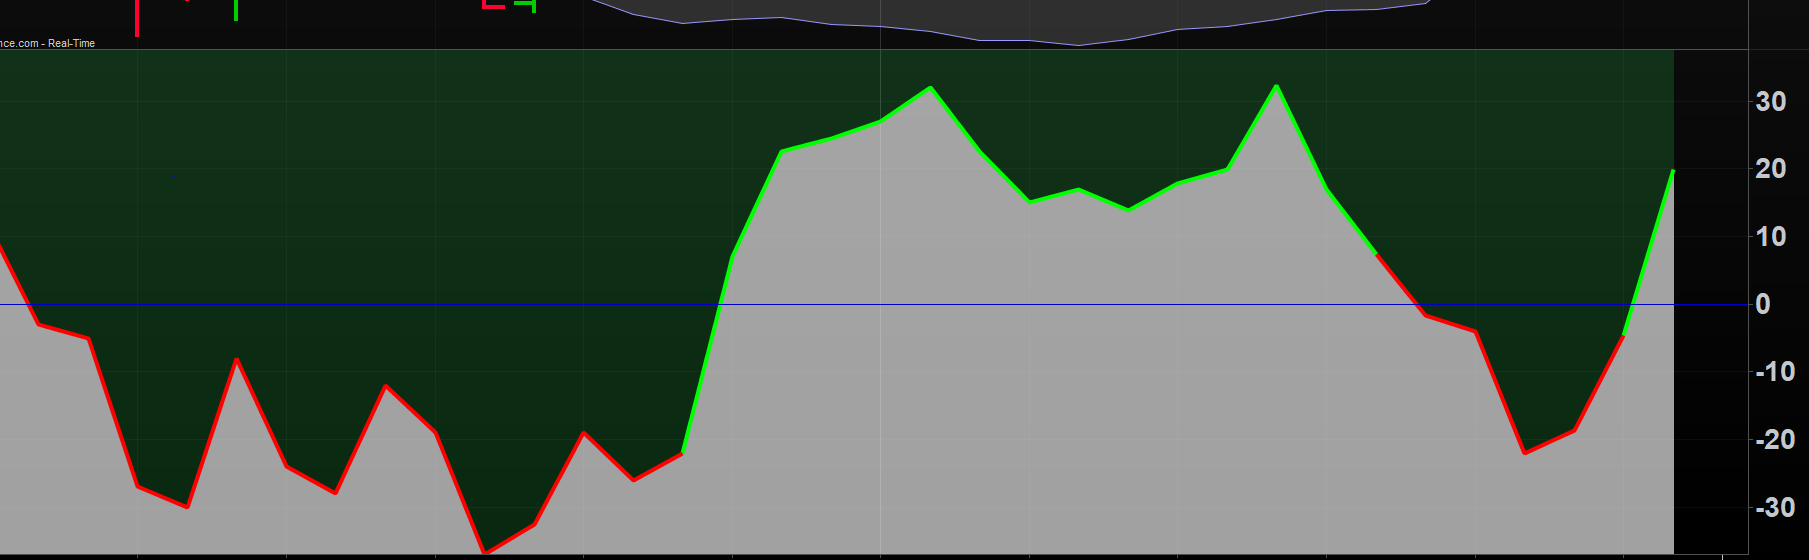
Do you mean something like that, with the colored surfaces?
You just can’t set this with every indicator…
JSParticipant
Veteran
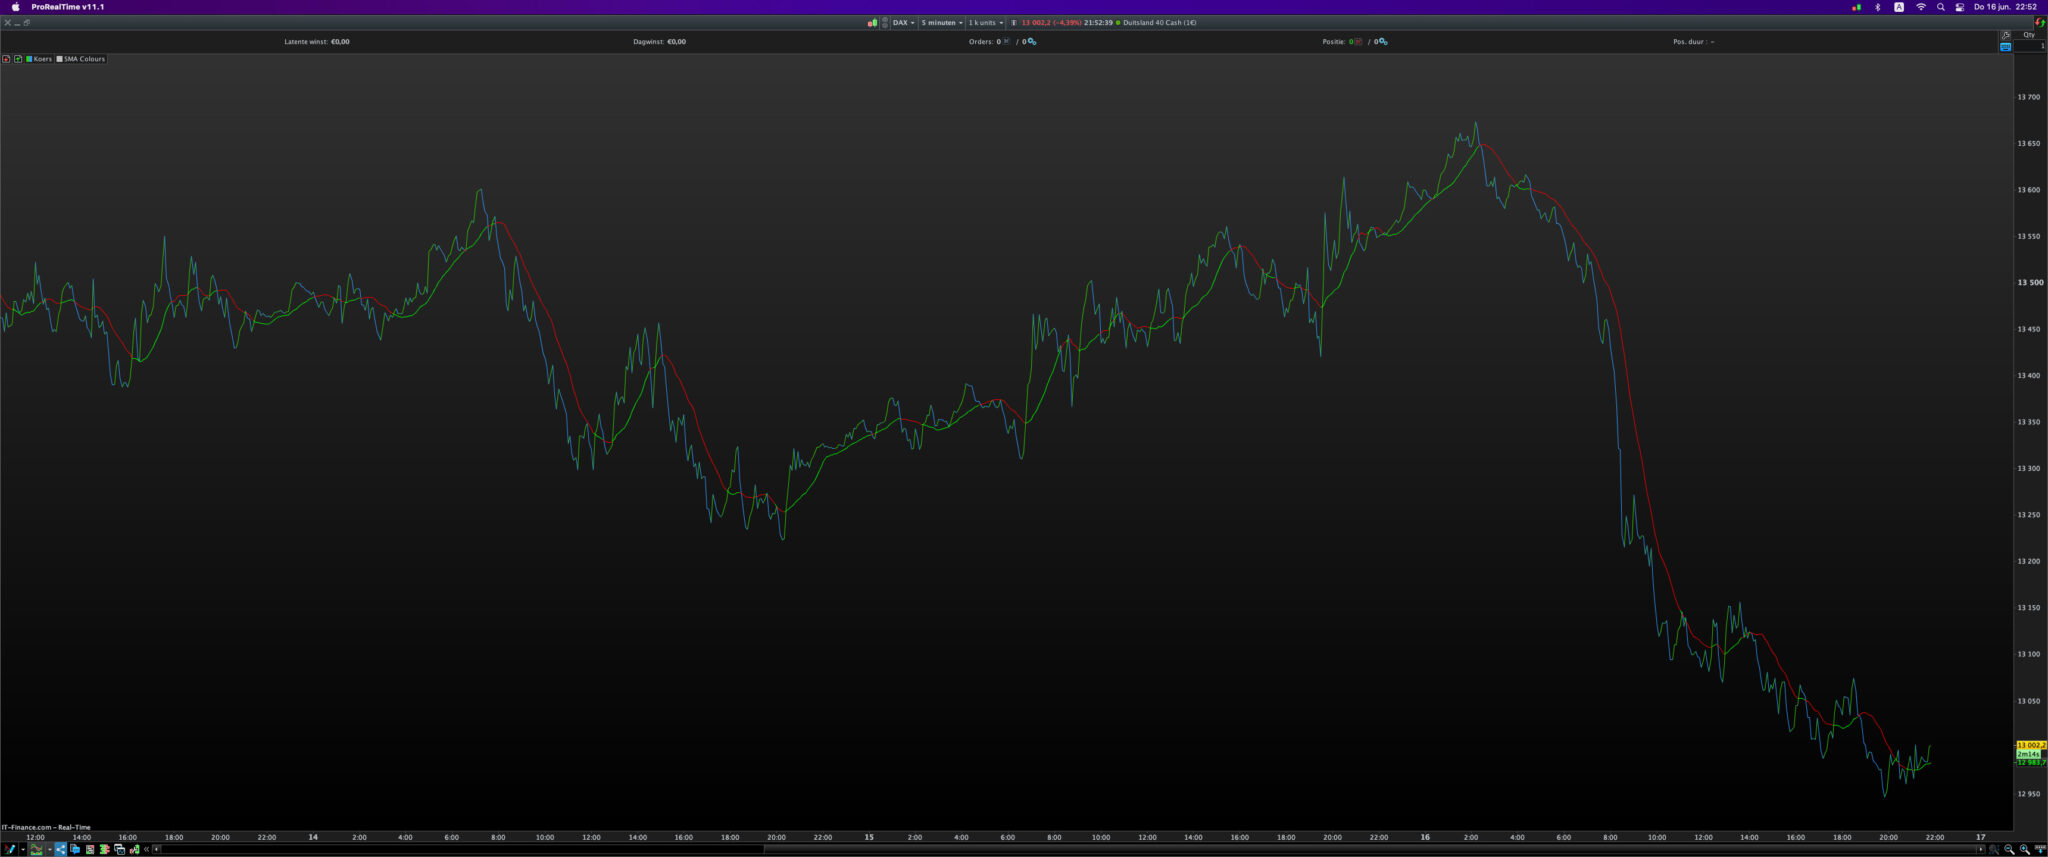
This is for a simple average…
Thanks
@JS,
I will give it a try. I did teach myself how to do basic of coding a few years back. I quickly learnt that I would never graduate at any sophisticated level so have tried to stay at a basic level. I will re-learn how to use (your) code and see how it does for me. And report back. Thank you once more.
JSParticipant
Veteran
Hi
@iac381
That’s right, it’s not easy but when I can…
Good luck and questions are free…
@druby
That is very good. It gets me a long way toward what I want to see. It seems odd that the coding of the line itself is not obvious given that it works in the use of the Histogram setting, don’t you think? In your example, with a black background that I use I just need to “hide” the Momentum line is as grey a colour as it will be go before it turns to white! I will try
@JS’s code for that I may have want I am after. Thank you.
@JS
I have now had time to copy in your code and initiate its use and it does the job extremely well. THANK YOU VERY MUCH! I do need to be able to refine it. If you have a few moments to clarify some points it would be extremely helpful.
I am probably basically asking for a translation of what you have done.
- The use of the word ‘Once‘. What does this do?
- n = 20 is presumably the period applied to the Momentum indicator and I can change this to whatever period I like? E.G. 12.
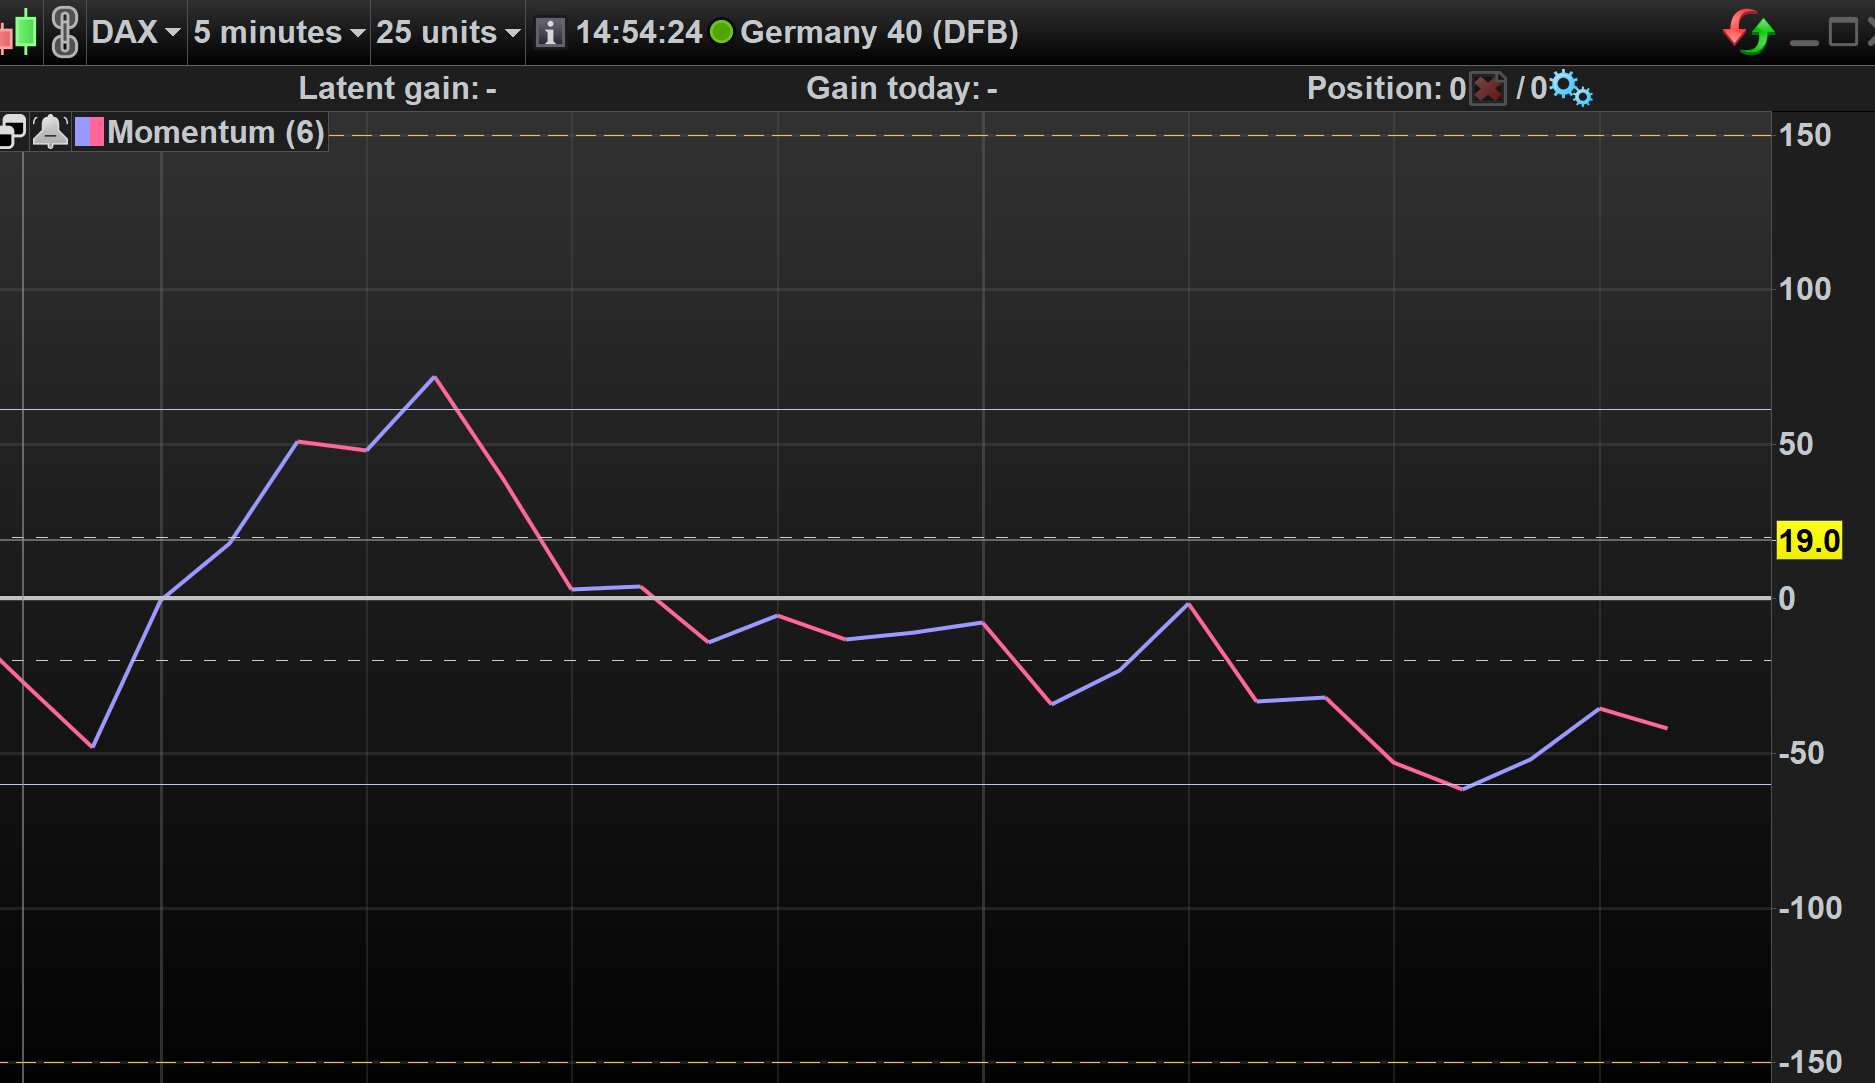
- Hline. What does this command do? It appears to insert the ‘zero line’; which is then referred to in the resulting ‘MyIndicator’ Settings’ – Colour Zone as ‘+/- Infinity’. This does not appear to enable the ‘colour zone’ to change colour as the indicator line crosses the ‘zero line’. It seems to only have a choice of colour for above or below the Indicator line only – per the picture attached. Would this be better implemented via the Horizontal Line indicator in the ‘Add indicator – ‘Predefined Indicators’ ‘ section? from which it can then have a colour zone created that does change according to the crossing of the zero line. I have certainly been able to do this. But I have not been able to change the colour of the Hline defined zero line, as you have coded it. Colours selected this latter way are selected from the pallet of colours (with a four letter & number combination definition) as opposed to the the ‘200’ colour number you have given it – and I do not know how to select or change!
So this all begs the question about the r=0 and r=255 and vice versa element, which will presumably resolve itself in your answers. But we are very close to the solution I was hoping to achieve, so once again a large thank you.
Ian
JSParticipant
Veteran
Hi
@iac381
- For example, you can use the instruction “ONCE” to give a value to a parameter and this value is only read 1 time (therefore “ONCE”) by the program.
So, suppose you have the parameter x and you want to give it 1 time a starting value of 10, then you put “ONCE x = 10” at the beginning of the program. You can then have the program adjust the value of x again, but the starting value is 10.
- n is indeed the period over which the momentum is calculated and this n can be adjusted as desired.
- Hline (short for Horizontal Line) is the parameter (the value) that specifies the height at which the horizontal line should be drawn.
Hline = 0 is then used in the command “DrawHLine” which ensures that the horizontal line is drawn. DrawHLine[0] would have the same effect.
The term “Coloured” behind DrawHLine ensures that the horizontal line gets a certain color. Coloured(R,G,B) means R = Red, G = Green, B = Blue and you can set these colors with a certain value (0 to 255). (0 is no color)
So when you want a red line you say Coloured (255,0,0) and when you want a blue line you say Coloured(0,0,255).
You do the same with xMom, when xMom goes up through the zero line you want it to turn green so you say R=0 (no Red) G=255 (only green).
And when xMom drops through the zero line, you want it to turn red, so you say R=255 (Red only) and G=0 (no Green).
Each indicator must be closed with the command “Return” and behind Return you can specify what needs to be drawn so here:
Return xMom (draw the xMom line) Coloured (give the xMom line the following colors) (r, g, 0). So when xMom rises through the zero line in the program, the value for G=255 and R=0, xMom is then drawn with Coloured(0,255,0)
I hope it’s a little clear because it’s always hard to describe.
@JS
Further thoughts are: –
a) I see the line changes colour at the beginning of the period during which it crosses the line, which does not quite match the desired outcome, but is very much better than not changing at the line.
b) My use of the Momentum indicator is also adapted to how strong or weak the momentum looks, visually. I do this by drawing in other Horizontal Lines – all at different levels, for different indexes and time periods: I select the levels by ‘looking back’ over as long a time period as necessary to estimate what is a ‘central zone’ either side of the zero line, a stronger move (roughly 3 x the distance of the central zone) and the extreme levels (approx. another 3 x the stronger moves). These lines I currently draw in individually, but may be better done by the method you have come up with for the Zero line. Any further input would be most welcome.