Good Morning,
TRADINGVIEW INDICATOR TO PROREAL TIME
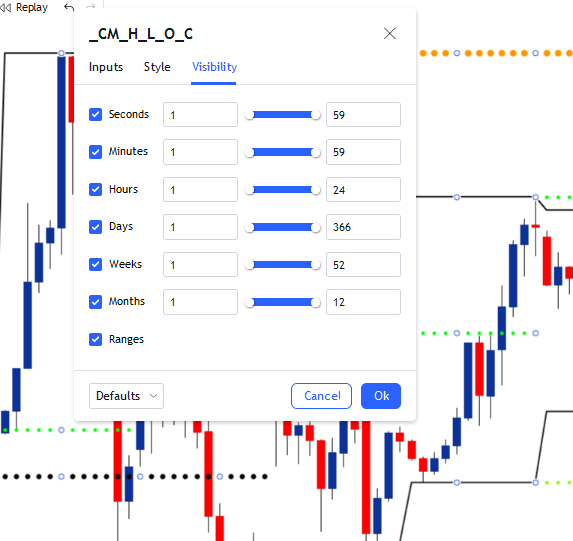
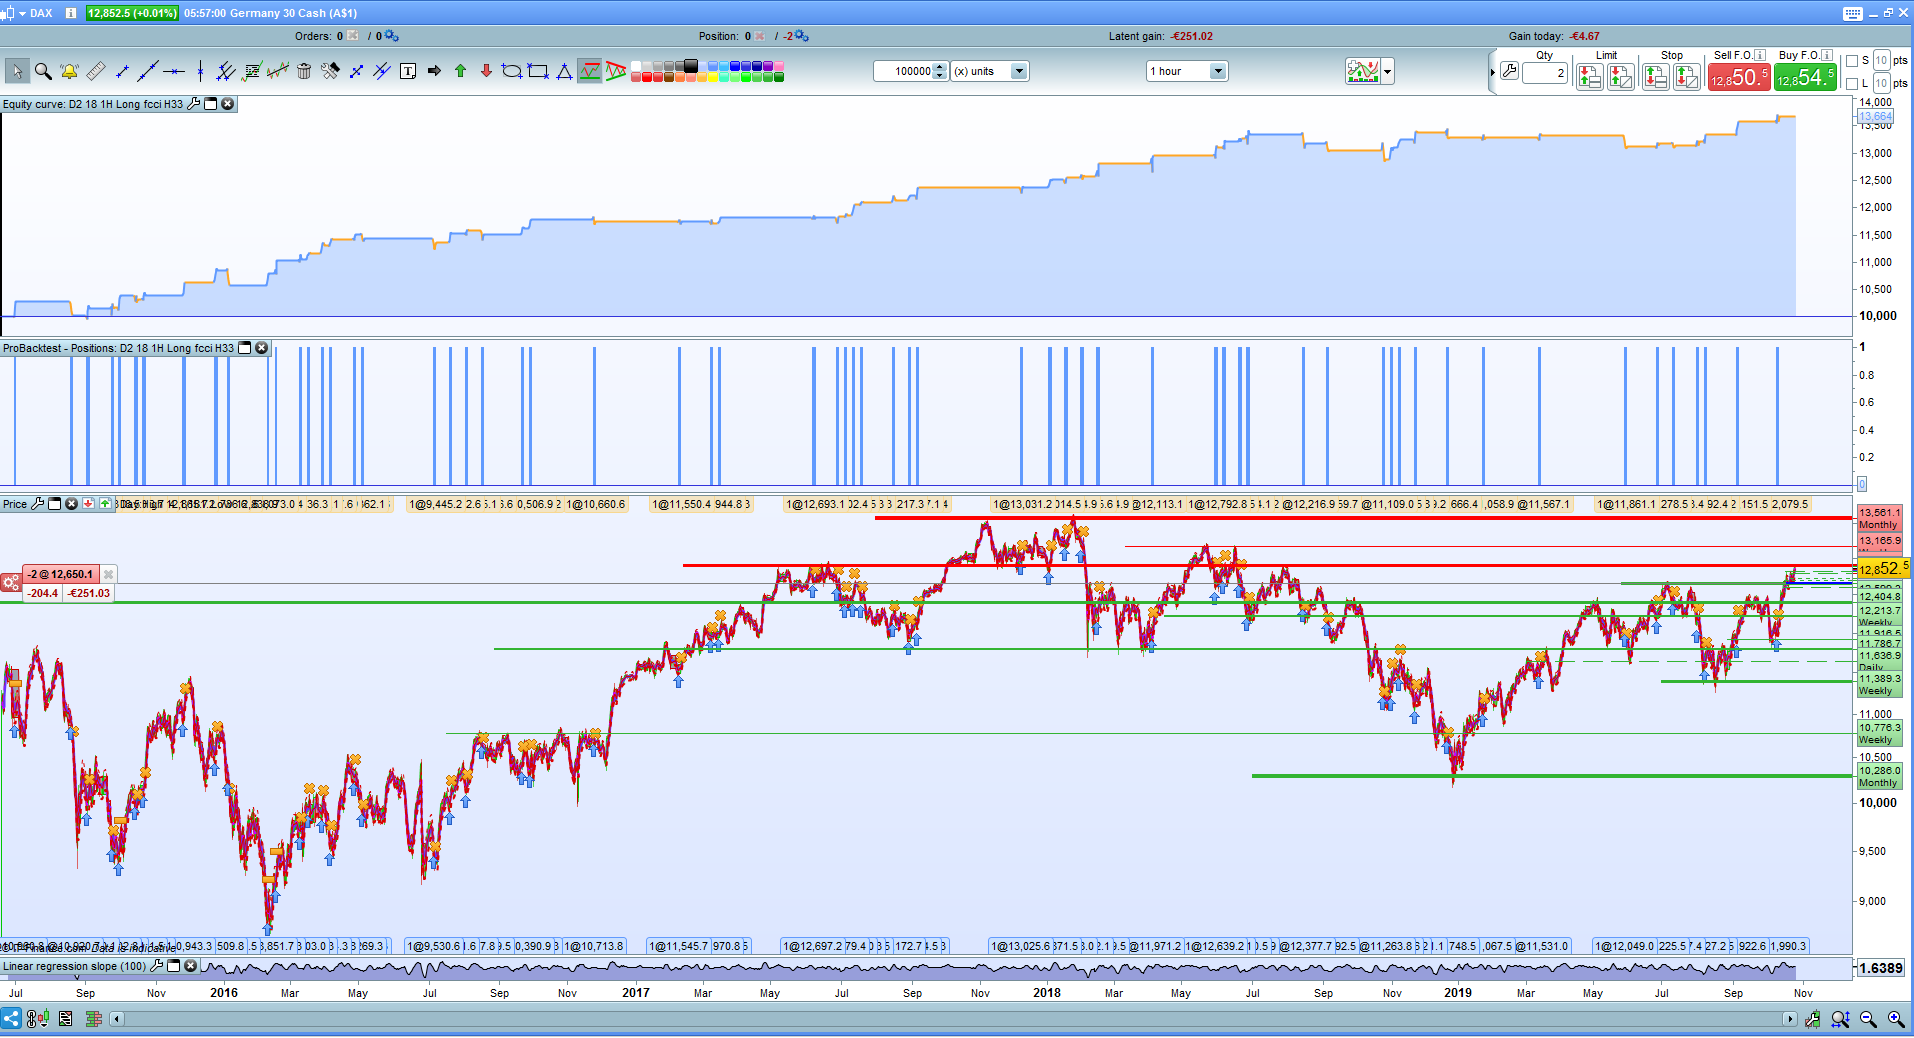
I am requesting for conversion of this indicator, it plots previous high/low from Daily to yearly as well as Daily high/low for Daily- Yearly as well as draws a channel like Donchian.
CODE:
//Created By ChrisMoody on 6-14-2014
//Plots Current Days Open, High, Low, Close, And Or Previous Days. Both Days can be turned on and off with CheckBox
//Also plots Weekly and Monthly Versions
//Daily Session To be used on IntraDay Charts
study(title=”_CM_High_Low_Open_Close”, shorttitle=”_CM_H_L_O_C”, overlay=true)
st = input(true, title=”Show Todays OHLC?”)
sy = input(false, title=”Show Yesterdays OHLC?”)
swt = input(false, title=”Show This Weeks OHLC?”)
swy = input(false, title=”Show Previous Weeks OHLC?”)
smh = input(false, title=”Show Monthly OHLC?”)
spmh = input(false, title=”Show Previous Months OHLC?”)
//Daily
tdo = security(tickerid, ‘D’, open)
pdo = security(tickerid, ‘D’, open[1])
pc = security(tickerid, ‘D’, close)
pdc = security(tickerid, ‘D’, close[1])
ph = security(tickerid, ‘D’, high)
pdh = security(tickerid, ‘D’, high[1])
pl = security(tickerid, ‘D’, low)
pdl = security(tickerid, ‘D’, low[1])
//Weekly
wtdo = security(tickerid, ‘W’, open)
wpdo = security(tickerid, ‘W’, open[1])
wpc = security(tickerid, ‘W’, close)
wpdc = security(tickerid, ‘W’, close[1])
wph = security(tickerid, ‘W’, high)
wpdh = security(tickerid, ‘W’, high[1])
wpl = security(tickerid, ‘W’, low)
wpdl = security(tickerid, ‘W’, low[1])
//Monthly
mtdo = security(tickerid, ‘M’, open)
mpdo = security(tickerid, ‘M’, open[1])
mpc = security(tickerid, ‘M’, close)
mpdc = security(tickerid, ‘M’, close[1])
mph = security(tickerid, ‘M’, high)
mpdh = security(tickerid, ‘M’, high[1])
mpl = security(tickerid, ‘M’, low)
mpdl = security(tickerid, ‘M’, low[1])
//Daily Plots
offs_daily = 0
plot(st and tdo ? tdo : na, title=”Daily Open”, style=circles, linewidth=2, color=silver)
plot(sy and pdo ? pdo : na, title=”Previous Days Open”, style=cross, linewidth=2, color=silver)
plot(st and pc ? pc : na, title=”Daily Close”, style=circles, linewidth=2, color=fuchsia)
plot(sy and pdc ? pdc : na, title=”Previous Days Close”, style=cross, linewidth=2, color=fuchsia)
plot(st and ph ? ph : na, title=”Daily High”, style=circles, linewidth=2, color=lime)
plot(sy and pdh ? pdh : na, title=”Previous Daily High”, style=cross, linewidth=2, color=lime)
plot(st and pl ? pl : na, title=”Daily Low”, style=circles, linewidth=2, color=red)
plot(sy and pdl ? pdl : na, title=”Previous Daily Low”, style=cross, linewidth=2, color=red)
//Weekly Plots
plot(swt and wtdo ? wtdo : na, title=”Weekly Open”, style=circles, linewidth=3, color=silver)
plot(swy and wpdo ? wpdo : na, title=”Previous Weeks Open”, style=cross, linewidth=3, color=silver)
plot(swt and wpc ? wpc : na, title=”Weekly Close”, style=circles, linewidth=3, color=fuchsia)
plot(swy and wpdc ? wpdc : na, title=”Previous Weeks Close”, style=cross, linewidth=3, color=fuchsia)
plot(swt and wph ? wph : na, title=”Weekly High”, style=circles, linewidth=3, color=green)
plot(swy and wpdh ? wpdh : na, title=”Previous Weeks High”, style=cross, linewidth=3, color=green)
plot(swt and wpl ? wpl : na, title=”Weekly Low”, style=circles, linewidth=3, color=red)
plot(swy and wpdl ? wpdl : na, title=”Previous Weeks Low”, style=cross, linewidth=3, color=red)
//Monthly Plots
plot(smh and mtdo ? mtdo : na, title=”Monthly Open”, style=circles, linewidth=4, color=silver)
plot(spmh and mpdo ? mpdo : na, title=”Previous Months Open”, style=cross, linewidth=4, color=silver)
plot(smh and mpc ? mpc : na, title=”Monthly Close”, style=circles, linewidth=4, color=fuchsia)
plot(spmh and mpdc ? mpdc : na, title=”Previous Months Close”, style=cross, linewidth=4, color=fuchsia)
plot(smh and mph ? mph : na, title=”Monthly High”, style=circles, linewidth=4, color=green)
plot(spmh and mpdh ? mpdh : na, title=”Previous Monthly High”, style=cross, linewidth=4, color=green)
plot(smh and mpl ? mpl : na, title=”Monthly Low”, style=circles, linewidth=4, color=red)
plot(spmh and mpdl ? mpdl : na, title=”Previous Months Low”, style=cross, linewidth=4, color=red)