Zac
ZacParticipant
Average
Hi,
I have the following Pine Script that I would like converted into PRT code:
study(title = “LEDGE ATR”, overlay = true)
length = input(20, minval=1)
offset = input(-1)
htr = security(tickerid, “D”, low+sma(tr[1], length))
ltr = security(tickerid, “D”, high-sma(tr[1], length))
plot(series=htr, color=red, linewidth=2, style=circles, trackprice=true, offset=offset)
plot(series=ltr, color=green, linewidth=2, style=circles, trackprice=true, offset=offset)
Anyone able to help? Anyone able to point me to a conversion service? The conversion quote from PRT seems excessive so I am wondering if there are any freelance alternatives.
The attached image shows the MT4 indicator in action. The indicator uses a 20 period ATR value calculated from the close of yesterday’s D1 candle. It takes this ATR value and displays the upper and lower range for today on intraday timeframes.
Thanks, Zac
This is what I made so far. As you may already know, ProBuilder don’t support yet the multitimeframe, so it is “painful” to calculate correctly the daily ATR in an intraday chart. So the values I get are not similar to the daily one, but close though ..
I’ll work further on it today or tomorrow, please ring me if you don’t have news!
ZacParticipant
Average
That looks amazing so far – thank you very much. It is really appreciated.
ZacParticipant
Average
Hi Nicolas,
Did you have a chance to make any further progress on this?
Thanks, Zac
This is where I am currently, sometimes values are correct, sometimes kind of different.. Please do your own test to see if it displayed correctly on your side with the good daily ATR values.
defparam drawonlastbaronly=true

// --- parameters
ATRperiod = 14
// ---

dTR=max(abs(Dhigh(0)-Dlow(0)),max(abs(Dhigh(0)-Dclose(1)),abs(Dlow(0)-Dclose(1))))
once avg=dTR
sum = 0
if barindex>10 then
if intradaybarindex=0 then
nday=nday+1
begin = barindex
result = dtr[1]
if nday>ATRperiod then
for i = 0 to ATRperiod do
sum = sum + result[i]
next
avg = ((avg[1]*(ATRperiod-1))+result)/ATRperiod
converted = avg/pointsize
endif
endif
endif

htr = Dlow(0)+avg[1]
ltr = Dhigh(0)-avg[1]

drawsegment(begin,htr,barindex,htr) coloured(200,100,0)
drawtext("#htr# - (D1atr: #converted#)",barindex,htr+10*pointsize,Dialog,Bold,14) coloured(200,100,0)
drawsegment(begin,ltr,barindex,ltr) coloured(200,100,0)
drawtext("#ltr# - (D1atr: #converted#)",barindex,ltr-10*pointsize,Dialog,Bold,14) coloured(200,100,0)

return
ZacParticipant
Average
Thanks Nicolas,
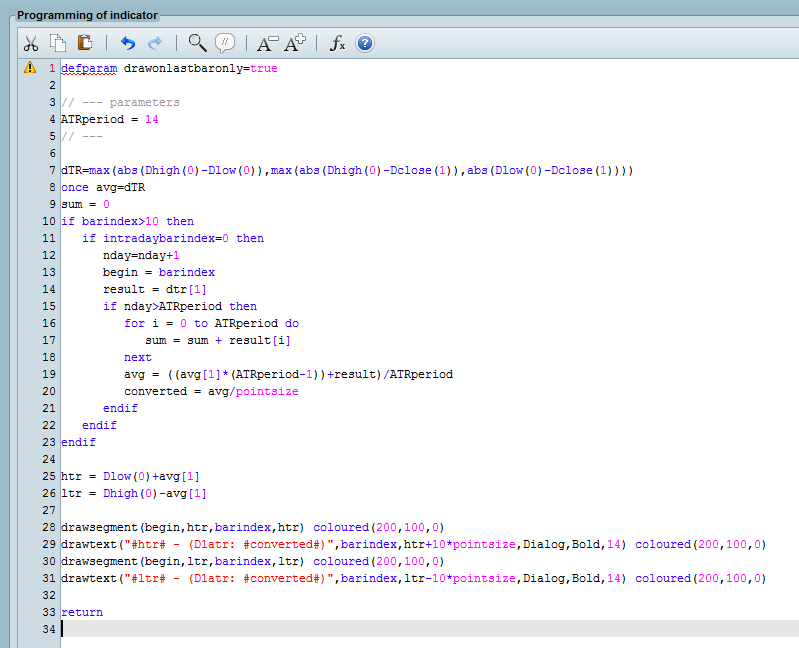
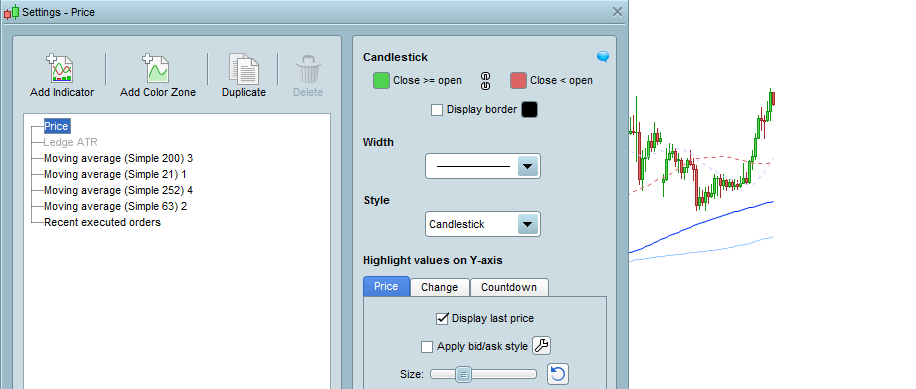
I copied and pasted the code but I have a problem with the first line. Screen shot below. Any idea what is happening?
The indicator is designed for prorealtime 10.3 only.
ZacParticipant
Average
Thanks, I have now tried in version 10.3 but unfortunately without success. I cannot replicate the screenshot you posted before.
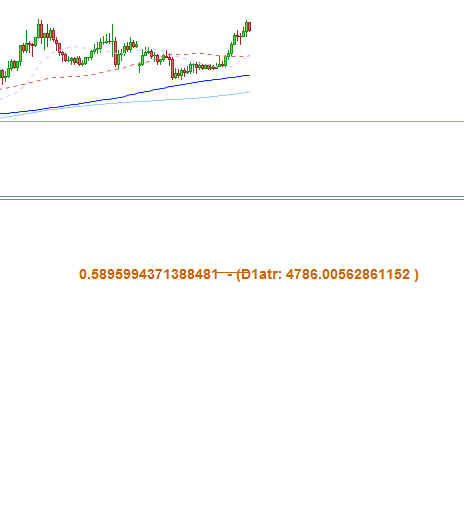
The indicator on price is greyed out and does not appear on the chart (first image below).
The indicator in a separate pane does not showing the range correctly (second image below).
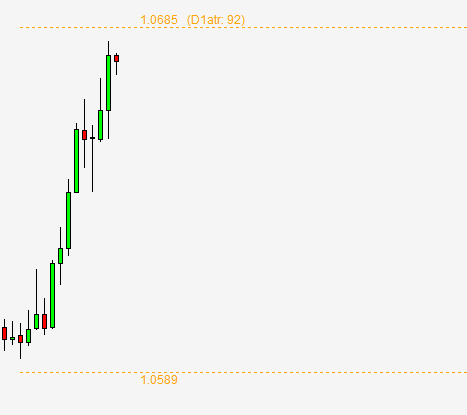
The MT4 indicator for the same chart the 1H EURUSD is also attached fyi.
It’s normal that the indicator name is greyed out because there is no returned variable to change. Please find below a new attempt to calculate and display correctly the daily ATR on an intraday timeframe:
defparam drawonlastbaronly=true

// --- parameters
ATRperiod = 20
// ---

dTR = 0
for i = 0 to ATRperiod
dTR=dTR+max(abs(Dhigh(i)-Dlow(i)),max(abs(Dhigh(i)-Dclose(i+1)),abs(Dlow(i)-Dclose(i+1))))
next

avg = dTR/ATRperiod
converted = avg/pointsize

htr = Dlow(0)+avg[1]
ltr = Dhigh(0)-avg[1]

if intradaybarindex=0 then
begin=barindex
endif

drawsegment(begin,htr,barindex,htr) coloured(200,100,0)
drawtext("#htr# - (D1atr: #converted#)",barindex,htr+10*pointsize,Dialog,Bold,14) coloured(200,100,0)
drawsegment(begin,ltr,barindex,ltr) coloured(200,100,0)
drawtext("#ltr# - (D1atr: #converted#)",barindex,ltr-10*pointsize,Dialog,Bold,14) coloured(200,100,0)

return
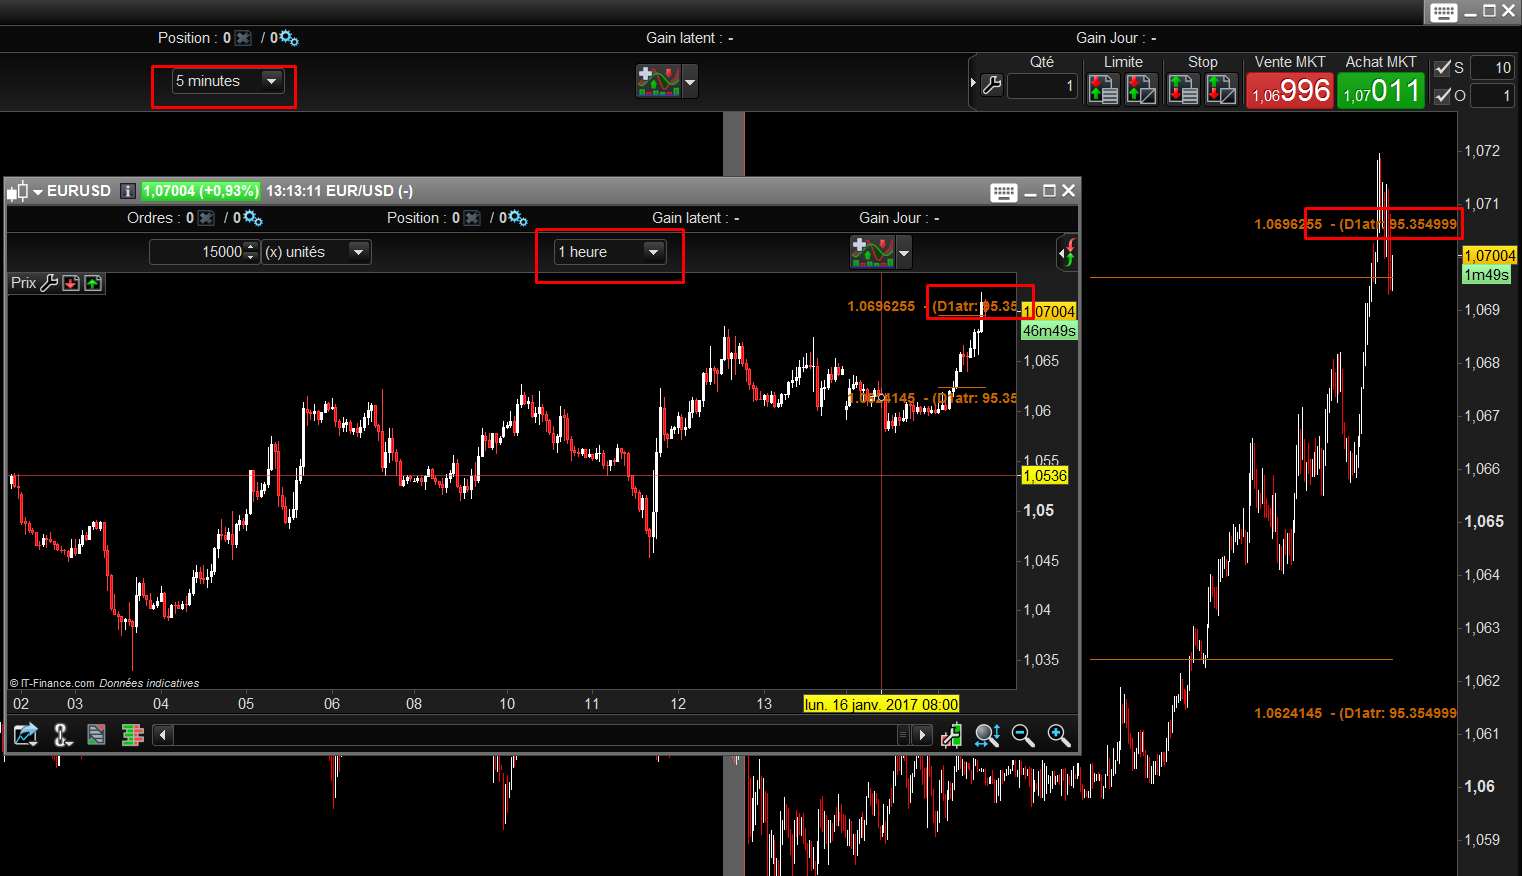
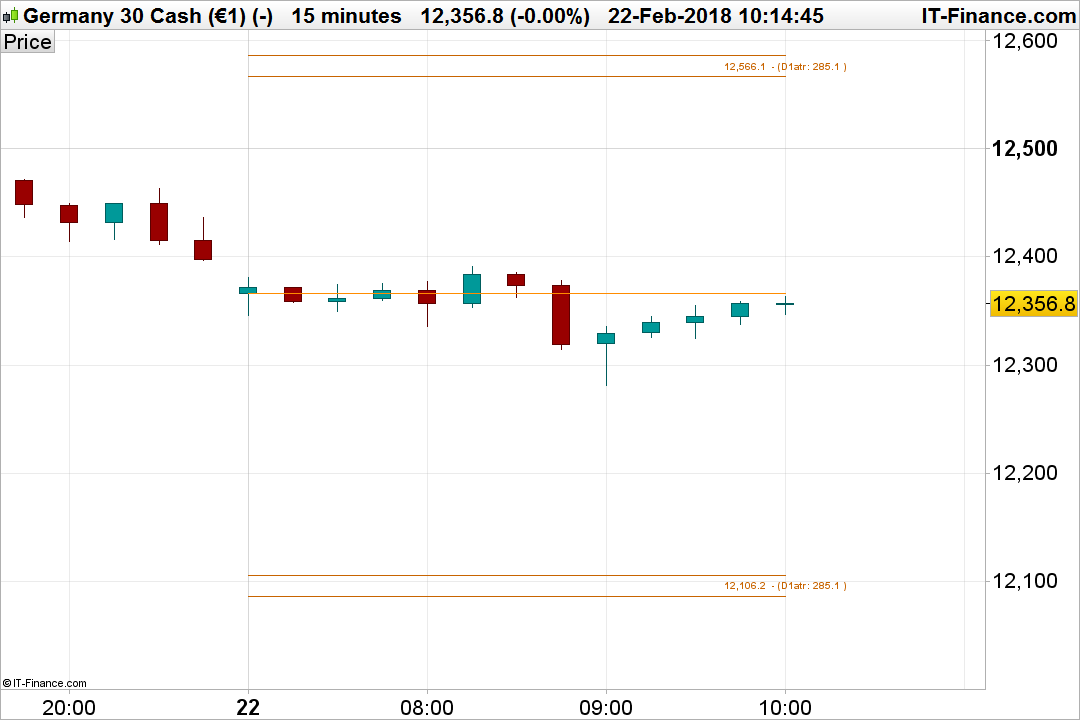
To display correctly, the chart needs at least the last and necessary X units displayed for the daily period of the calculation (20 days means at least 480 bars in an 1 hour timeframe).
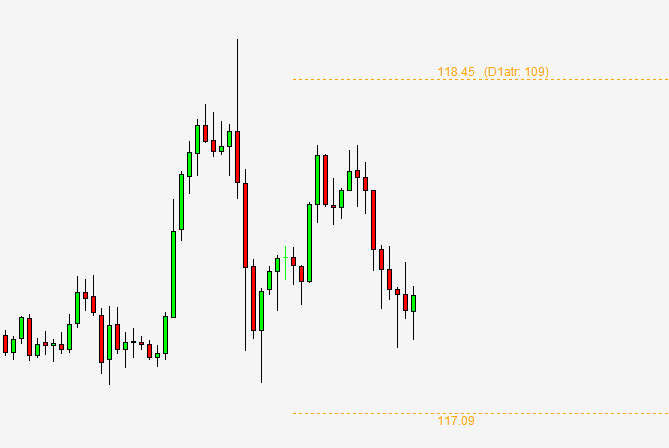
Seems to be good this time, my attached screenshot show at the same time 5 minutes and 1 hour timeframe displaying the same results.
ZacParticipant
Average
It works. Thank you very much.
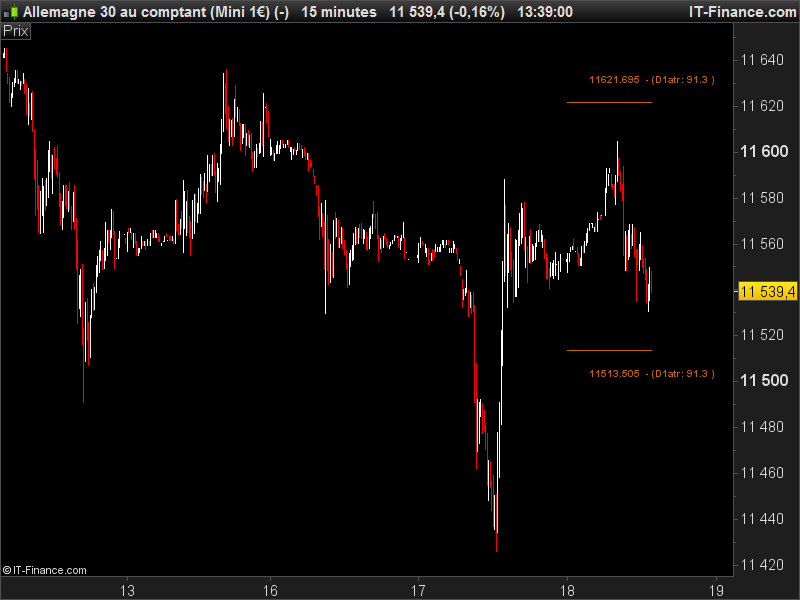
Is it possible to make the lines longer and move everything to the right or remove the numbers with all the decimal places as they obscure the price action? The ATR for the day is the important value and the two lines show where the levels are.
Thanks again, Zac
Ok, I rounded up the decimal with only 1 decimal and reduce the font size. It’s not possible to draw things at the right of the price (in the future). But if you want lines to extend across the whole chart, it’s possible.
defparam drawonlastbaronly=true
// --- parameters
ATRperiod = 20
// ---
dTR = 0
for i = 0 to ATRperiod
dTR=dTR+max(abs(Dhigh(i)-Dlow(i)),max(abs(Dhigh(i)-Dclose(i+1)),abs(Dlow(i)-Dclose(i+1))))
next
avg = dTR/ATRperiod
converted = round(avg/pointsize*10)/10
htr = Dlow(0)+avg[1]
ltr = Dhigh(0)-avg[1]
if intradaybarindex=0 then
begin=barindex
endif
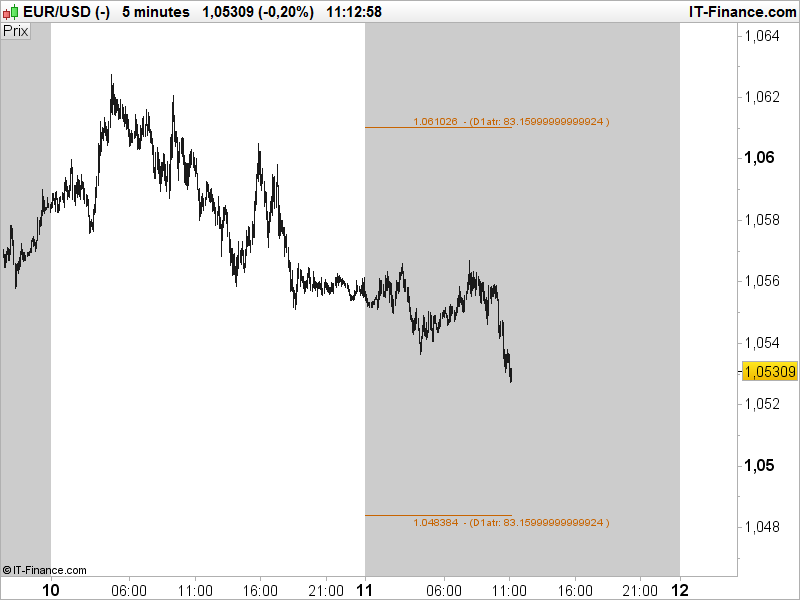
drawsegment(begin,htr,barindex,htr) coloured(200,100,0)
drawtext("#htr# - (D1atr: #converted#)",barindex,htr+10*pointsize,Dialog,Bold,10) coloured(200,100,0)
drawsegment(begin,ltr,barindex,ltr) coloured(200,100,0)
drawtext("#ltr# - (D1atr: #converted#)",barindex,ltr-10*pointsize,Dialog,Bold,10) coloured(200,100,0)
return
ZacParticipant
Average
I should be able to work with that. This indicator is critical to some of my setups so you have saved me from MT4!
Thanks very much for all your help with this.
Just 2 words about your trading setups would be greatly appreciated 🙂 Thanks.
Hi Nicolas..
was searching through about your Daily ATR range for intraday chart and came up to this !! im really interested in this as a strategy.. the idea is to get open of the candle and to daily ATR if it moves up we enter 20 pip below from daily ATR for shorts.. and the other way long..
+ is there a way to get a small line on open of the candle and two lines 20pips above from daily atr and 20pips below from daily atr??
attached to this same indicator???
would be great if you can do this?
I added the 3 lines you requested:
defparam drawonlastbaronly=true
// --- parameters
ATRperiod = 20
// ---
dTR = 0
for i = 0 to ATRperiod
dTR=dTR+max(abs(Dhigh(i)-Dlow(i)),max(abs(Dhigh(i)-Dclose(i+1)),abs(Dlow(i)-Dclose(i+1))))
next
avg = dTR/ATRperiod
converted = round(avg/pointsize*10)/10
htr = Dlow(0)+avg[1]
ltr = Dhigh(0)-avg[1]
if intradaybarindex=0 then
begin=barindex
endif
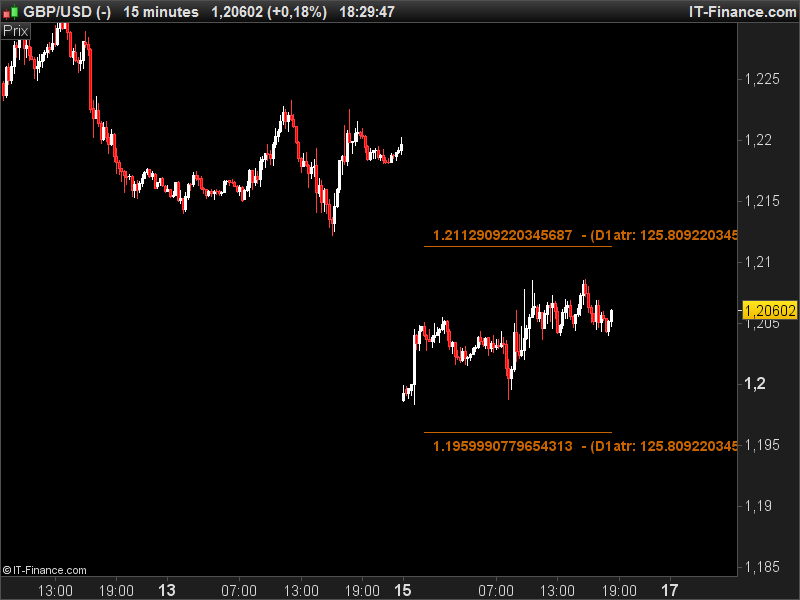
drawsegment(begin,htr,barindex,htr) coloured(200,100,0)
drawsegment(begin,htr+20*pointsize,barindex,htr+20*pointsize) coloured(200,100,0)
drawtext("#htr# - (D1atr: #converted#)",barindex,htr+10*pointsize,Dialog,Bold,10) coloured(200,100,0)
drawsegment(begin,ltr,barindex,ltr) coloured(200,100,0)
drawsegment(begin,ltr-20*pointsize,barindex,ltr-20*pointsize) coloured(200,100,0)
drawtext("#ltr# - (D1atr: #converted#)",barindex,ltr-10*pointsize,Dialog,Bold,10) coloured(200,100,0)
drawsegment(begin,Dopen(0),barindex,Dopen(0)) coloured(255,140,0)
return