Code conversion from UK Tradingview CM_Ultimate_MA_MTF_V2

Viewing 15 posts - 1 through 15 (of 22 total)
  • Author
    Posts
  • #121490 quote
    kjayacha107
    Participant
    New

    Hi,

    Am keen to use a trading strategy  from UK Tradingview. The strategy is called “CM_Ultimate_MA_MTF_V2”.

    The URL for the site is https://uk.tradingview.com/chart/D2NOFLGO/

    Can you please help me with the conversion.

    I have also attached the code

    Regards

    Jay

    UK-Tradingview-code.txt Capture-2-1.png Capture-2-1.png
    #121496 quote
    Vonasi
    Moderator
    Master

    kjayacha107 – Welcome to the forums. You have not followed the instructions for requesting free code conversion found in the ‘Help’ menu and here:

    https://www.prorealcode.com/free-code-conversion/

    The link you provided expects us to sign up as members before having access to the information which is a lot of unnecessary work for the person doing the conversion.

    Images of the indicator have also not been provided or a detailed description about it.

    Please add the missing information to your topic.

    #121500 quote
    kjayacha107
    Participant
    New

    Hi,

    Thanks for your reply.

    Please see below the link that should open for you to access the code and the diagram. Let me know if you are still unable to.

    https://uk.tradingview.com/script/8KVcQiJM-CM-Ultimate-MA-MTF-V2/

    #121506 quote
    Vonasi
    Moderator
    Master

    That link works better but posting an image of how the indicator should look and posting code would save the person who converts it a bit of time and effort.

    I’ll do it for you.

    //Created by user ChrisMoody 4-24-2014...Updated 7/28/2014 added Tilson T3
    //Modified on 5-5-14 for 4apprentice08 with Optional BarColor based on Price  Crossing MA #1, or #2
    //Modified on 7-25-2014 to Add in Tilson T3
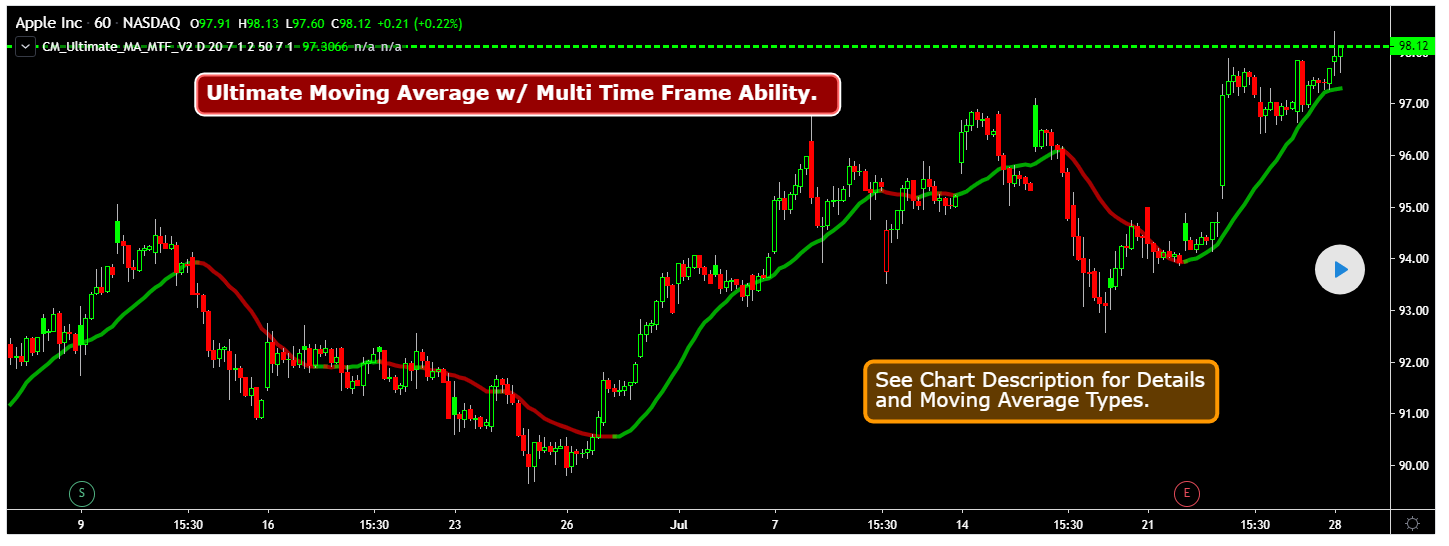
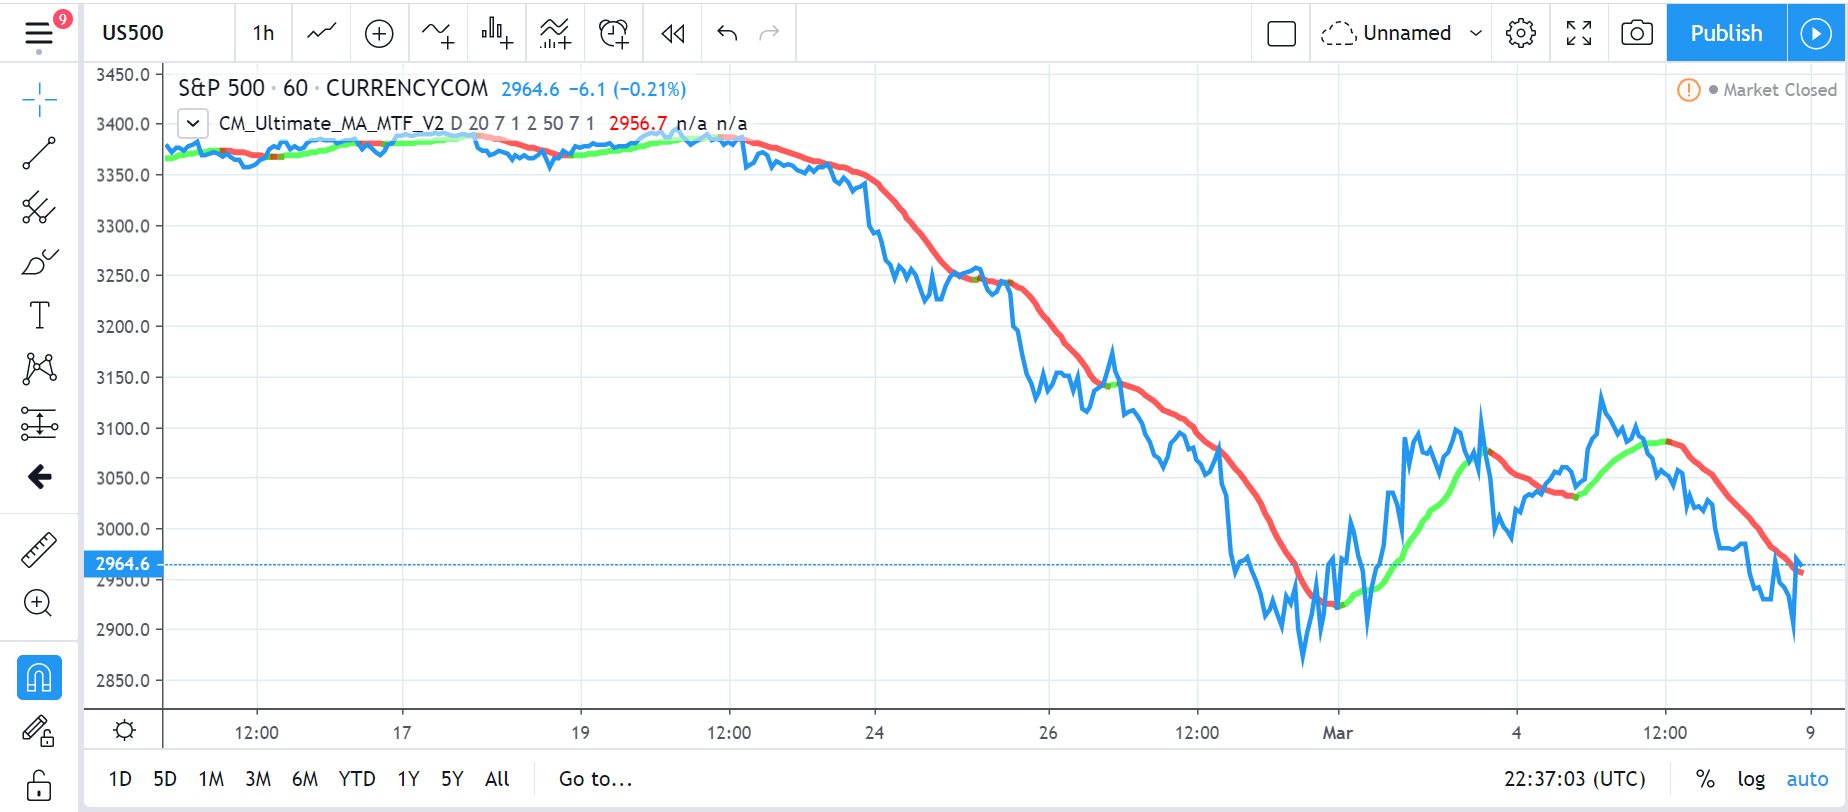
    //Plots The Majority of Moving Averages
    //Defaults to Current Chart Time Frame --- But Can Be Changed to Higher Or Lower Time Frames
    //2nd MA Capability with Show Crosses Feature
    study(title="CM_Ultimate_MA_MTF_V2", shorttitle="CM_Ultimate_MA_MTF_V2", overlay=true)
    //inputs
    src = close
    useCurrentRes = input(true, title="Use Current Chart Resolution?")
    resCustom = input(title="Use Different Timeframe? Uncheck Box Above", type=resolution, defval="D")
    len = input(20, title="Moving Average Length - LookBack Period")
    //periodT3 = input(defval=7, title="Tilson T3 Period", minval=1) 
    factorT3 = input(defval=7, title="Tilson T3 Factor - *.10 - so 7 = .7 etc.", minval=0) 
    atype = input(1,minval=1,maxval=8,title="1=SMA, 2=EMA, 3=WMA, 4=HullMA, 5=VWMA, 6=RMA, 7=TEMA, 8=Tilson T3")
    spc=input(false, title="Show Price Crossing 1st Mov Avg - Highlight Bar?")
    cc = input(true,title="Change Color Based On Direction?")
    smoothe = input(2, minval=1, maxval=10, title="Color Smoothing - Setting 1 = No Smoothing")
    doma2 = input(false, title="Optional 2nd Moving Average")
    spc2=input(false, title="Show Price Crossing 2nd Mov Avg?")
    len2 = input(50, title="Moving Average Length - Optional 2nd MA")
    sfactorT3 = input(defval=7, title="Tilson T3 Factor - *.10 - so 7 = .7 etc.", minval=0)
    atype2 = input(1,minval=1,maxval=8,title="1=SMA, 2=EMA, 3=WMA, 4=HullMA, 5=VWMA, 6=RMA, 7=TEMA, 8=Tilson T3")
    cc2 = input(true,title="Change Color Based On Direction 2nd MA?")
    warn = input(false, title="***You Can Turn On The Show Dots Parameter Below Without Plotting 2nd MA to See Crosses***")
    warn2 = input(false, title="***If Using Cross Feature W/O Plotting 2ndMA - Make Sure 2ndMA Parameters are Set Correctly***")
    sd = input(false, title="Show Dots on Cross of Both MA's")
    
    res = useCurrentRes ? period : resCustom
    //hull ma definition
    hullma = wma(2*wma(src, len/2)-wma(src, len), round(sqrt(len)))
    //TEMA definition
    ema1 = ema(src, len)
    ema2 = ema(ema1, len)
    ema3 = ema(ema2, len)
    tema = 3 * (ema1 - ema2) + ema3
    
    //Tilson T3
    factor = factorT3 *.10
    gd(src, len, factor) => ema(src, len) * (1 + factor) - ema(ema(src, len), len) * factor 
    t3(src, len, factor) => gd(gd(gd(src, len, factor), len, factor), len, factor) 
    tilT3 = t3(src, len, factor) 
     
    
    avg = atype == 1 ? sma(src,len) : atype == 2 ? ema(src,len) : atype == 3 ? wma(src,len) : atype == 4 ? hullma : atype == 5 ? vwma(src, len) : atype == 6 ? rma(src,len) : atype == 7 ? 3 * (ema1 - ema2) + ema3 : tilT3
    //2nd Ma - hull ma definition
    hullma2 = wma(2*wma(src, len2/2)-wma(src, len2), round(sqrt(len2)))
    //2nd MA TEMA definition
    sema1 = ema(src, len2)
    sema2 = ema(sema1, len2)
    sema3 = ema(sema2, len2)
    stema = 3 * (sema1 - sema2) + sema3
    
    //2nd MA Tilson T3
    sfactor = sfactorT3 *.10
    sgd(src, len2, sfactor) => ema(src, len2) * (1 + sfactor) - ema(ema(src, len2), len2) * sfactor 
    st3(src, len2, sfactor) => sgd(sgd(gd(src, len2, sfactor), len2, sfactor), len2, sfactor) 
    stilT3 = st3(src, len2, sfactor) 
    
    avg2 = atype2 == 1 ? sma(src,len2) : atype2 == 2 ? ema(src,len2) : atype2 == 3 ? wma(src,len2) : atype2 == 4 ? hullma2 : atype2 == 5 ? vwma(src, len2) : atype2 == 6 ? rma(src,len2) : atype2 == 7 ? 3 * (ema1 - ema2) + ema3 : stilT3
    
    out = avg 
    out_two = avg2
    
    out1 = security(tickerid, res, out)
    out2 = security(tickerid, res, out_two)
    
    //Formula for Price Crossing Moving Average #1
    cr_up = open < out1 and close > out1
    cr_Down = open > out1 and close < out1
    //Formula for Price Crossing Moving Average #2
    cr_up2 = open < out2 and close > out2
    cr_Down2 = open > out2 and close < out2
    //barcolor Criteria for Price Crossing Moving Average #1
    iscrossUp() => cr_up
    iscrossDown() => cr_Down
    //barcolor Criteria for Price Crossing Moving Average #2
    iscrossUp2() => cr_up2
    iscrossDown2() => cr_Down2
    
    ma_up = out1 >= out1[smoothe]
    ma_down = out1 < out1[smoothe]
    
    col = cc ? ma_up ? lime : ma_down ? red : aqua : aqua
    col2 = cc2 ? ma_up ? lime : ma_down ? red : aqua : white
    
    circleYPosition = out2
    
    plot(out1, title="Multi-Timeframe Moving Avg", style=line, linewidth=4, color = col)
    plot(doma2 and out2 ? out2 : na, title="2nd Multi-TimeFrame Moving Average", style=circles, linewidth=4, color=col2)
    plot(sd and cross(out1, out2) ? circleYPosition : na,style=cross, linewidth=15, color=aqua)
    //barcolor Plot for Price Crossing Moving Average #1
    barcolor(spc and iscrossUp() ? (iscrossUp() ? yellow : na) : na)
    barcolor(spc and iscrossDown() ? (iscrossDown() ? yellow : na) : na)
    //barcolor Plot for Price Crossing Moving Average #2
    barcolor(spc2 and iscrossUp2() ? (iscrossUp2() ? yellow : na) : na)
    barcolor(spc2 and iscrossDown2() ? (iscrossDown2() ? yellow : na) : na)
    Screenshot_1.png Screenshot_1.png
    #121510 quote
    kjayacha107
    Participant
    New

    Thank you for your help.

    I have attached the image of how the indicator should look like. Guess this is what you are looking for. If not, please let me know.

    Capture-2.png Capture-2.png
    #121787 quote
    kjayacha107
    Participant
    New

    Hi,

    Just wondering how you’re getting on with the code conversion. Thanks.

    Regards

    Jay

    #121802 quote
    Vonasi
    Moderator
    Master

    I am not doing the conversion. I moderate the posts in the forum to keep the place tidy and to make sure the few simple rules are followed. The code conversion will most likely be carried out by Nicolas and yours is not likely to be the only request for a free code conversion so you may have to wait a little while until your request reaches the top of the queue.

    #121806 quote
    Nicolas
    Keymaster
    Master

    I’m sorry but basically this indicator is just a code to color the MA you choose on the list depending of its trend (go upward or downward). It has also a bar coloring features when the price crosses one of the 2 MA you have selected. Are you sure you want this?

    There is a bunch of MA to choose in this indicator for instance: Average Filter Regression

    In the indicator settings, choose color for upward/downward slope of the chosen MA.

    There is still no MTF support for indicator in PRT.

    #121872 quote
    kjayacha107
    Participant
    New

    Hi,

    Thanks for sharing your views. I am used to this indicator and would be great if you can get it coded so I can use it for automated trading.

    Regards

    Jay

    #122789 quote
    kjayacha107
    Participant
    New

    Hi,

    Can you please provide an update on my request above.

    Thanks

    Jay

    #122792 quote
    GraHal
    Participant
    Master

    Suggestion … have Trading View open and also PRT, view the Indicator you like on TradingView and then make the Trade on PRT?

    It is a whole heap of work that you are asking to be undertaken and the ‘Coding Wizards’ are always so busy …  above would be a work around for you?

    Maybe if you have one favourite Indicator that you want making green for up and red for down then it would be loads less work?

    Did you thoroughly check out our Library of Indicators (link below). I have seen several that have a green for up and red for down colour.


    https://www.prorealcode.com/library-list-view/

    #122793 quote
    kjayacha107
    Participant
    New

    Thanks for your reply and sharing the link for the library.

    I checked the link. I want to move away from manual trading method hence my humble request to you to automate it for me. I intend to trade with a significantly higher number of lots.

    Please let me know if I need to pay for it. Thank you for your help.

    Regards

    Jay

    #122797 quote
    GraHal
    Participant
    Master

    But that code from TradingView that you want translated (into PRT) isn’t an Automated Trading System anyway … it is simply a whole bunch of moving averages where you select which MA you want to use and then the MA Line changes green for up and red for down.

    Is above how you see / saw it or did you think it was a complete Auto-System?

    Correct me if I am wrong, I won’t cry! 🙂

    #122800 quote
    kjayacha107
    Participant
    New

    Thanks for your reply. What you said is correct, so don’t have to cry 🙂

    It is simply a whole bunch of moving averages where you select which MA you want to use and then the MA Line changes green for up and red for down.

    What am looking for is if the trades can be placed automatically when the colour changes for e.g. go long when it’s green, sell and go short when it turns red.

    Can this be done please?

    #122806 quote
    GraHal
    Participant
    Master

    Yeah that could be done easily, but you need to choose / specify which Indicator you want to use for your Auto-Strategy.

    Also I suggest you look in the Library first as there are tons of Auto-Systems that do what you want.

    Backtest a few of those first and you will find that such a simple strategy does not give robust results so it best not even consider  trading with a significantly higher number of lots  … as you are considering (unless you are loaded? 🙂 )

    Best to put a few systems on Demo Forward Test (FT) until you get 100 ish trades making you money, and only then if the trades enter and exit at logical points.

    Even with 100 ish trades it could all be luck as the market you FT on could have been in an uptrend all the way through the FT. As soon as your chosen market hits a downtrend … bang, all profits could be lost in the next 20 to 40 trades ish.

    You say what Indicator you want to trade and I’ll find you a System in the Library?

Viewing 15 posts - 1 through 15 (of 22 total)
  • You must be logged in to reply to this topic.

Code conversion from UK Tradingview CM_Ultimate_MA_MTF_V2


ProBuilder: Indicators & Custom Tools

New Reply
Author
Summary

This topic contains 21 replies,
has 4 voices, and was last updated by GraHal
5 years, 10 months ago.

Topic Details
Forum: ProBuilder: Indicators & Custom Tools
Language: English
Started: 03/08/2020
Status: Active
Attachments: 4 files
Logo Logo
Loading...