Good Morning!
I have problems to get the right programmcode for this case:
if one of the closing prices between the 5th and 10th trading day in January is above the previous year’s closing price then go long after the 24th trading day in any month if condition is met and not yet long.
Sell if the closing price closes below SMA200 (minus 3%).
Thank you very much.
@Admin: Can you switch the offer to ProOrder Support.
That would be nice. Here on indicator it is wrong.
 JS
JSParticipant
Senior
Hi,
Try this one:
TimeFrame(1 year, UpdateOnClose)
YearClose=Close

TimeFrame(Daily, UpdateOnClose)
If Day>=5 and Day<=10 and Close>YearClose then
Threshold=1
EndIf

If NOT LongOnMarket and Day>24 and Threshold then
Buy 1 contract at Market
EndIf

SMA200=Average[200](Close)
If Close Crosses Under SMA200 or PositionPerf<-0.03 then
Sell at Market
Threshold=0
EndIf
Graph YearClose as "YearClose"
@JS: Thank you very much! That is very nice.
Can you shortly explain the meaning of Threshold.
Thank you.
@JS: Thank you very much! That is very nice.
Can you shortly explain the meaning of Threshold.
Thank you.
JSParticipant
Senior
Hi,
If the Close>YearClose (in which the YearClose is the threshold) and the other day conditions are also true (Day>=5 and Day<=10) then the value of the threshold condition is equal to 1. (So, Close>YearClose and Day>=5 and Day<=10)
I’ve broken this down in the code because you can’t check the given days (3) at the same time if:
Day>=5 and Day<=10 and Day>24 (it is impossible that Day>=5 and Day<=10 AND Day>24) that’s why I’ve broken it down)
I hope it’s a little clear, if not ask questions…
Hello
@JS!
i have checked the code because in manuel backtesting I get different entry points.
So the problem is, that the code from you only buy when the day >24 from each month is over the close level of December of the previous year. That is a little bit different from my idea.
My idea was if one close price between 5 and 10 january is higher than the close price of the last day of the december than you can buy every month after day 24 if you are not on the market.
So the Time between 5 and january is the condition for every month buy
So the code has to say:
SUP Close DEZ 2023 (4769,83)
9.1. Close (4756,5) = wrong (Day=6)
10.1. Close (4783,45) = True (DAY=7)
..
so in 2024 i can buy on 25.01., and wenn i have a exit after that time, i can buy again on 26.2. and on 25.3 and so one.
Thank you sir
JSParticipant
Senior
Hi @Lambo
I see what you mean, the check must be done every month…
Unfortunately, I’m not very good with “Time and Date” and I don’t see the solution now…sorry.
Maybe someone else sees it?
This code seems to meet your criteria (tested on DAX, 1h TF):
ONCE EntryDay  = 24
ONCE MonthDay1 = 5
ONCE MonthDay2 = 10
ONCE Tally     = 0
ONCE AboveFlag = 0
ONCE YearClose = 99999999

// at the beginning of each year save the closing price of the previous year
IF OpenYear <> OpenYear[1] THEN
   YearClose = close[1]
ENDIF

// at the beginning of each Month reset the tally of trading days to zero
IF (OpenMonth <> OpenMonth[1]) THEN
   Tally     = 0
   AboveFlag = 0
ENDIF

// each new day updates the tally
IF (OpenDay <> OpenDay[1]) THEN
   Tally     = Tally + 1
ENDIF

// between day 5 and day 10 check if the price is above the previous Year's closing price
IF (Tally >= MonthDay1) AND (Tally <= MonthDay2) THEN
   AboveFlag = max(AboveFlag,close > YearClose)
ENDIF

// enter after trading day 24 if conditions are met
IF (Tally > EntryDay) AND AboveFlag AND Not OnMarket THEN
   BUY 1 CONTRACT AT MARKET
   AboveFlag = 0
ENDIF

// exit when the price closes below (Sma200 - 3%)
Sma200   = average[200,0](close) * 0.97
ExitFlag = close < Sma200
IF LongOnMarket AND ExitFlag THEN
SELL AT MARKET
ENDIF
// debugging section
graphonprice YearClose coloured("Blue")
graphonprice Sma200    coloured("Fuchsia")
//graph        Tally
//graph        AboveFlag
Hello Roberto,
i have put the code into a SUP Index for Backtesting. But nothing happens here.
I saw the line for the previous year closing but no buy and sell.
Can you shortly look at my code:
defparam preloadbars=5000
defparam cumulateorders=false
size=(100000+strategyprofit)/(close)
ONCE EntryDay = 24
ONCE MonthDay1 = 5
ONCE MonthDay2 = 10
ONCE Tally = 0
ONCE AboveFlag = 0
ONCE YearClose = 2024
// ate the beginning of each year save the closing price of the previous year
IF OpenYear <> OpenYear[1] THEN
YearClose = close[1]
ENDIF
// at the beginning of each Month reset the tally of trading days to zero
IF (OpenMonth <> OpenMonth[1]) THEN
Tally = 0
AboveFlag = 0
ENDIF
// each new day updates the tally
IF (OpenDay <> OpenDay[1]) THEN
Tally = Tally + 1
ENDIF
// between day 5 and day 10 check if the price is above the previous Year’s closing price
IF (Tally >= MonthDay1) AND (Tally <= MonthDay2) THEN
AboveFlag = max(AboveFlag,close > YearClose)
ENDIF
// enter after trading day 24 if conditions are met
IF (Tally > EntryDay) AND AboveFlag AND Not OnMarket THEN
buy size contracts at market
AboveFlag = 0
ENDIF
// exit when the price closes below (Sma200 – 3%)
Sma200 = average[200,0](close) * 0.97
ExitFlag = close < Sma200
IF LongOnMarket AND ExitFlag THEN
SELL AT MARKET
ENDIF
// debugging section
graphonprice YearClose coloured(“Blue”)
graphonprice Sma200 coloured(“Fuchsia”)
//graph Tally
//graph AboveFlag
You must have enough bars to access the previous year’s last bar (on a 1-minute TF you will need 200K bars, but after June it won’t work at all).
Thank you sir. I want to use it on day Chart. It is an optimazier for the Month ultimo trading. go long at the end of the month.
So I am working with 1 day as timeframe.
Can you check your Code with SUP Kassa? I don’t get a trade and 5.000 days are as a preloud enough for some years I think.
Because there are not enough trading days in each month, try:
ONCE EntryDay = 20
the line
ONCE YearClose = 0
doesn’t affect any calculations and can even be safely removed. In any case it is a price, not a year (such as 2024).
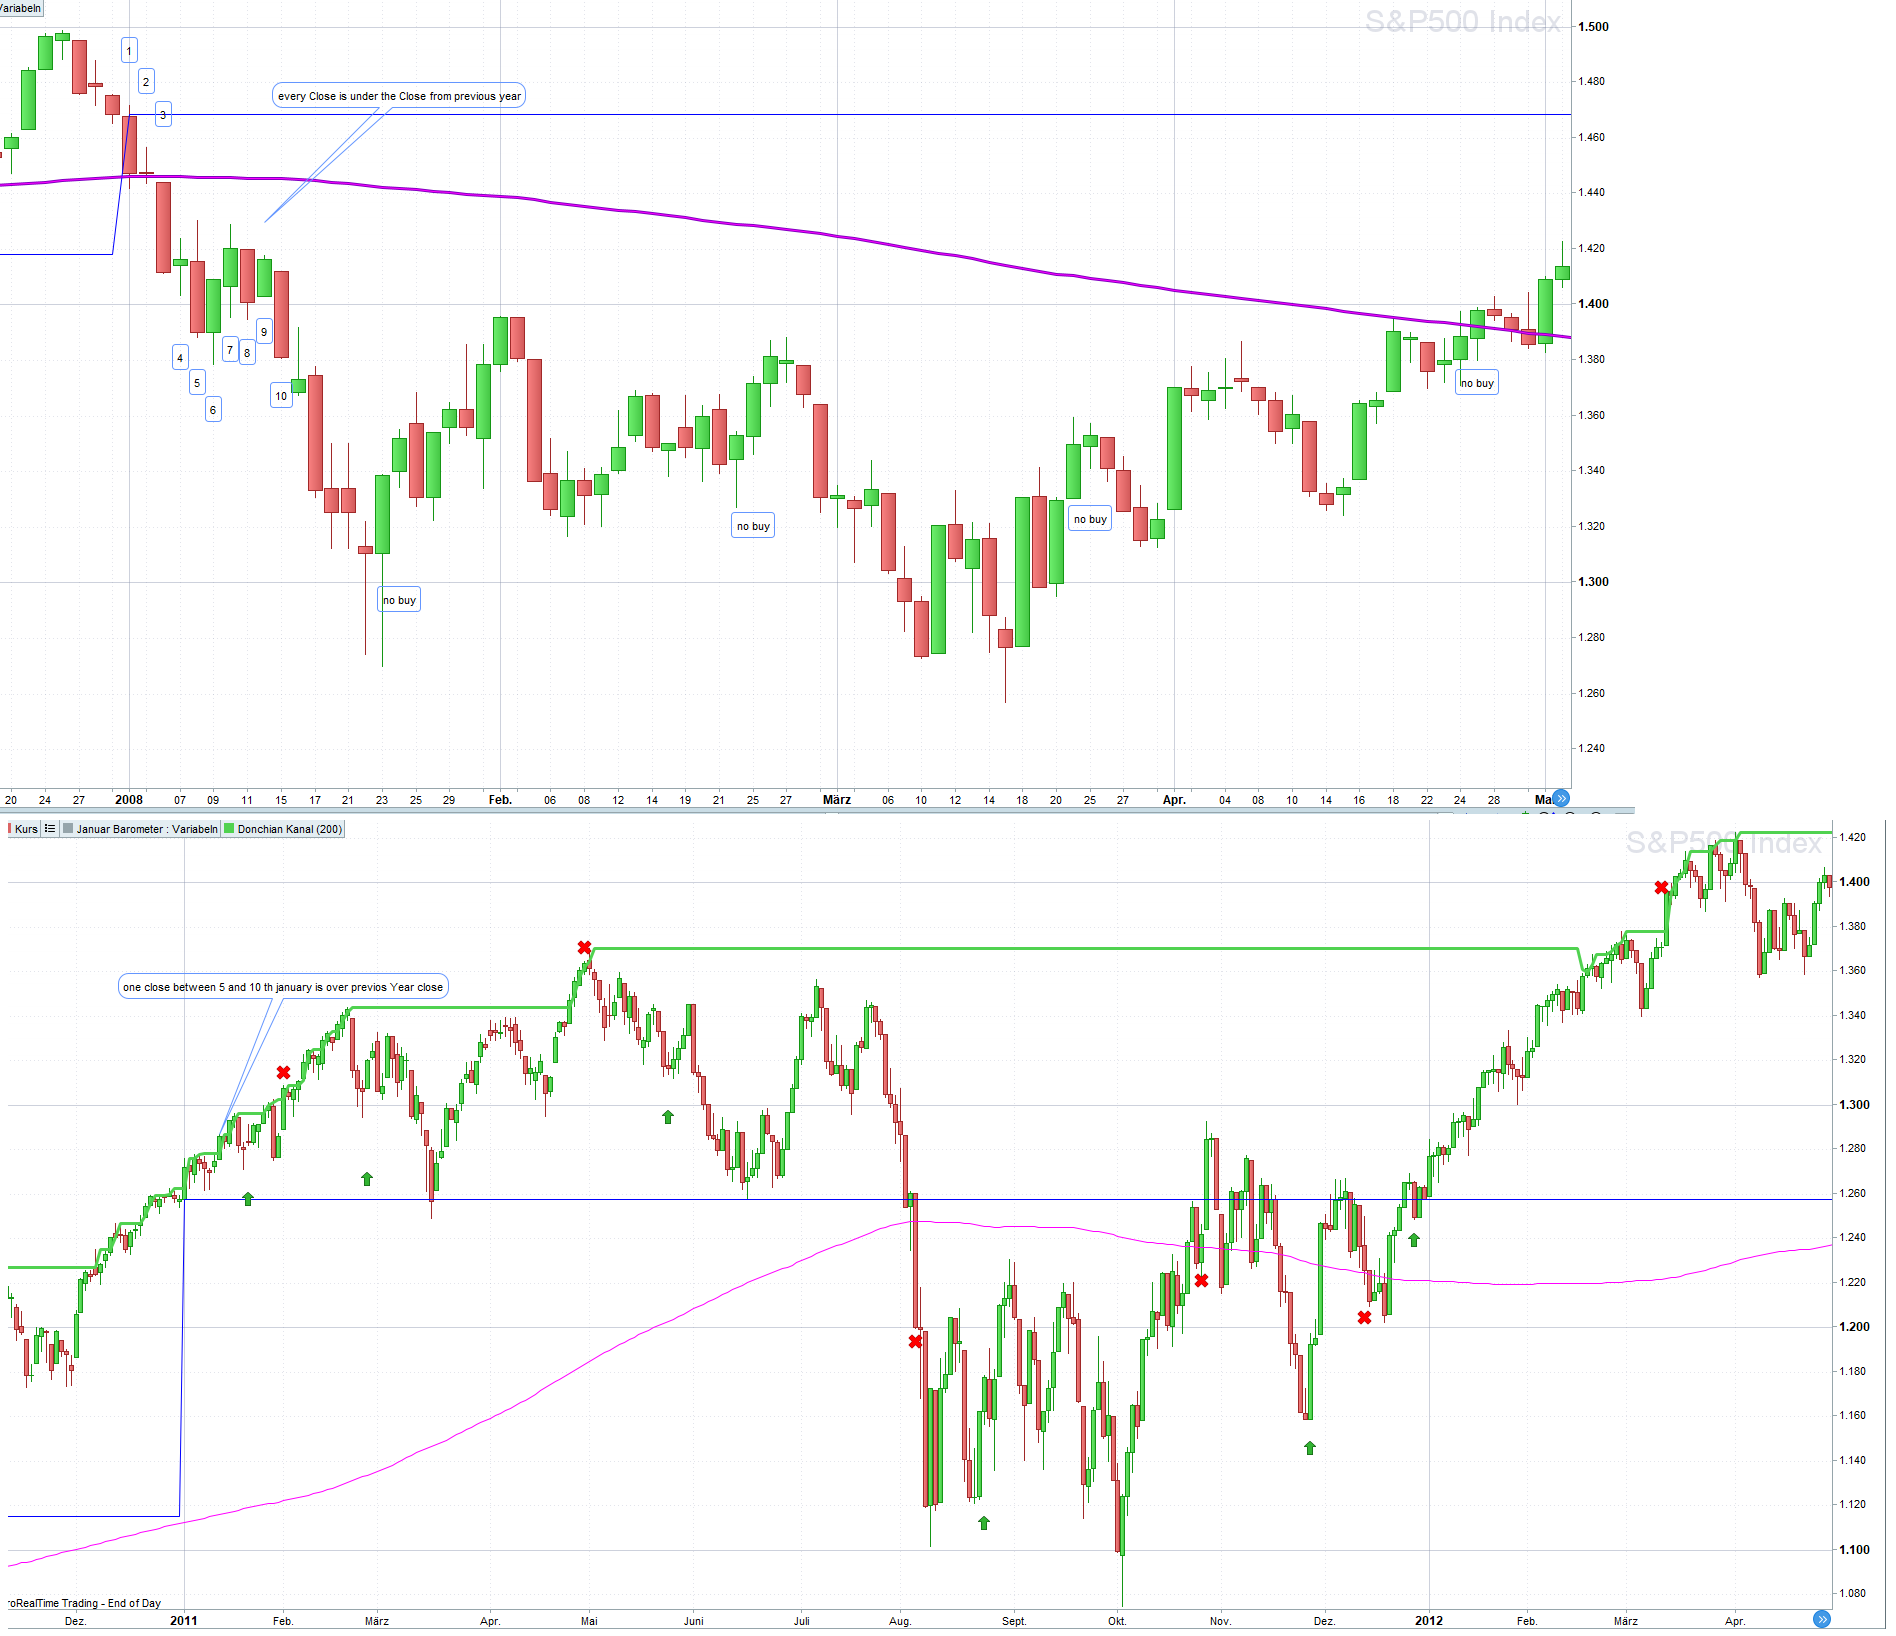
here I Have an example for the trade idea:
Year 2008: No close between 5th and 10 th january is higher than previous year close –> so in this year is no entry on every 25. of each month if not on the market. The january barometer say no good long year
Year 2011: at least one close between 5th and 10 th january is higher than previous year close -> So if you are not on the market you have to buy on every 25 th of every month in this year.
Exit one: sell if close is higher donchian 200 up
Exit SL: if course close goes unter the SMA200-3%
You see in 2011 there are some exits (red cross) and entry (green arrow). You also have to buy in this strategy when you are unter the previous year close ond 25 th August and on 25th of november.
I hope you understand it.
Thanks
There you go:
ONCE EntryDay  = 18
ONCE MonthDay1 = 5
ONCE MonthDay2 = 10
ONCE Tally     = 0
ONCE AboveFlag = 0

// ate the beginning of each year save the closing price of the previous year
IF OpenYear <> OpenYear[1] THEN
   YearClose = close[1]
   AboveFlag = 0
ENDIF

// at the beginning of each Month reset the tally of trading days to zero
IF (OpenMonth <> OpenMonth[1]) THEN
   Tally     = 0
ENDIF

// each new day updates the tally
IF (OpenDay <> OpenDay[1]) THEN
   Tally     = Tally + 1
ENDIF

// between day 5 and day 10 check if the price is above the previous Year's closing price
IF (Tally >= MonthDay1) AND (Tally <= MonthDay2) AND (OpenMonth = 1) THEN
   AboveFlag = max(AboveFlag,close > YearClose)
ENDIF

// enter after trading day 24 if conditions are met
IF (Tally > EntryDay) AND AboveFlag AND Not OnMarket THEN
   BUY 1 CONTRACT AT MARKET
ENDIF

// TAKE PROFIT: exit when the price closes below DONCHIAN UP
ONCE p = 20
Upper  = HIGHEST[p](HIGH[1])
TPflag = close > Upper
IF LongOnMarket AND TPflag THEN
   SELL AT MARKET
ENDIF

// STOP LOSS: exit when the price closes below (Sma200 - 3%)
Sma200 = average[200,0](close) * 0.97
SLflag = close < Sma200
IF LongOnMarket AND SLflag THEN
   SELL AT MARKET
ENDIF
// debugging section
graphonprice YearClose coloured("Blue")
graphonprice Sma200    coloured("Fuchsia")
//graph        Tally
//graph        AboveFlag