Bard
BardParticipant
Master
Hi
I was wondering if anyone had had any success with coming up with a good indicator for identifying range trading markets?
I came across something called the Choppiness Index but have not had any success in getting it to work in PRT.
It’d be great if someone knew how to code this into PRT?
It’s used by Randy Stuckey of Mindfire Systems and Catscan IV fame (see futures truth.com). He has a system that trend follows and then reverts to a range trading counter trend strategy.
Thanks in advance for any help.
https://www.tradingview.com/stock-charts-support/index.php/Choppiness_Index_(CHOP)
Hi Brad, I can have a look of the choppiness index indicator, and how to code it under prorealtime. I just have to figure out how to calculate “base 10 LOG” 🙂
The formula for the choppiness index is :
100 * LOG10( SUM(ATR(1), n) / ( MaxHi(n) - MinLo(n) ) ) / LOG10(n)
BardParticipant
Master
Much appreciated Nicolas, I hope it doesn’t tax you brain too much. (-:
BardParticipant
Master
Hello Nicholas,
Did you have any luck in getting the code to work for the Choppiness Index?
Thanks for posting the Kaufman Efficiency Ratio on here. Would it make the Ratio for effective if it was programmed to use the ATR instead of comparing daily closing price differences with the total difference between the opening and closing price for the period, is that possible?
Best
Brad
Sorry, i didn’t investigate already.
For the Kaufman efficiency ratio, you mean the ATR of the last period or the n period?
This version with 1 period (last one):
// parameter
 n = 10

Change = ABS(close - close[n])

calc = averagetruerange[1]

volat = summation[n](calc)

ER = Change / volat

RETURN ER as "Kaufman's Efficiency Ratio"
BardParticipant
Master
Thanks Nicolas
Okay, I am looking forward to seeing if Randy Stuckey’s Choppiness Index is better than the other indicators for Ranging Markets.
Can you think of any other good ways of indicating a market is going sideways and ranging which causes lots of losses in Trend Following systems?
I’ve looked at MACD and Moving Averages and ATR methods but without really finding an efficient way of stopping those losing sideways ranging trades.
Cheers for adding the ATR to the daily part of the calculation on the Kaufman Efficiency Ratio, I wasn’t sure if the total change from the beginning of the period to the end would also need an ATR summation? If that would make the indicator more efficient? Perhaps not, Im not sure..
I added the ATR part to the code but got this warning when running an existing backtest using the Kaufman Efficiency Ratio?
” Syntax error: The function “Kaufman Efficiency Ratio” called from “Percentage % Stop Loss +Kauf” must be called with an expression between parentheses (see “customClose” in help for more information) ”
The only way I “fixed it” was by recreating the system using the Assisted Creation tool. The Kaufman with ATR indicator works fine now.
Well, you know you are in a ranging market, when you are already in it. So sensing ranging market before it happens is like knowing the future.. and no one can do that 🙂
Maybe you should consider looking at different kind of channels (keltner, hurst, bollinger, enveloppes, etc..) and testing if they are above each other or not, in and out, etc.. They are all testing volatility, deviations, etc.. there might be something there.. 🙂
BardParticipant
Master
Thanks for the suggestions – I have looked at a few of them although I hadn’t heard of Hurts Envelopes and Super Cycles.
Are there any good leading indicators that can ‘predict’ the higher probability of a ranging markets?
I’m reading Cynthia Kase – Trading with the Odds. She uses a Peak Oscillator for market turns that has a look back for establishing the trend cycles — it statistically evaluates over fifty trend lengths and automatically adapts to both cycle length and volatility. If I asked for assistance with getting that code whilst waiting for the Choppiness Index code I think I would appear greedy? (:
p.s.
How do I find posts that I have replied to (like this one) without using the email url link, i.e. when I log in here where do I go once I am in my Profile & Posts?
Thanks Nicolas,
I have the same problem … In my profile my posts do not appear, although it does show a counter with the total number , but the rest shows like an empty page.
About Cynthia Kase, there is already an indicator from her in the library :
http://www.prorealcode.com/prorealtime-indicators/kase-dev-stop/
And for the Peak Oscillator, maybe you could point me to a description somewhere or copy/paste it here, it would save me some time, thank you 🙂
For the forums posts favorited and links, I’m actually working on that already, sorry for inconvenience!
BardParticipant
Master
Kase Dev Stop:
Thanks for posting the Dev Stop Nicolas, nice touch with the 10% and 20% volatility skew added to the double and triple std deviations calculation (p96 Cynthia Kase – Trading with the Odds).
It’s something I have been looking at (entries and Std Dev) and saw it a few days ago here when searching for “Kase’s Peak Oscillator.”
One thing though, I noticed when I applied the Dev Stop to my charts:
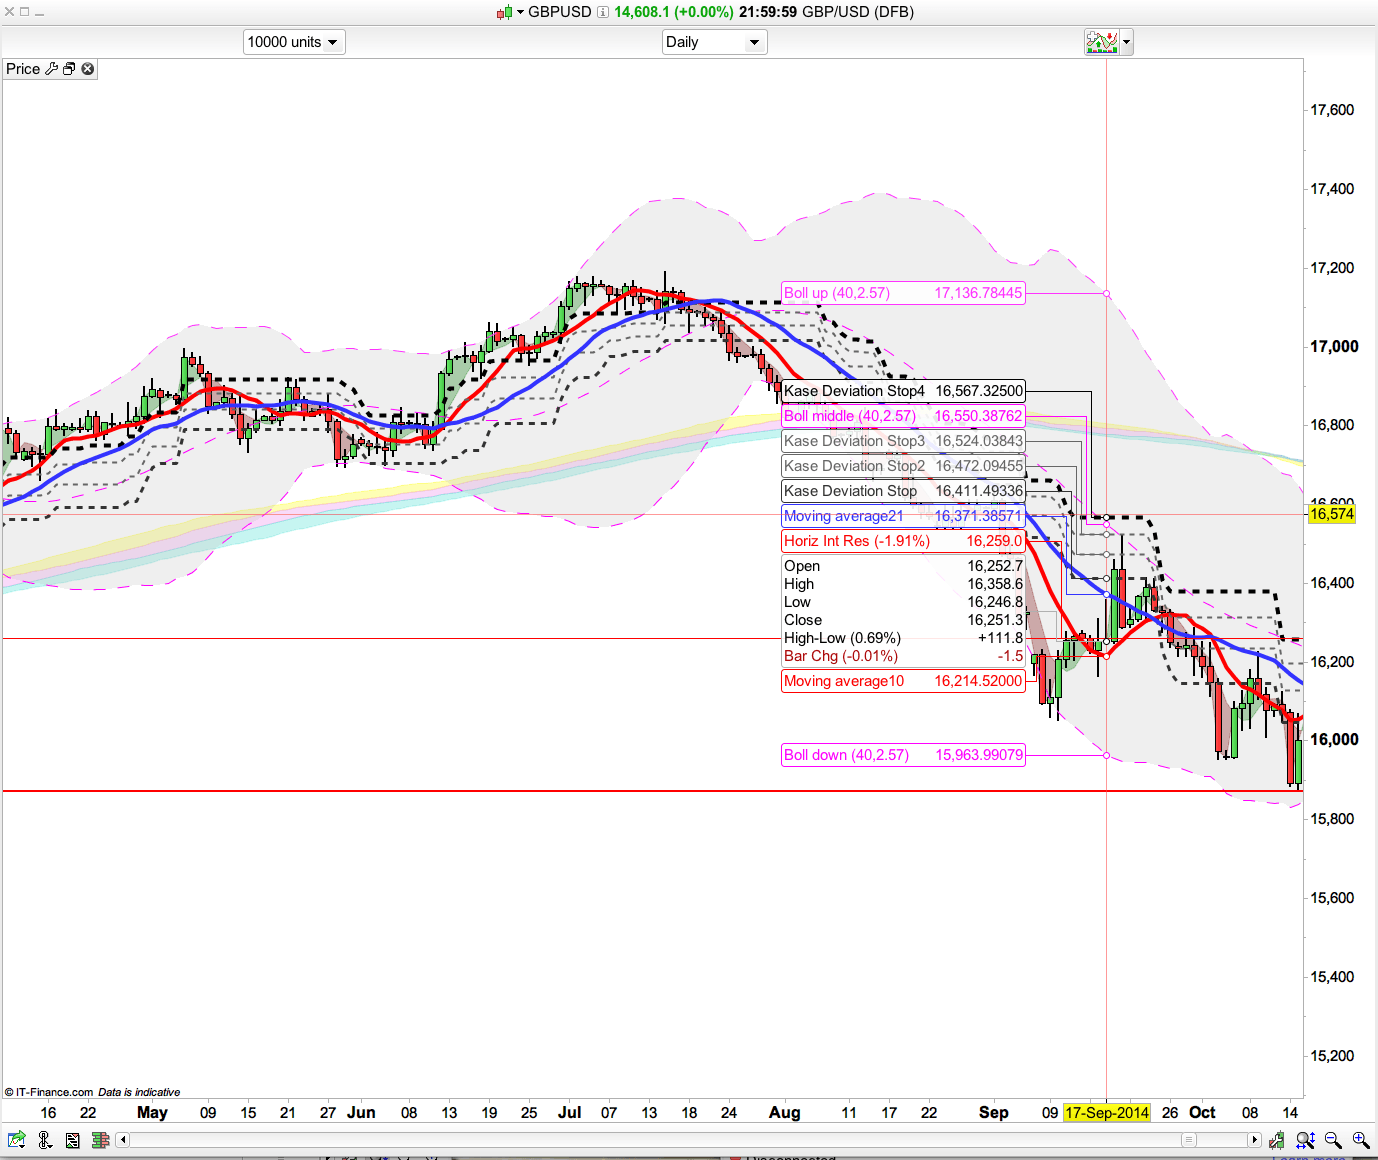
(1) There is no way of renaming the lines? eg Stop4/KDS4 is the “Warning Line” closest to price, isn’t it?
(2) Why doesn’t the “warning line” KDS4 cross underneath prices when the trend changes from long to short so that the “warning line” stays closest to the price (compared to the other 3 bands) and so the std deviation bands 2, 3, and 4 can then be further below the “warning line” as the price heads south? Pls see Kase chart and my chart.
Kase uses a simple double-moving average defaulted to 10 (red on my chart)- and 21-periods (blue on my chart) in the code to default the stops to either a long or short position.
Is that hard coded in the Dev Stop because I don’t see where that condition is within your code and why KD 1,2,3,4 all use “Highest[20](high-ATR)” ?
On my chart the thick black dotted KaseStop4 is now further away when the £/$ turns short whereas on the long part of the graph it was hugging close below the price i.e. as the first “warning line.”
Kase Peak Oscillator:
There aren’t a lot of ‘clues’ in her book as to how exactly it’s coded but it does look very interesting for the reasons mentioned below which are extracted from her remarkable book, Trading with the Odds:
On p77 – “Instead of using moving averages, one can determine mathematically whether a price series is serially dependent or independent. So our problem is solved by substituting a statistical measure of trend or serial dependency (in which each value in a series is either caused or affected by the preceding value), for the moving averages normally used in traditional oscillators. I call the resulting new indicator the Kase PeakOscillator. The mathematics is derived from a subset of probability theory called stochastic processes, which is separate and apart from the Stochastic indicator. Statisticians use the term stochastic to describe random models. (For the mathematical calculations behind this indicator, see below, “Stochastic Processes, Monte Carlo Simulations, and Random Walk Mathematics.“)
By substituting a statistical measure of trend for empirical measures, the indicator can be evaluated on a distribution curve and the 90th percentile can be chosen to determine overbought and over- sold regions without relying on local conditions. This allows identification of many market turns, which traditional indicators miss.”
and..
“The PeakOscillator also catches divergences often missed by other indicators because it is based on a measure of serial dependency over a look-back length that adapts automatically to the most significant cycle length. This indicator performs a more thorough analysis of the market and, therefore, generates superior results.”
and..
On p78 – “Currently, with the substitution of good math, there is an indicator that can be tested statisti- cally on an isolated, stand-alone basis. In fact, the indicator basically tests itself in that the value of the PeakOscillator in soybeans in 1985, for example, can be compared with the value of crude oil in 1995. This allows a trader to evaluate the indicator over many years of commodity history and determine a probability distribution for the PeakOscillator. (I tested my PeakOscillator over a history of 80 years.1 ‘The level which constitutes the 90th percentile of momen- tum (plus or minus) over this history provides a true measure of overbought and oversold conditions for this indicator.
In addition to plotting the PeakOscillator, a PeakOut line can be displayed. The PeakOut line is drawn at the 90th percentile (determined historically) or at a default of two standard deviations above the mean local data (about the 98th percentile of the local data), whichever is greater. Thus, by definition, if momentum peaks through the PeakOut line and then pulls back, there is a 90 per- cent chance of either a turn or a penultimate peak preceding a divergence.
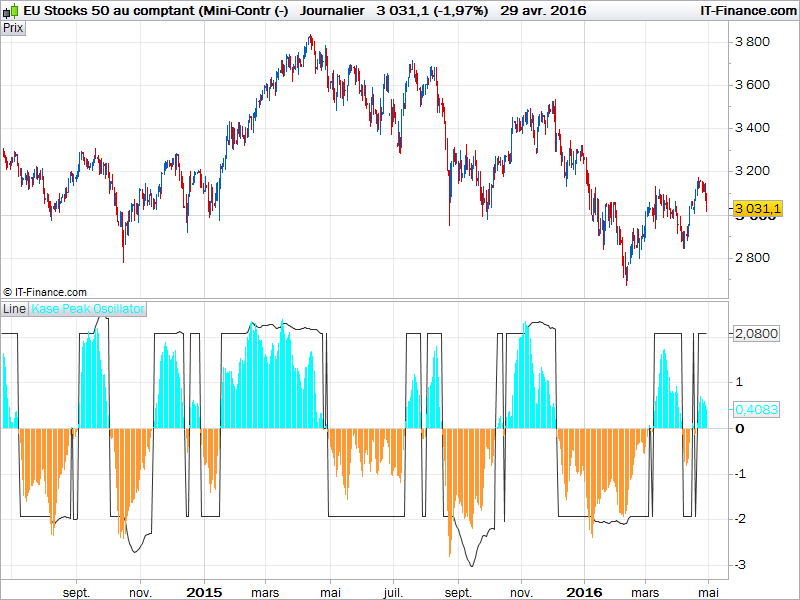
A principal value of the PeakOscillator is the ability to identify non-divergent turns that all other momentum indicators miss, using the PeakOut signal, or the point at which the histogram penetrates the PeakOut line and then pulls back. I indicate valid PeakOuts automatically with a darker line in the histogram (shown in Figure 5-l). The computer determines when PeakOuts occur.
The PeakOscillator also catches divergences often missed by other indicators because it is based on a measure of serial dependency over a look-back length that adapts automatically to the most significant cycle length. This indicator performs a more thorough analysis of the market and, therefore, generates superior results.”
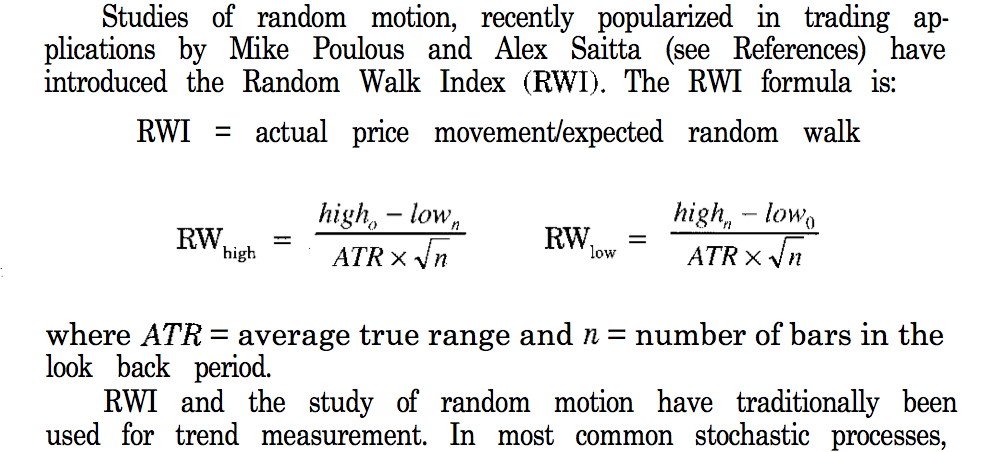
Kase then goes on to talk about the Random Walk Index on p87
and..
On p90 – “Thus, a minimum of 30 periods is employed when evaluating the range since the triple-smoothing uses computer power for little improvement.
The RWI, with our correction, forms the basis for the mathematics used in calculating the Kase PeakOscillator.” You may wish to delete part of this for copyright reasons.
Thanks Nicolas, I hope this and the Choppiness Index don’t take up too much of your time, both look superior to the standard indicators in trading s/ware packages and should help traders on this forum.
p.s. Will PRT be adding Displaced Moving Averages to the Backtest?
Best
Brad
Hello Brad, thanks for this explanation.
If I understand correctly the Kase Peak Oscillator is a bounded oscillator made of percentile rank … of something 🙂 We can calculate the percentile rank of anything (any values). The percentile rank is the rank in percentage of the current value over the last n period values.
I found code from another platform that I converted to prorealtime. Please find attached the oscillator code below.
KPeriod = 30
sq = sqrt(KPeriod)
rge = averagetruerange[KPeriod]
RWHL = ((High-Low[KPeriod])-(High[KPeriod]-Low)) / (rge*sq)
Pk = weightedaverage[3](RWHL)
mnn = average[KPeriod](Pk)
dSum=0
for i = 0 to KPeriod do
dSUM = dSUM+(Pk[i]-mnn)*(Pk[i]-mnn)
next
sd = sqrt(dSUM/KPeriod)
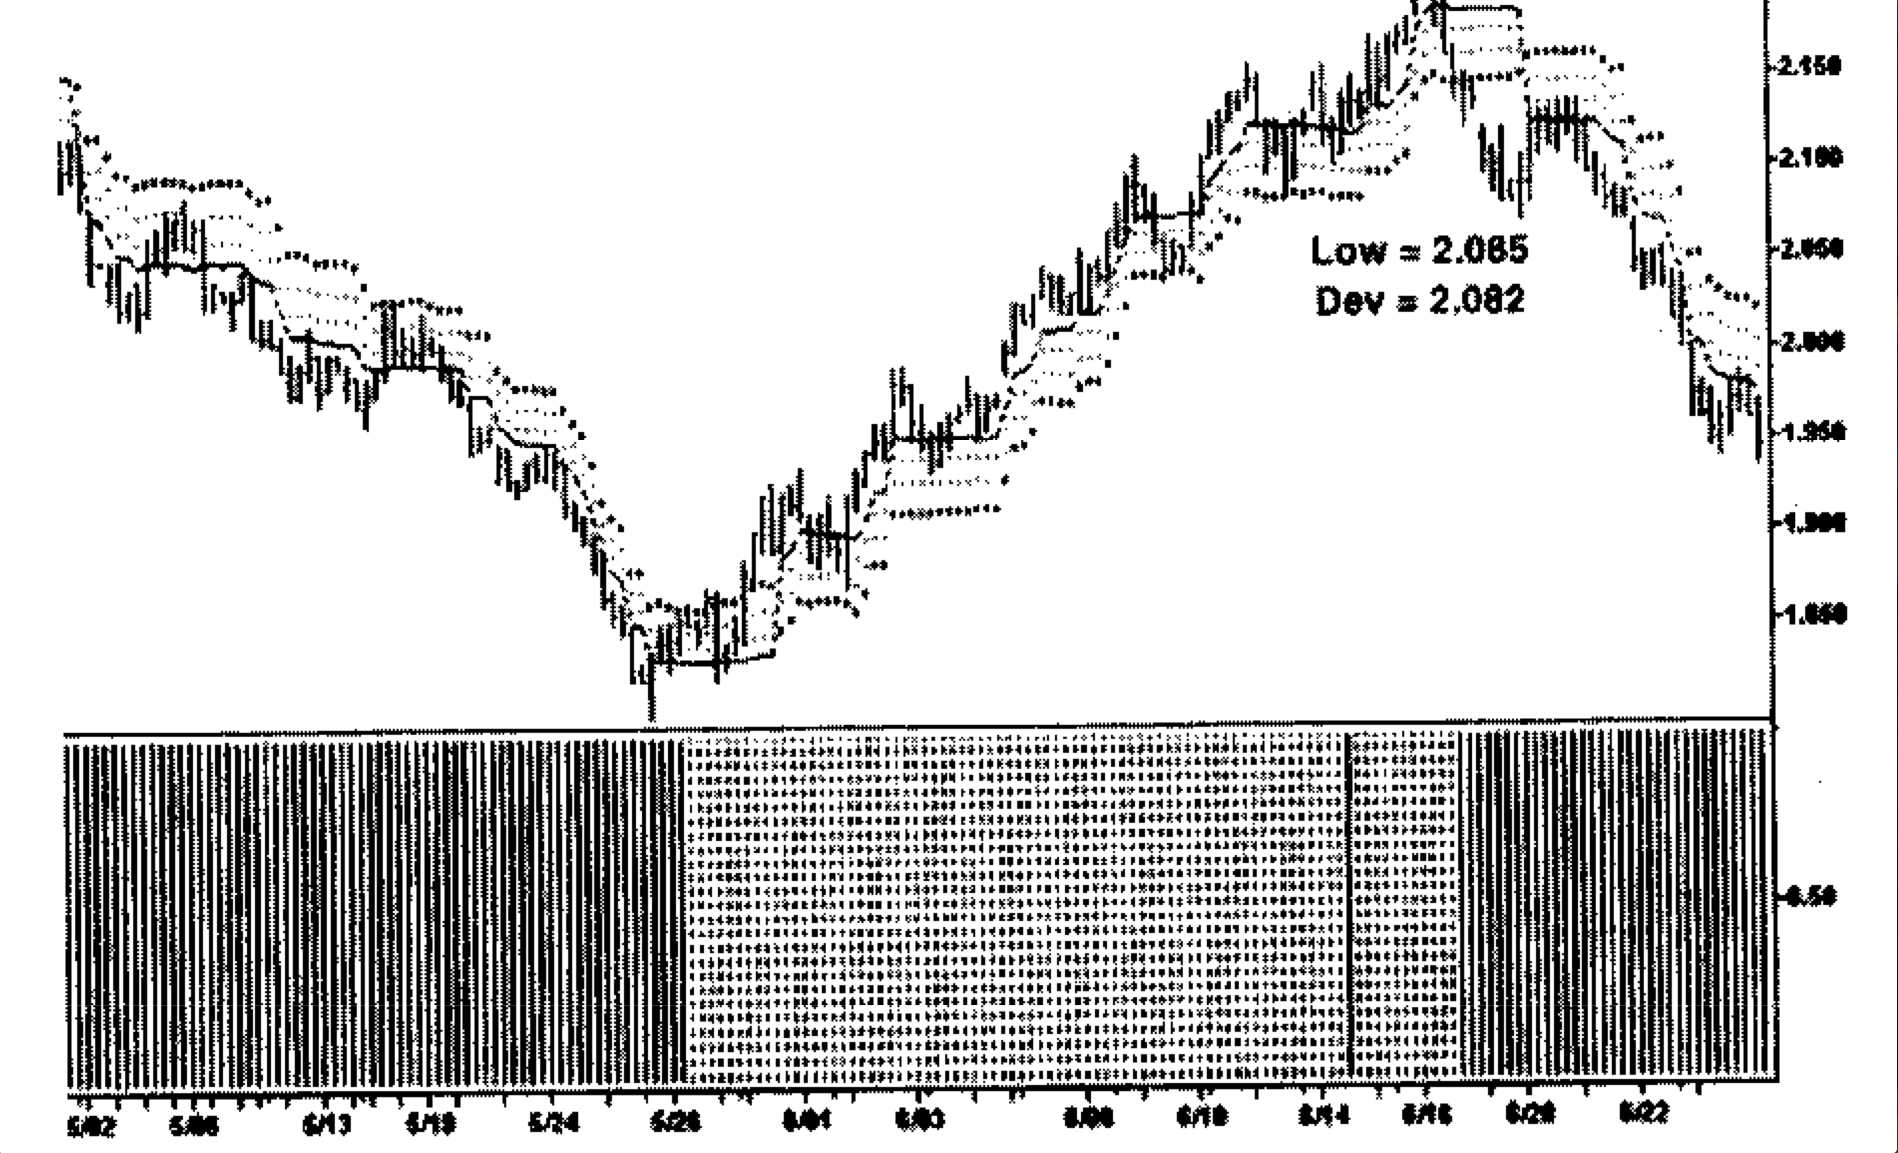
v1 = MAX(2.08,mnn+(1.33*sd))
v2 = MIN(-1.92,mnn-(1.33*sd))
if (pK[1]>=0 and pK>0) then
Line = v1
elsif (pK[1]<=0 and pK<0) then
Line = v2
else
Line = 0
endif
RETURN Line as "Line", pK as "Kase Peak Oscillator"
About the Kase Dev Stop, sorry but I don’t have any clues of what’s causing some changes or weird behaviour of it. I’ll investigate maybe later. And for the displaced moving average … I think that’s not an hurry for the moment for the development team 🙂 but I can be wrong too!
Anyway, I’ll add this new oscillator to the library.
BardParticipant
Master
Thanks very much for posting this Nicolas. I found a pdf link to the book that explains it in full and how it relies on the “Kase Twist” – p89 and a modified Random Walk Index Equation on p 87:
http://stocksfirst.com/books/trading-econ-investing/Cynthia%20Kase%20-%20Trading%20With%20The%20Odds%5B1%5D.pdf
I was wondering which part of your code makes the indicator look back and choose the right cycle length/period, as the kase Peak Oscillator has a look-back length that adapts automatically to the most significant cycle length? i.e. “it is based on a measure of serial dependency over a look-back length that adapts automatically to the most significant cycle length.”
This means: “the indicator basically tests itself in that the value of the PeakOscillator in soybeans in 1985, for example, can be compared with the value of crude oil in 1995. This allows a trader to evaluate the indicator over many years of commodity history and determine a probability distribution for the PeakOscillator.” (Kase tested her PeakOscillator over a history of 80 years.)
Lastly where does the “2.08” value come from and why is there a 33% addition to the std deviation?
(I remember Kase added a skew on the Dev Stop for the 2nd and 3rd Std Deviations).
Cheers, once again for your help,
Best
Brad
BardParticipant
Master
p.s. I appreciate that: “The PeakOut line (the flat squarish line in your image) is drawn at the 90th percentile (determined historically) or at a default of two standard deviations above the mean local data (about the 98th percentile of the local data), whichever is greater. Thus, by definition, if momentum peaks through the PeakOut line and then pulls back, there is a 90 per- cent chance of either a turn or a penultimate peak preceding a divergence.”
Honestly, I came across various codes of this indicator around internet and each one use this 2.08 value and this 33% addition. I have just converted it, the same way as others coders has understood how it should be done.
The peakout line is drawn historically but with max and min value that cannot be more or less the 2.08 and -1.92 you pointed before.
If you want a more accurate statistical result, you should increase the KPeriod to whatever you’d like to lookback in the past.
I coded yesterday an ATR percentile rank which could be something you might be interested in for range filtering and/or for ‘calm before storm’ stocks finder.. I’ll post it by tomorrow or so.