Changing TMA Slope indicator by Nicolas to appear on candle sticks!!

Viewing 7 posts - 16 through 22 (of 22 total)
  • Author
    Posts
  • #89970 quote
    NicolasNicolas
    Keymaster
    Legend

    [attachment file=89971]

    #89973 quote
    NicolasNicolas
    Keymaster
    Legend

    😆 ok, more seriously, I’ll try to fix it tomorrow.

    #89994 quote
    crolakstradingcrolakstrading
    Participant
    Senior

    😉 sorry again to bother you.. promise that will be the last thing i ask you on this!!! thanks in advance

    #90013 quote
    NicolasNicolas
    Keymaster
    Legend

    Here is the code and commented, I’m sure you’ll find easily where to change color depending of the conditions of where is the curve:

    // --- settings
    eintPeriod = 20
    edblHigh1 = 0.04
    edblLow1 = -0.04
    atrPeriod = 100
    // --- end of settings
    
    atr = AverageTrueRange[atrPeriod](close)
    
    dblTma = TriangularAverage[eintPeriod](close)
    
    if barindex>eintPeriod then
    dblPrev = dblTma[1]
    gadblSlope = ( dblTma - dblPrev ) / atr
    
    //BUY ONLY
    if ( gadblSlope[0] > edblHigh1 ) then //above the higher line
    if(close < open) then
    drawcandle(open,high,low,close)coloured(0,128,0) //light blue
    else
    drawcandle(open,high,low,close)coloured(0,255,0) //dark blue
    endif
    //SELL ONLY
    elsif ( gadblSlope[0] < edblLow1 ) then //below the lower line
    if(close < open) then
    drawcandle(open,high,low,close)coloured(255,0,0) //light red
    else
    drawcandle(open,high,low,close)coloured(178,34,34) //dark red
    endif
    else //ranging between the 2 lines
    if(gadblSlope[0] < gadblSlope[1]) then 
    drawcandle(open,high,low,close)coloured(255,105,180) //curve is declining
    else
    drawcandle(open,high,low,close)coloured(128,128,128) //curve is ascending
    endif
    endif
    endif
    
    return

    Sorry but i’m still struggling to understand what you need exactly about the colors 🙂

    #90062 quote
    crolakstradingcrolakstrading
    Participant
    Senior
    sorry im confusing you.. this great as it is and now more clear!! it just last two in the code //the ranging between the 2 lines.
    lets say
    if(gadblSlope[0] < gadblSlope[1]) then
    drawcandle(open,high,low,close)coloured(255,105,180) //curve is declining (Pink to go Dark pink if close < open) 


    and
    drawcandle(open,high,low,close)coloured(128,128,128) //curve is ascending (grey to go dark grey if  close > open)


    sorry again for complicating…. i think happy with you created already!! thank you nicolas
    #90134 quote
    NicolasNicolas
    Keymaster
    Legend

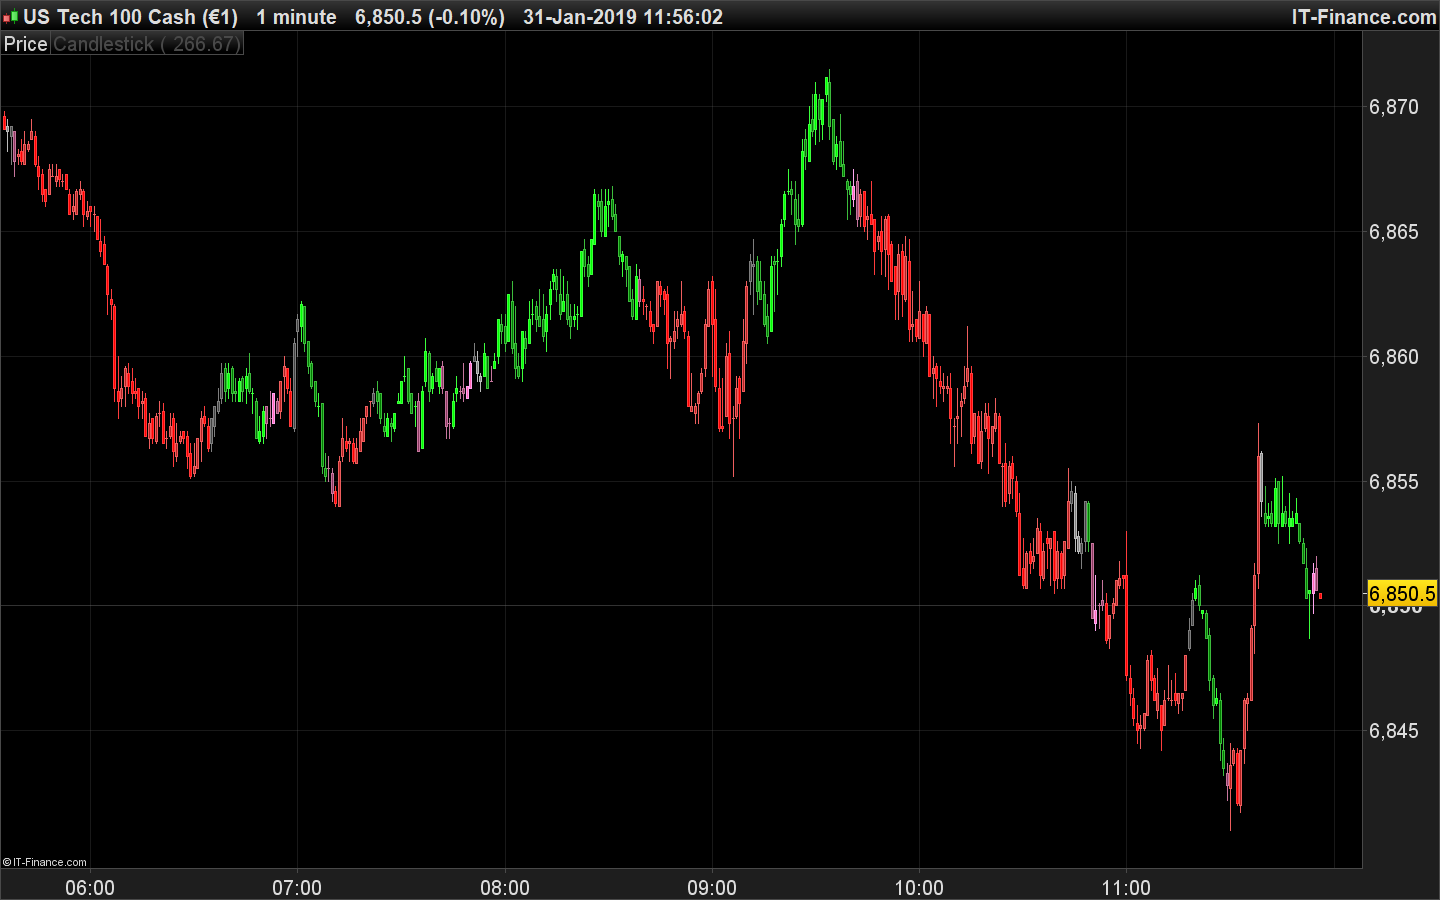
    Hopefully this new code will be the good one!! 😆

    // --- settings
    eintPeriod = 20
    edblHigh1 = 0.04
    edblLow1 = -0.04
    atrPeriod = 100
    // --- end of settings
    
    atr = AverageTrueRange[atrPeriod](close)
    
    dblTma = TriangularAverage[eintPeriod](close)
    
    if barindex>eintPeriod then
    dblPrev = dblTma[1]
    gadblSlope = ( dblTma - dblPrev ) / atr
    
    //BUY ONLY
    if ( gadblSlope[0] > edblHigh1 ) then //above the higher line
    if(close < open) then
    drawcandle(open,high,low,close)coloured(0,128,0) //light blue
    else
    drawcandle(open,high,low,close)coloured(0,255,0) //dark blue
    endif
    //SELL ONLY
    elsif ( gadblSlope[0] < edblLow1 ) then //below the lower line
    if(close < open) then
    drawcandle(open,high,low,close)coloured(255,0,0) //light red
    else
    drawcandle(open,high,low,close)coloured(178,34,34) //dark red
    endif
    else //ranging between the 2 lines
    if(gadblSlope[0] < gadblSlope[1]) then
    if close>open then 
    drawcandle(open,high,low,close)coloured(255,105,180) //curve is declining and close>open
    else
    drawcandle(open,high,low,close)coloured(139,58,98) //curve is declining and close<open
    endif
    else
    if close<open then 
    drawcandle(open,high,low,close)coloured(128,128,128) //curve is ascending and close<open 
    else
    drawcandle(open,high,low,close)coloured(66,66,66) //curve is ascending and close>open
    endif
    endif
    endif
    endif
    
    return
    
    crolakstrading thanked this post
    candlesticks-color-tma-slope.png candlesticks-color-tma-slope.png
    #90268 quote
    crolakstradingcrolakstrading
    Participant
    Senior

    Wow… This exactly what i was trying to explain!!! thanks a million Nicolas.. this can be really used as a trading system!! need to change numbers and try!! thank you again!!

Viewing 7 posts - 16 through 22 (of 22 total)
  • You must be logged in to reply to this topic.
ProRealAI ProRealAI New

Stuck on this ProBuilder code?

Describe what this topic is trying to build, in plain English, and ProRealAI writes the ProRealTime™ indicator, screener or system for you.

Available in 7 languages
Try ProRealAI

Changing TMA Slope indicator by Nicolas to appear on candle sticks!!

ProBuilder: Indicators & Custom Tools

New Reply
Author
Summary

This topic contains 21 replies,
has 3 voices, and was last updated by crolakstradingcrolakstrading
7 years, 8 months ago.

Topic Details
Forum: ProBuilder: Indicators & Custom Tools
Language: English
Started: 12/25/2018
Status: Active
Attachments: 4 files
ProRealCode ProRealCode
Loading...