I thought I would start a new thread for this one as it’s a little different and keeps things a bit more organised. Ok Nicolas?
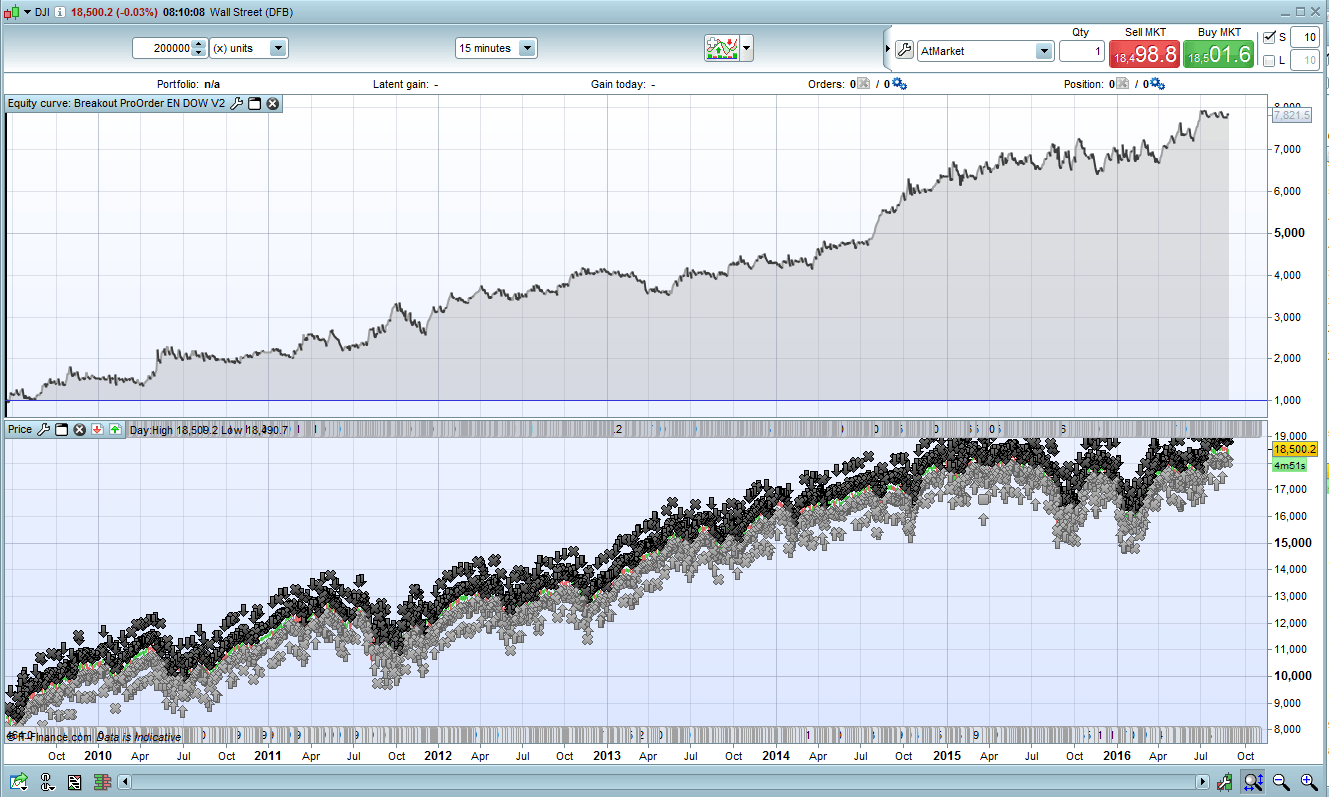
The DOW did not seem to like the first 30min breakout. This had me stuck for a while so I tried a few different things. It prefers the first hour BUT we exclude the first 15min candle.
Optimised to June 2014 IN/OUT Sample
£1pp Fixed position size. £1000 starting capital. 1.8 Spread.
Let me know your thoughts or if we can improve further.
// We do not store datas until the system starts.
// If it is the first day that the system is launched and if it is afternoon,
// it will be waiting until the next day for defining sell and buy orders

//UK TIME ZONE

DEFPARAM PreLoadBars = 0
// Position is closed at 20:30
DEFPARAM FlatAfter = 203000
// No new position will be initiated after the 19:45 candlestick
LimitHour = 200000
// Market scan begin with the 15 minute candlestick that closed at 15:30
StartHour = 151500
// The 24th and 31th days of December will not be traded because market close before 7h45 PM
IF (Month = 5 AND Day = 1) OR (Month = 12 AND (Day = 24 OR Day = 25 OR Day = 26 OR Day = 30 OR Day = 31)) THEN

TradingDay = 0
ELSE
TradingDay = 1
ENDIF
// Variables that would be adapted to your preferences
if time = 144500 then

//PositionSize = max(2,2+ROUND((strategyprofit-1000)/1000)) //gain re-invest trade volume
PositionSize = 1 //constant trade volume over the time
endif
MaxAmplitude = 160
MinAmplitude = 20
OrderDistance = 4
PourcentageMin = 35

// Variable initilization once at system start
ONCE StartTradingDay = -1
// Variables that can change in intraday are initiliazed
// at first bar on each new day
IF (Time <= StartHour AND StartTradingDay <> 0) OR IntradayBarIndex = 0 THEN
BuyTreshold = 0
SellTreshold = 0
BuyPosition = 0
SellPosition = 0
StartTradingDay = 0
ELSIF Time >= StartHour AND StartTradingDay = 0 AND TradingDay = 1 THEN
// We store the first trading day bar index
DayStartIndex = IntradayBarIndex
StartTradingDay = 1
ELSIF StartTradingDay = 1 AND Time <= LimitHour THEN
// For each trading day, we define each 15 minutes
// the higher and lower price value of the instrument since StartHour
// until the buy and sell tresholds are not defined
IF BuyTreshold = 0 OR SellTreshold = 0 THEN
HighLevel = Highest[IntradayBarIndex - DayStartIndex + 2](High)
LowLevel = Lowest [IntradayBarIndex - DayStartIndex + 2](Low)
// Spread calculation between the higher and the
// lower value of the instrument since StartHour
DaySpread = HighLevel - LowLevel
// Minimal spread calculation allowed to consider a significant price breakout
// of the higher and lower value
MinSpread = DaySpread * PourcentageMin / 100
// Buy and sell tresholds for the actual if conditions are met
IF DaySpread <= MaxAmplitude THEN
IF SellTreshold = 0 AND (Close - LowLevel) >= MinSpread THEN
SellTreshold = LowLevel + OrderDistance
ENDIF
IF BuyTreshold = 0 AND (HighLevel - Close) >= MinSpread THEN
BuyTreshold = HighLevel - OrderDistance
ENDIF
ENDIF
ENDIF
// Creation of the buy and sell orders for the day
// if the conditions are met
IF SellTreshold > 0 AND BuyTreshold > 0 AND (BuyTreshold - SellTreshold) >= MinAmplitude THEN
IF BuyPosition = 0 THEN
IF LongOnMarket THEN
BuyPosition = 1
ELSE
BUY PositionSize CONTRACT AT BuyTreshold STOP
ENDIF
ENDIF
IF SellPosition = 0 THEN
IF ShortOnMarket THEN
SellPosition = 1
ELSE
SELLSHORT PositionSize CONTRACT AT SellTreshold STOP
ENDIF
ENDIF
ENDIF
ENDIF
// Conditions definitions to exit market when a buy or sell order is already launched
IF LongOnMarket AND ((Time <= LimitHour AND SellPosition = 1) OR Time > LimitHour) THEN
SELL AT SellTreshold STOP
ELSIF ShortOnMarket AND ((Time <= LimitHour AND BuyPosition = 1) OR Time > LimitHour) THEN
EXITSHORT AT BuyTreshold STOP
ENDIF
// Maximal risk definition of loss per position
// in case of bad evolution of the instrument price
SET STOP PLOSS MaxAmplitude
//set target pprofit //70 //160
Don’t worry, I like things organised too 🙂
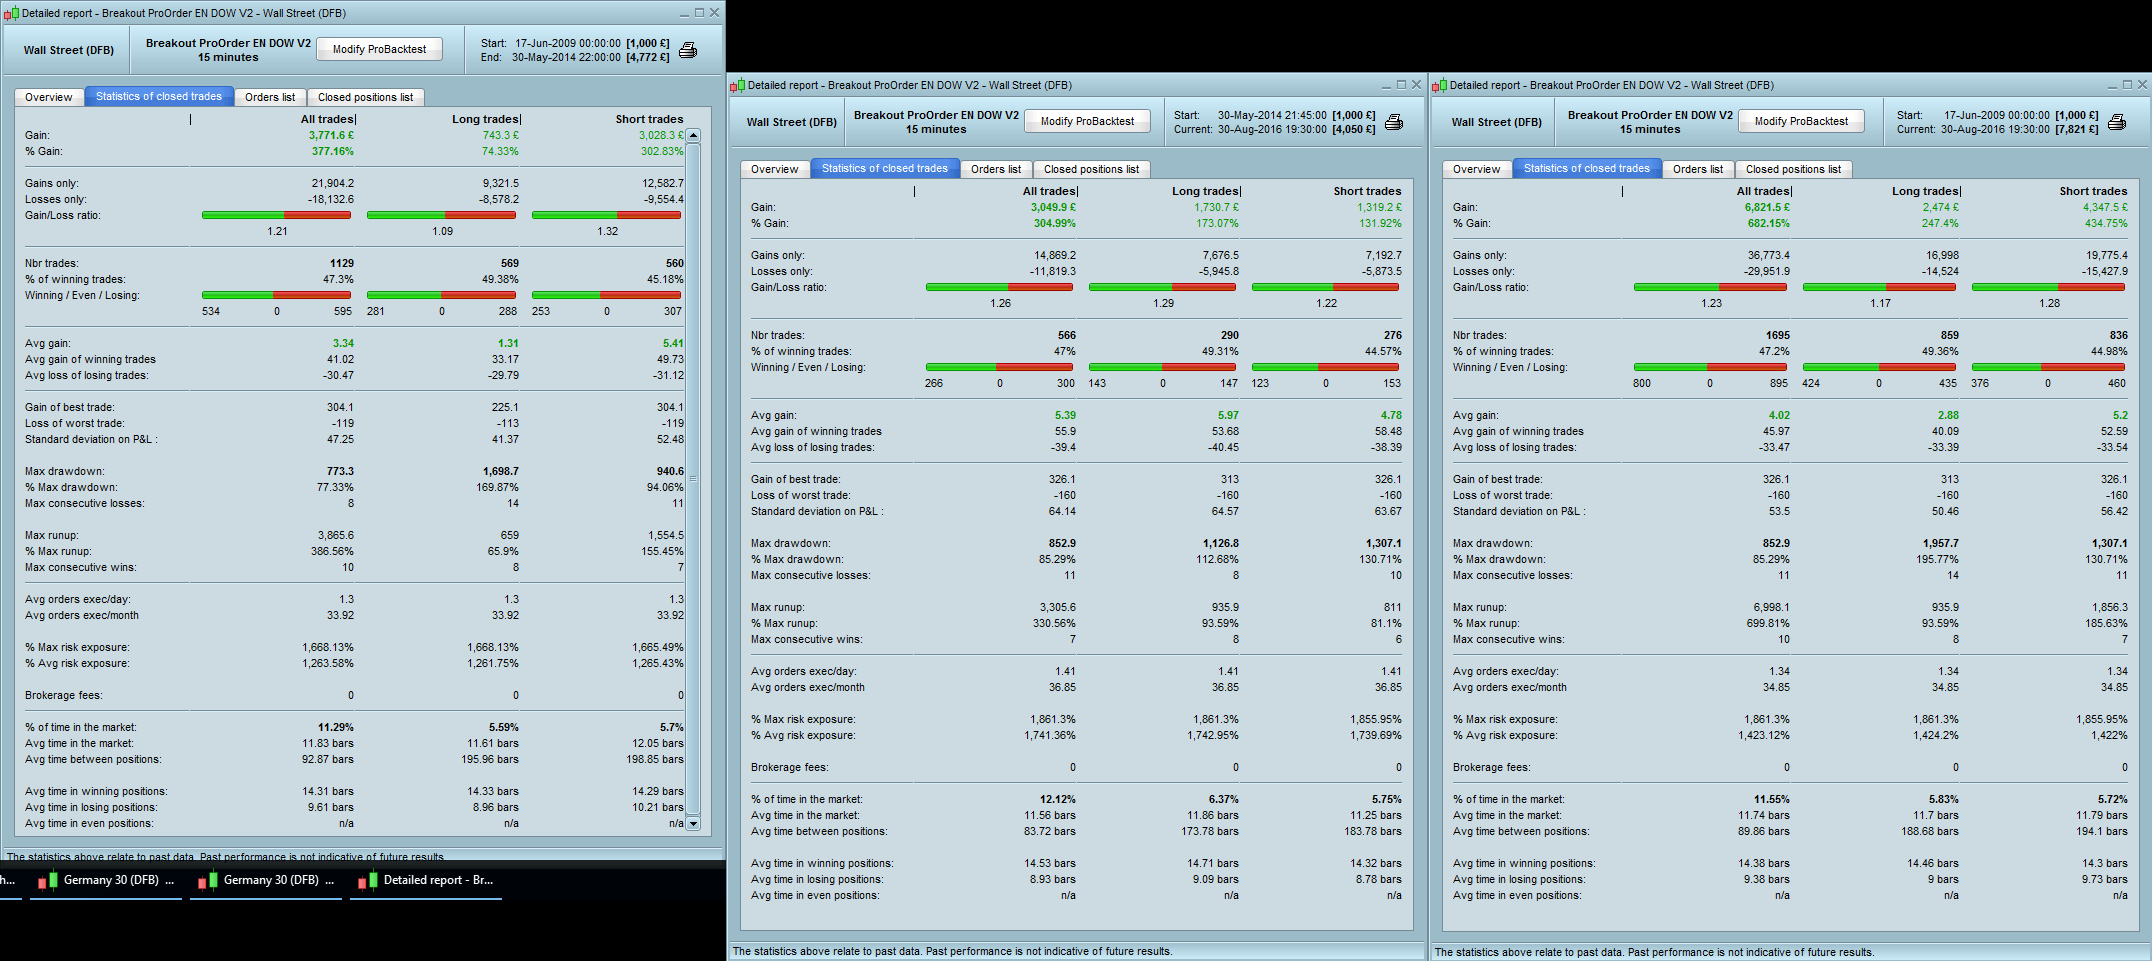
Thanks for this new version of the now famous breakout strategy! To have a better clue if the optimized OOS area have the same behaviour of the IS one, you can make a comparison of how much average trades you have on the 2 samples. Once you get that, you can also have a look on trades symmetry comparison : BUY quantity vs SELL quantity ratio.
I will leave this here to compare later.
Well, the trades symmetry seems good between OOS and IS (the first 2 screenshots on the left), the average buy gain is higher though, I believe it is due to 2015 bullish rally on whole indices. Maybe you could test only 2015 period to see what happen between long and short average gain. Good job Cosmic1!