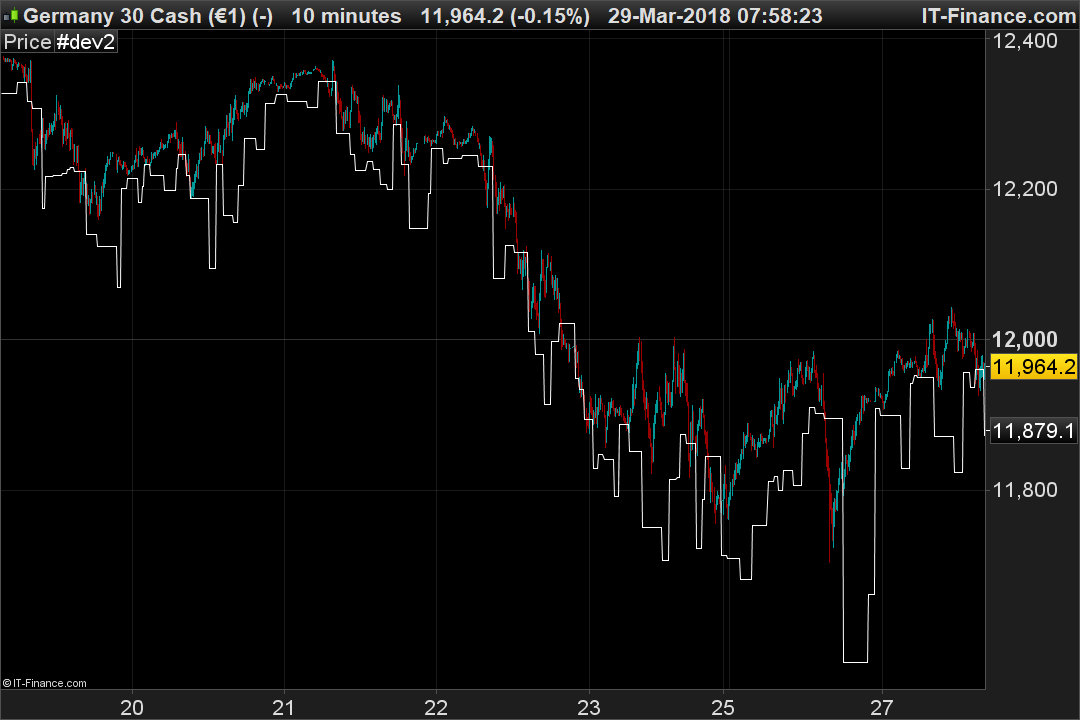
Hi, I’d like to create a graphical representation for buy/sell zones. I’d like to do this using a support/res code that I made. It’s based on PSAR so that it doesn’t look ahead and can be used for backtesting. The line is shifted 8 bars to the right. If it works maybe I can add it to the library.
Idea is that a close under the line is in the buy zone, or maybe a cross above = buy. Any thoughts how I can improve it? Thanks.
//suggested parameters for x,y,z are 1,1,1

PSAR = SAR[x,y,z]

IF close crosses under PSAR then
a = PSAR
endif

If close crosses over PSAR then
b = PSAR
endif

if close<PSAR then
p = b-(a-b)
endif

return p[8] coloured (0,0,0)

//IF  close crosses under p then
//DRAWARROWup(barindex, low) COLOURED(255,255,255)
//ENDIF
Thank you, I tried your indicator but found it difficult to know how to interpret this support/resistance line?
The plotted line is just the buy zone; haven’t done the sell zone yet. It works a bit like Bollinger bands.
If you add a parameter ‘x’ to this line:
return p[8] coloured (0,0,0)
…you can shift it around and find where it gives the best signals. I like to buy when it crosses back above the line from oversold.
Oh I understand now, looking forward for the next step of your development 🙂
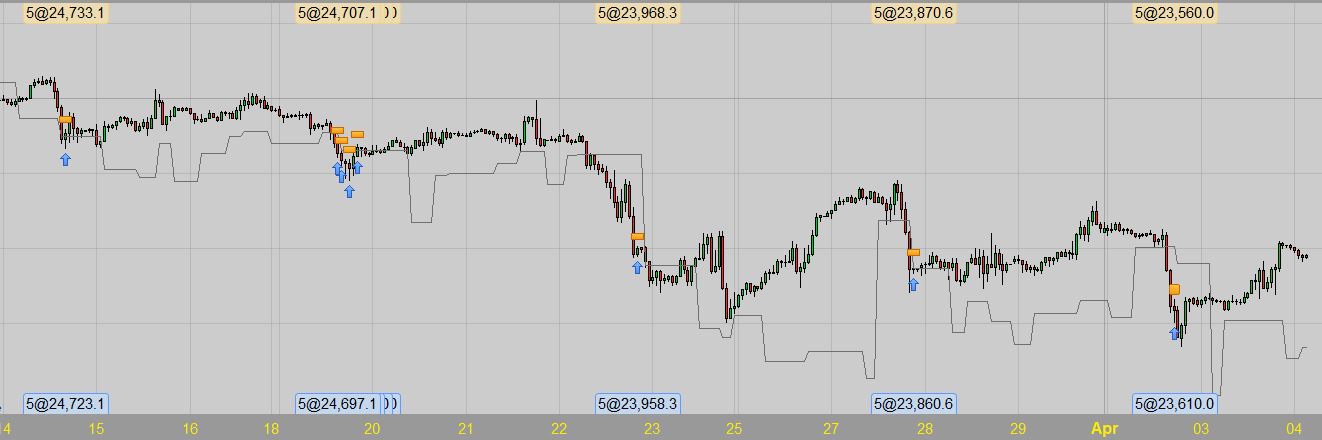
This version adds high volume down bar as a buy condition. Nicolas, would you mind backtesting on more data please? I only have limited data through IG.
// https://www.prorealcode.com/topic/how-to-highest10volume-but-only-of-down-bars/
// Today's volume should be larger than the volume of the highest down day over the last 40 days
DEFPARAM CumulateOrders = False // Cumulating positions deactivated
maxDay = 40

maxDownDay = 0

maxDown = 0

FOR d = 1 TO maxDay DO

r = Close[d] - Open[d]

IF r < 0 and Volume[d] > maxDown THEN

maxDown = Volume[d]

maxDownDay = d

ENDIF

NEXT

IF maxDownDay = 0 THEN

maxDownDayVol = 0

ELSE

maxDownDayVol = Volume[maxDownDay]

ENDIF

cVol2 = (Volume > maxDownDayVol)// sample screener code

///////////////////////////////////////////////////////////////////////
/////////////////////////////////////////////////////////////////////////
////////////////////////////////////////////////////////////////////////
// Conditions to enter long positions
indicator1  = CALL "SAR supp line"[2, 0.2, 10, 3]
c1 = (close < indicator1) //or close<indicator1[1] or close<indicator1[2] or close<indicator1[3]

IF c1   and cVol2 THEN
BUY 5 CONTRACT AT MARKET
ENDIF

// Conditions to exit long positions
indicator2 = CALL "SAR res line"[2, 0.2, 2, 3]
c2 = (close >= indicator2)

IF c2 THEN
SELL AT MARKET
ENDIF

// Stops and targets
//sET STOP pTRAILING 20  //pLOSS 50 //
SET TARGET pPROFIT 10
What I am supposed to backtest please? (instrument, timeframe..). I also do not have your indicator on my platform 🙂 (SAR supp line and SAR res line)..
You should add the .itf file in your next post, it will come with the indicators as well.
Overwhelmed now. Have to do it another time.
Add n and n1 to price pane.
Sys.txt is the backtest file.
Nicolas can you please test on DAX, WallSt and CL (2hr, 1hr, 30m and 5 m)? Let me know if there’s any issues. Thanks.
I moved the topic to automatic trading section. I add your library post at the end of the topic, because I think it would need more refinement before posting it there. Thanks a lot for this indicator and strategy ideas, I still did not have time to test it. Maybe someone will do before me? So n and n-1 are indicators and sys is the strategy.
Did you made backtest on your side already?
So n and n-1 are indicators and sys is the strategy. Did you made backtest on your side already?
Yes.
Yes, but it trades infrequently and I have only the data IG gives me, so the backtest is meaningless on such a tiny dataset (as is WF analysis).