Can someone please check the functionality of my bot? Unfortunately, my coding skills are a bit limited.
The bot is supposed to
close crosses over (M5 timeframe)
high (the last of a closed candle in the H4 timeframe)
to buy.
The last closed candle in H4 to which the high refers should be red. (close //Nasdaq M5/H4 Breakout
//================================================
DEFPARAM CUMULATEORDERS = false
defparam preloadbars = 5000
//Risk Management
PositionSize=1
timeframe(4hour, updateonclose)
c1 = high
c2 = (Close > Open) //green
c3 = (Close < Open) //red
MAxx = Average[20,1](close)
mylongx = MAxx > MAxx[1]
timeframe(default)
// trading window
ONCE BuyTime = 050000
ONCE SellTime = 210000
// position management
IF Time >= BuyTime AND Time <= SellTime THEN
If (close crosses over c1) and c3 and mylongx Then //and not TradeOFF
Buy PositionSize CONTRACTS AT MARKET
SET STOP pLOSS hl //100
SET TARGET pPROFIT gl //175
ENDIF
endif
if time = 220000 and dayofweek=5 and (PositionPerf * PositionPrice / PipSize) >= 1 then //
sell at market
endif
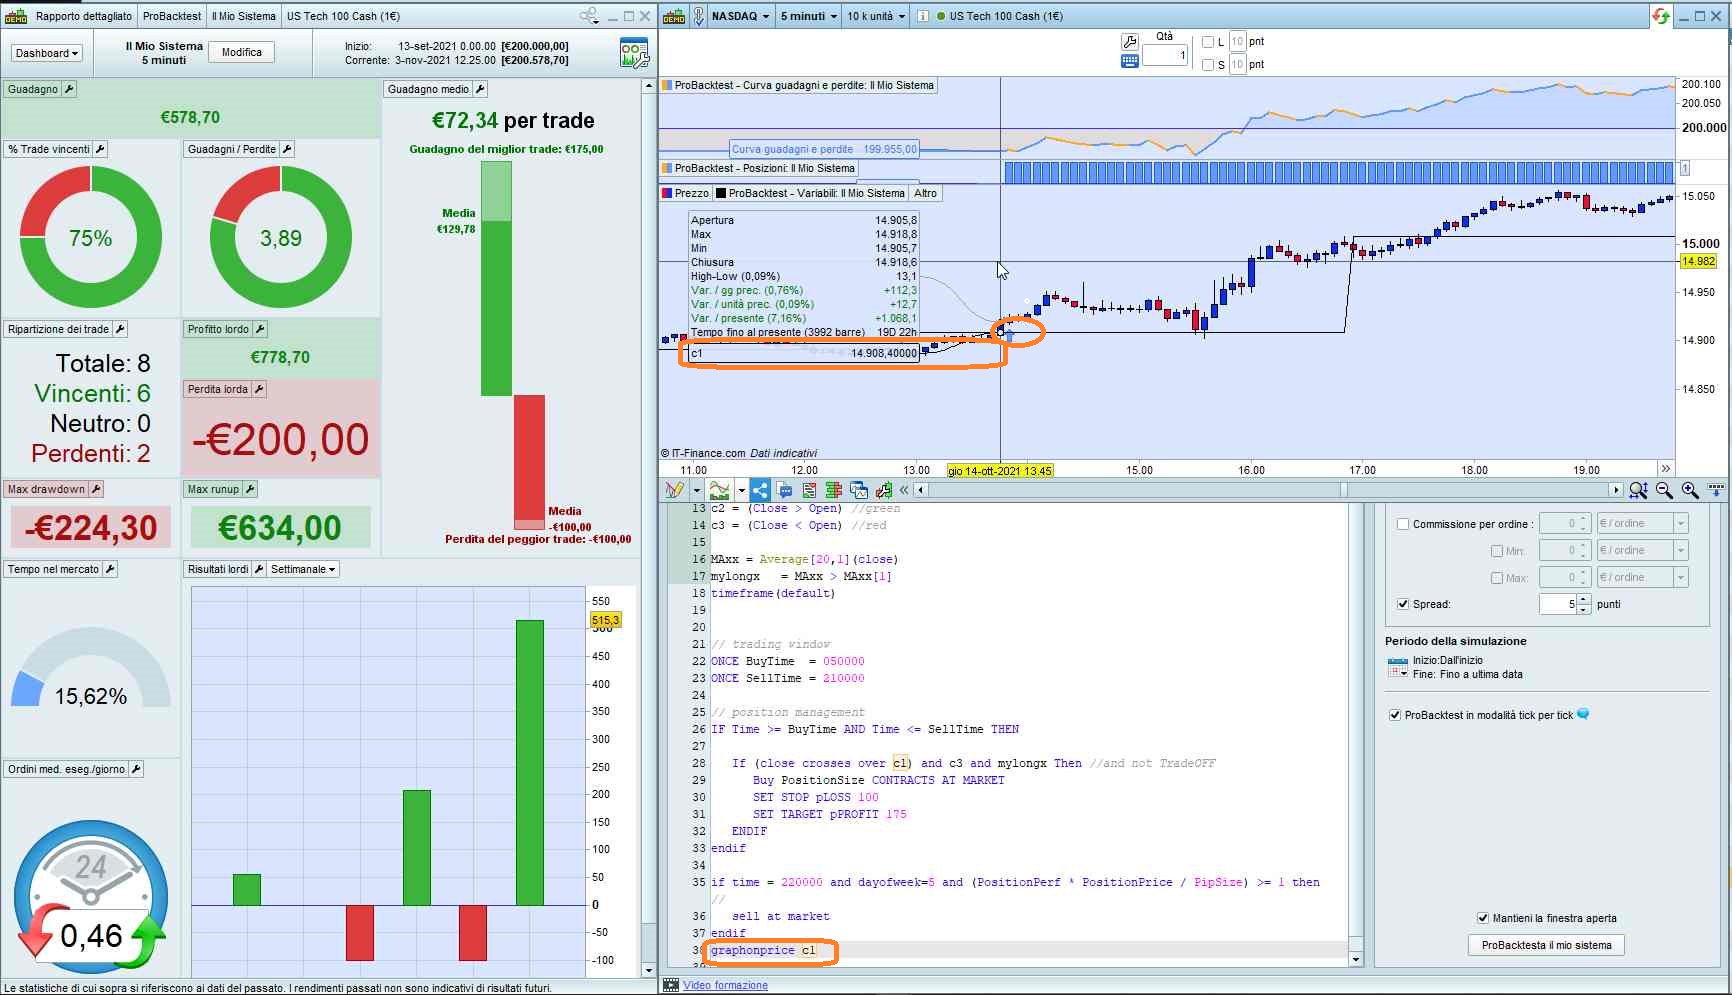
Yes, it works perfectly!
You can append this line to check correct entries:
graphonprice c1
thanks for sharing, this looks interesting.
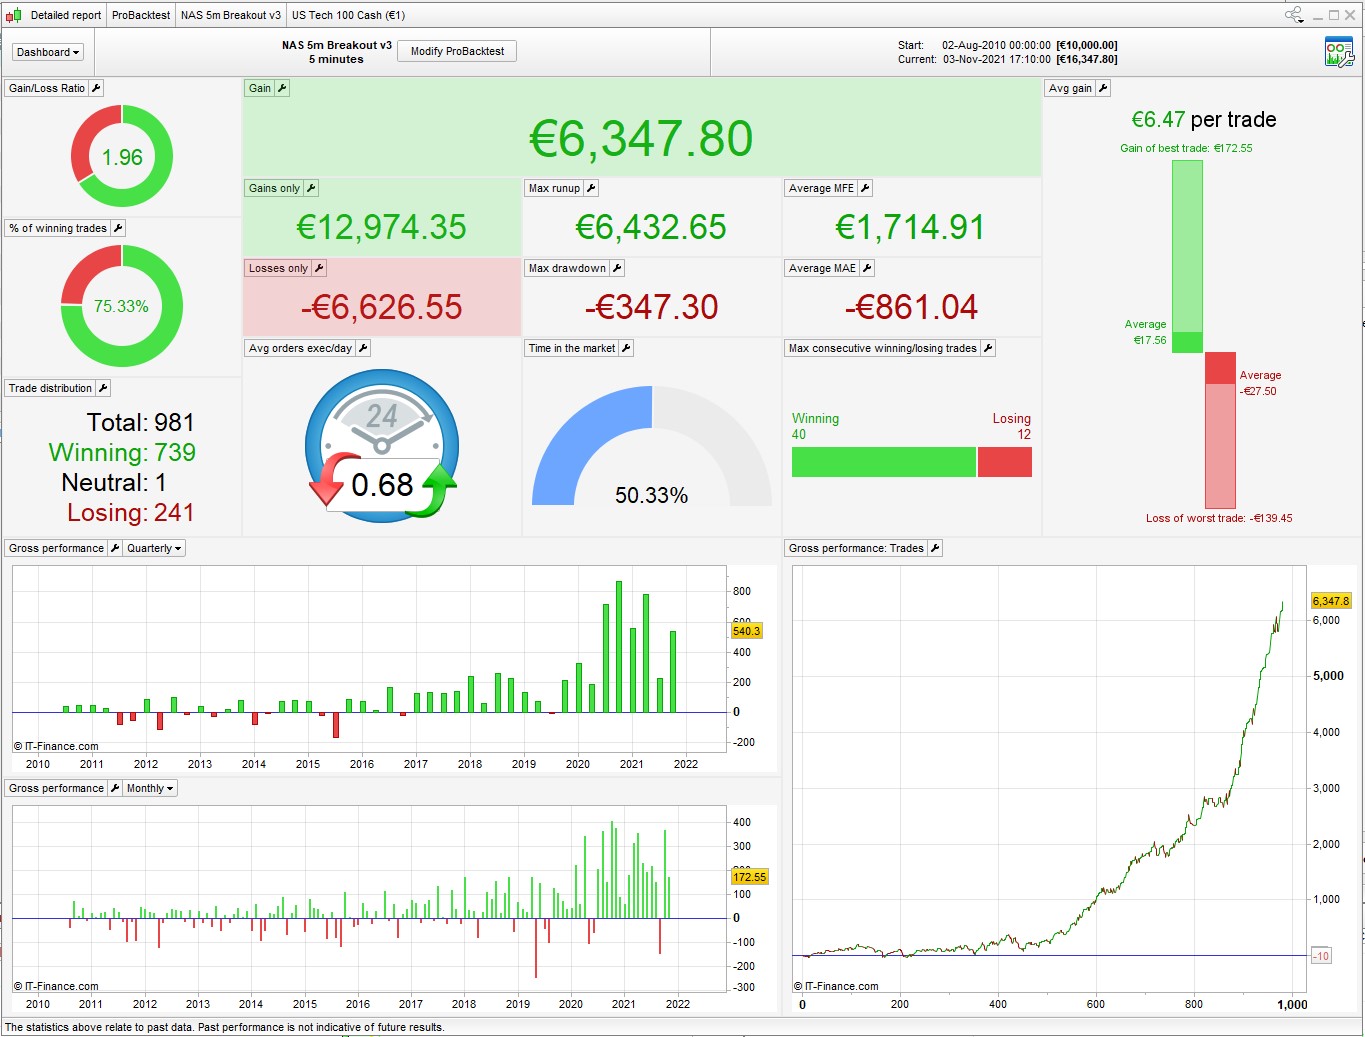
Here’s a variation you might want to try. Quite good over the last 5 years, a bit flat before that – can be improved I’m sure.
Optimized on 100% data so needs more testing etc
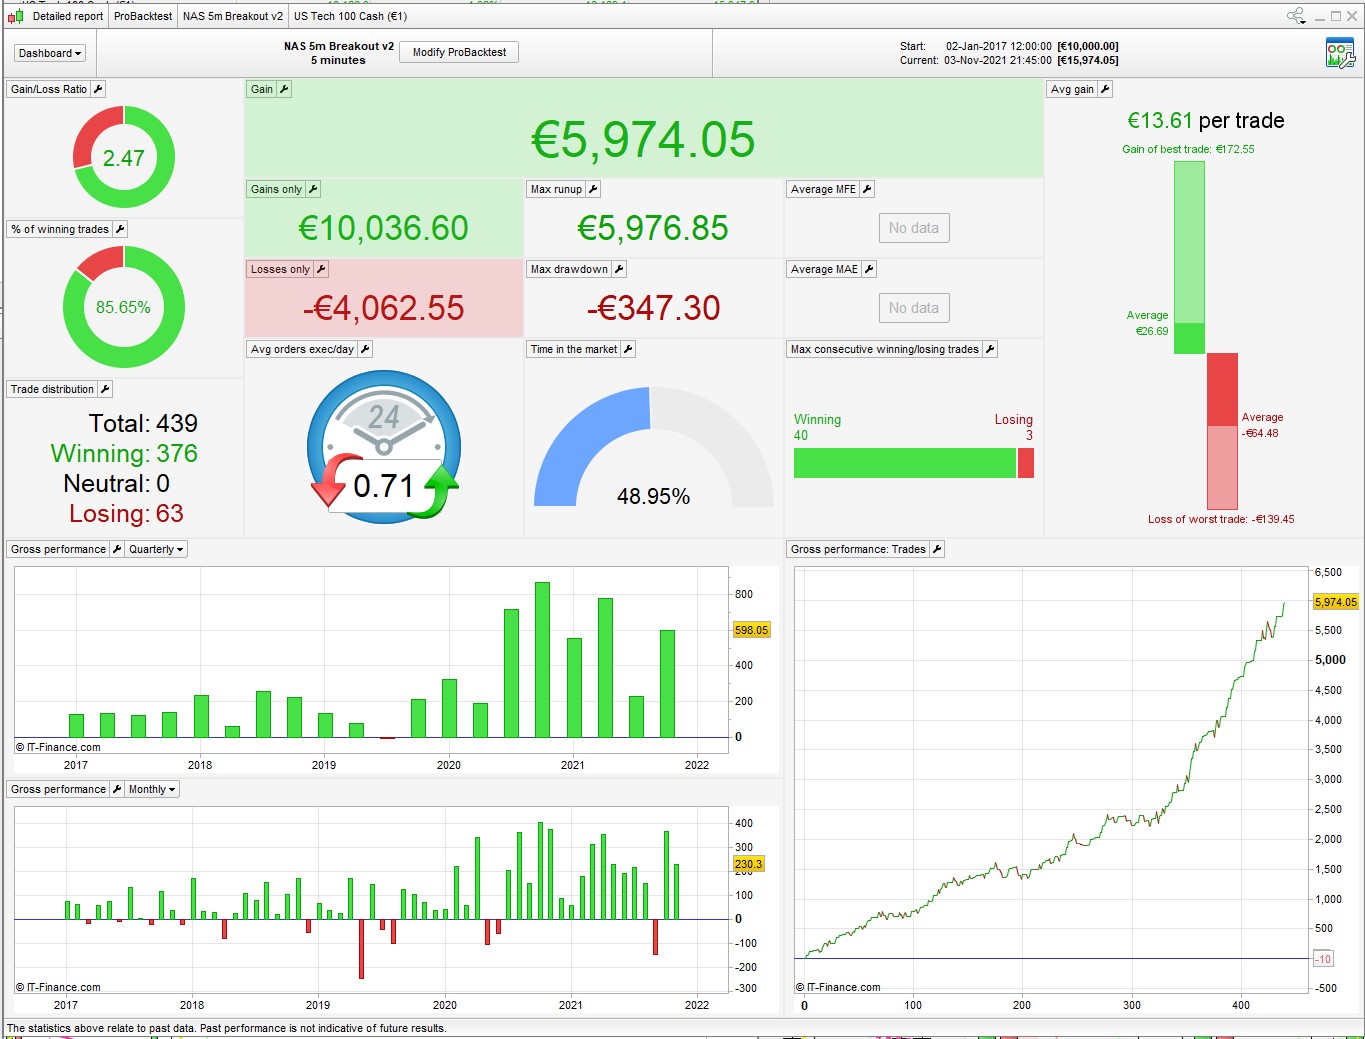
this is the performance from 2017, when almost all the gains were made. Might make sense to optimize for just that period.
So you enter the market with every H4 high break and don’t wait for a drop with a red candle? Do I see that correctly?
Yes, i tried it with either of the conditions you had (green or red) and neither seemed to help, so this enters with any break above the 4h.
I was thinking maybe an RSI condition might help, so that it only enters near the bottom of the run? or maybe use a change of direction in the MA?
ma > ma[1] and ma[1] < ma[2]
Manually you would use a red candle … or maybe a lower high of the H4 candles?
You mean a succession of lower highs – and then the break above?
cb3 = high < high [1] and high [1] < high[2]
that might work but will result in fewer trades.
Right, just tested. And drawdown remains almost the same.
Also interesting with cumulateorders = True
timeframe(4 hour, updateonclose)
h1 = high

MA = Average[p,t](typicalprice)
cb1   = MA > MA[1]

timeframe(1 hour, updateonclose)
h2 = high

timeframe(default)
cb2 = close crosses over h1
cb3 = close crosses over h2

If Tradetime and cb1 and cb2  then
Buy PositionSize CONTRACTS AT MARKET
elsif longonmarket and CB1 and cb3 and COUNTOFLONGSHARES < PosMax then
BUY positionsize CONTRACT AT MARKET
ENDIF
Nice setup. It also runs in 3m too.
I’ll have a look tomorrow. I use EMA15> EMA15 [1] as the H4 filter. I tested it over 10 years ago. I think that it is not optimized too much. I’m not sure about the outbreaks yet. I tested red highs when I got a big drawdown in the summer of 2019. But … same with green highs. If you take all the highs, the drawdown is almost gone. Would be nice to know why, of course. Maybe my stop is too close? I’m at 100Pips SL. In my strategies in the M15, that’s usually enough. You use 1.8% … I find that almost too far. Or what do you think?
@Vinzentvega Yes, it looks good in the M3. But also just knows there were no sideways phases in the time. That’s why I’m undecided.
I’m at 100Pips SL
at present values, 100 points is nothing – around 0.6% – your position will close out way too soon.
10 years ago the NAS was at 1600 so at that point your backtest would be working with a stoploss of around 6%, which no one would use. Even 5 years ago 100pts would have been over 2%
% STOP LOSS keeps it relative to the price level, gives a more realistic picture.
1.8% gave the lowest DD in my tests, 2% shows slightly higher profit
You are right. I also use SL / TP in the DAX. It didn’t really work for me on the Nasdaq, so I use points there. I have to check that again.