Alfy
AlfyParticipant
Average
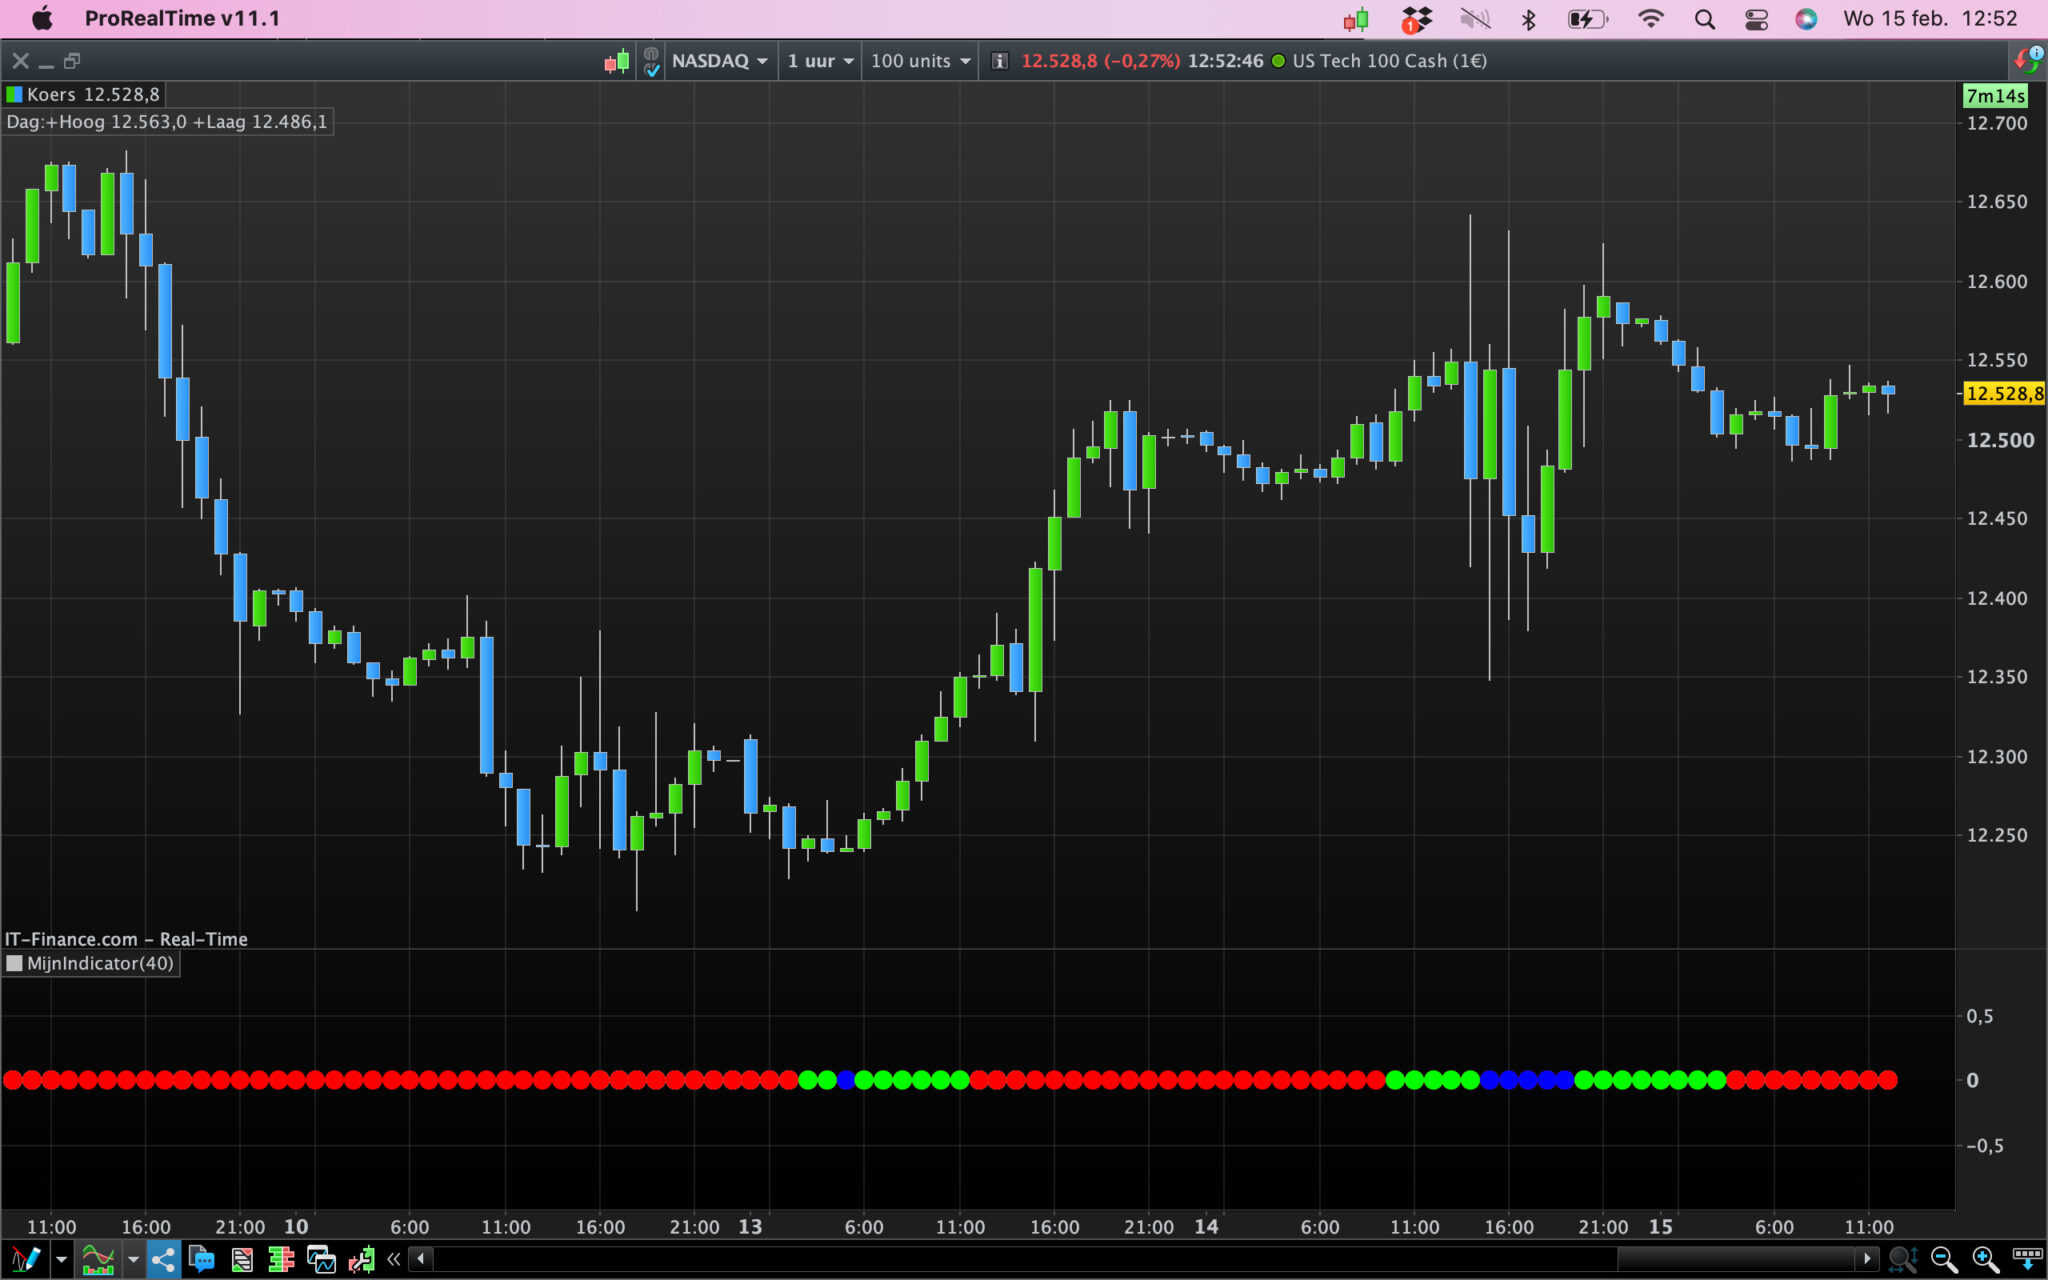
Good afternoon, ive created this indicator that shows when the Bollinger bands divided by Average true range are trading within 3-4 ATR, 2-3 ATR and below 2 ATR. Im looking to have dots all on the zero level with white dots when the bollingers are between 3-4 ATR, Green dots between 2-3 ATR and blue dots below 2 ATR and red dots at all other times. Can someone take a look at my code and see where its going wrong please? Im seeing the dots in a squeeze at the one level whilst the rest of the dots are at the zero level and the dots at the zero level are white and red whereas they should just be red since at those times the Bollingers are wider than 4 ATR. Any help much appreciated.
Thanks in advance
a=Average[20](Close)
// We define the standard deviation.
StdDeviation = STD[20](Close)
Bsup = a + 2 * StdDeviation
Binf = a - 2 * StdDeviation
B=AVERAGETRUERANGE [20] (CLOSE)
C=(BSUP-BINF)/B
Lowsqz=c=<4 and c>3
midsqz=c=<3 and c>2
highsqz=c=<2
If lowsqz then
AcolorR = 255
AcolorG = 255
AcolorB= 255
else
colorR = 255
colorG = 0
COLORB=0
endif
If midsqz then
BcolorR = 0
BcolorG = 255
BcolorB= 0
else
colorR = 255
colorG = 0
COLORB=0
ENDIF
If highsqz then
CcolorR = 0
CcolorG = 0
CcolorB= 255
else
colorR = 255
colorG = 0
COLORB=0
ENDIF


Return MIDSQZ coloured (BCOLORR,BCOLORG,BCOLORB) as "mid sqz", HIGHSQZ coloured (COLORR,COLORG,COLORB) as "high sqz", LOWSQZ coloured (ACOLORR,ACOLORG,ACOLORB) as "LOW SQZ"
 JS
JSParticipant
Veteran
Hi Alfy,
Try this one…
a=Average[20](Close)
// We define the standard deviation.
StdDeviation = STD[20](Close)
Bsup = a + 2 * StdDeviation
Binf = a - 2 * StdDeviation
B=AVERAGETRUERANGE [20] (CLOSE)
C=(BSUP-BINF)/B
Lowsqz=c=<4 and c>3
midsqz=c=<3 and c>2
highsqz=c=<2
If lowsqz then
DrawPoint(BarIndex,0,3)Coloured(255,255,255)
//AcolorR = 255
//AcolorG = 255
//AcolorB= 255
else
DrawPoint(BarIndex,0,3)Coloured(255,0,0)
//colorR = 255
//colorG = 0
//COLORB=0
endif
If midsqz then
DrawPoint(BarIndex,0,3)Coloured(0,255,0)
//BcolorR = 0
//BcolorG = 255
//BcolorB= 0
else
DrawPoint(BarIndex,0,3)Coloured(255,0,0)
//colorR = 255
//colorG = 0
//COLORB=0
ENDIF
If highsqz then
DrawPoint(BarIndex,0,3)Coloured(0,0,255)
//CcolorR = 0
//CcolorG = 0
//CcolorB= 255
else
DrawPoint(BarIndex,0,3)Coloured(255,0,0)
//colorR = 255
//colorG = 0
//COLORB=0
ENDIF

Return //
AlfyParticipant
Average
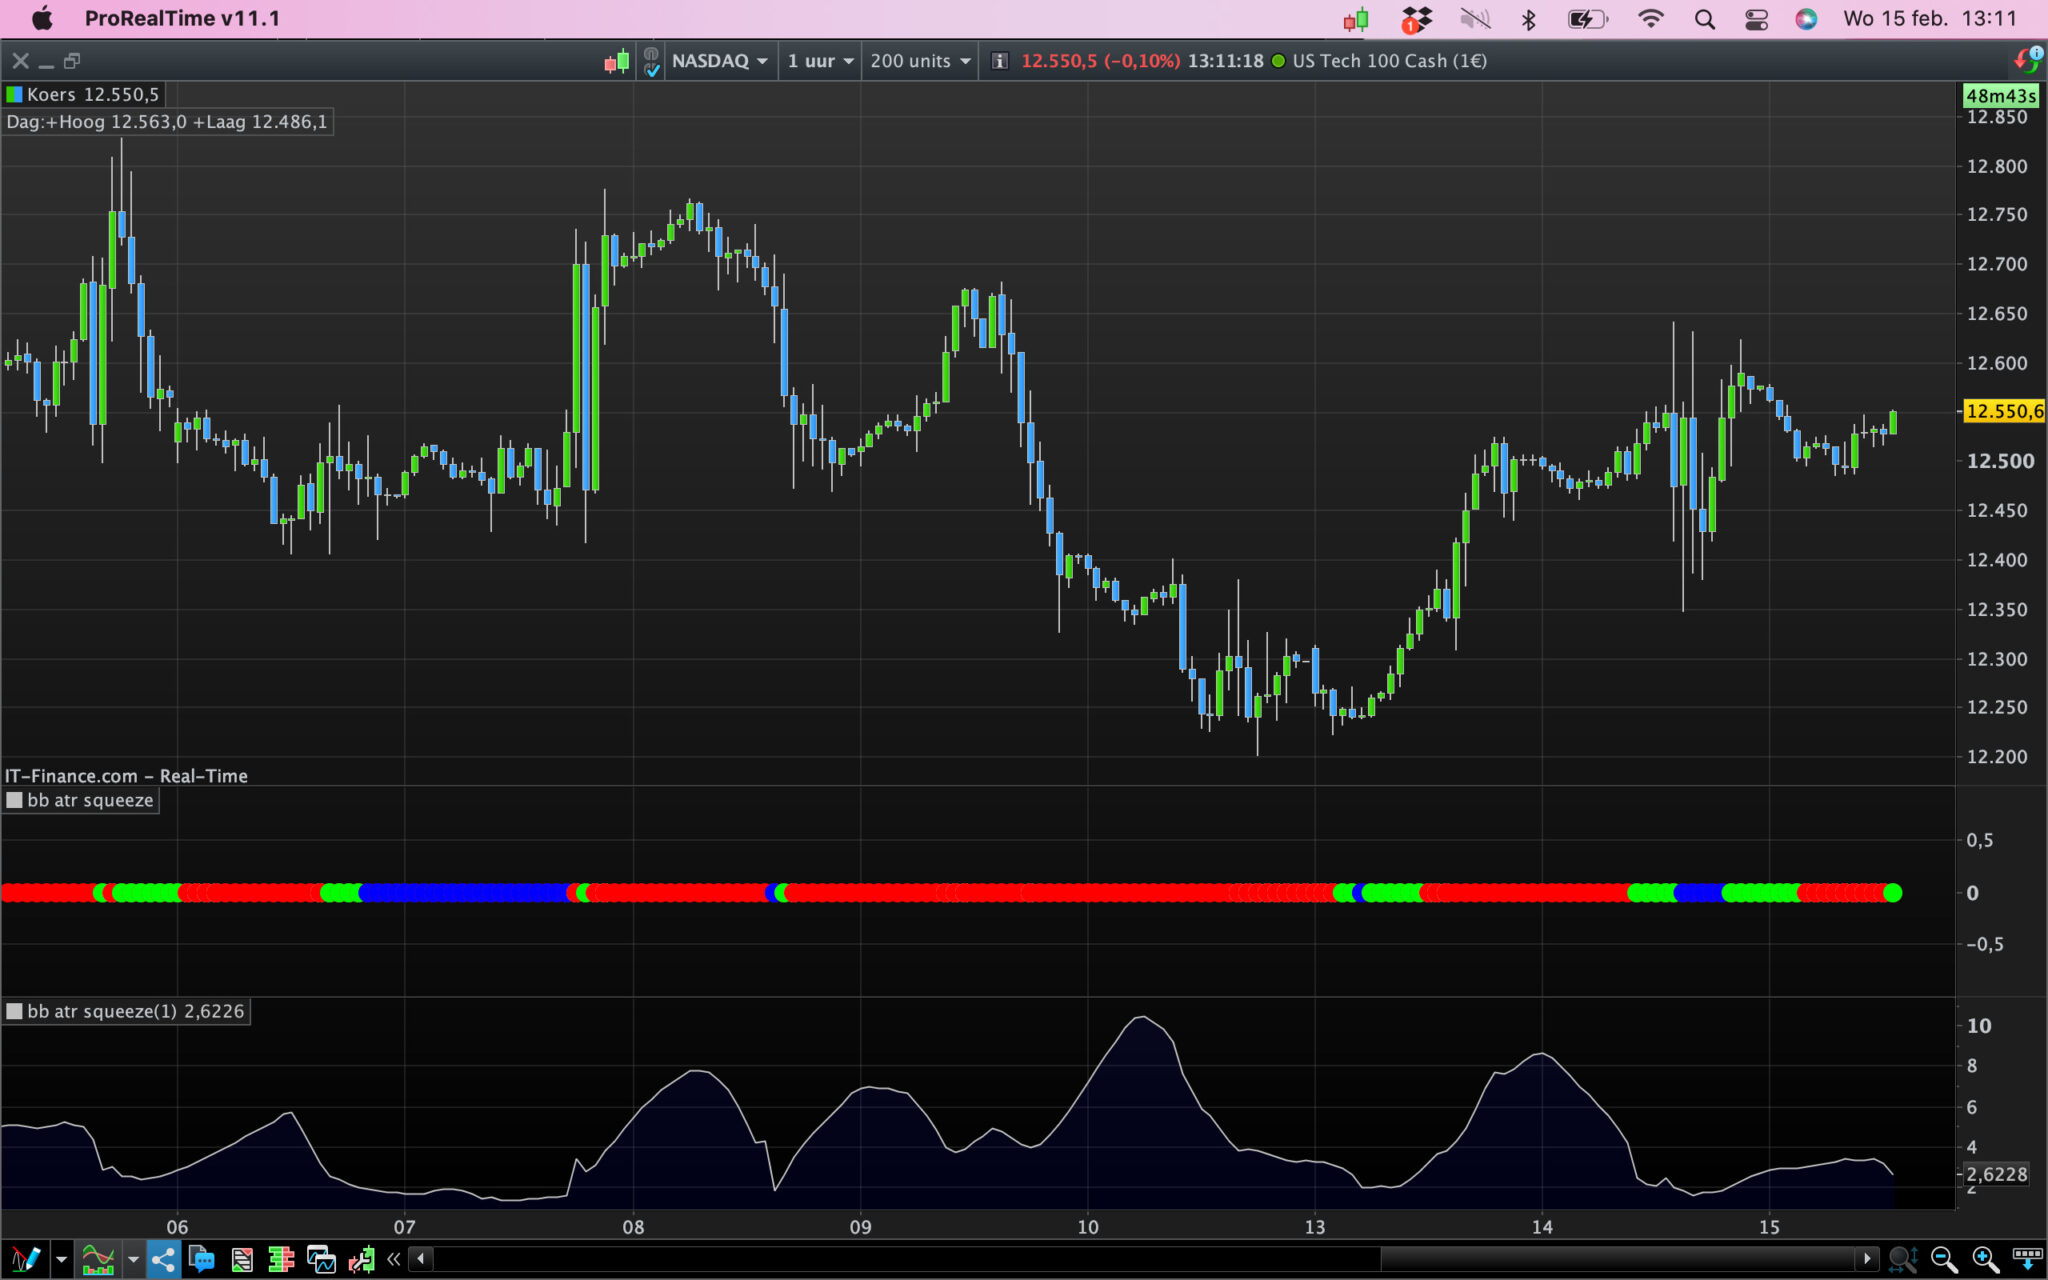
Wow1 thanks for your help. It seems that only the mid squeeze is working..i have the green dots working fine but the rest of the dots are red which seems to suggest the white (wider sqz) and the blue (narrower sqz) are not being picked up.
JSParticipant
Veteran
Hi Alfy,
Return the value of “C” and compare it with your colors…
AlfyParticipant
Average
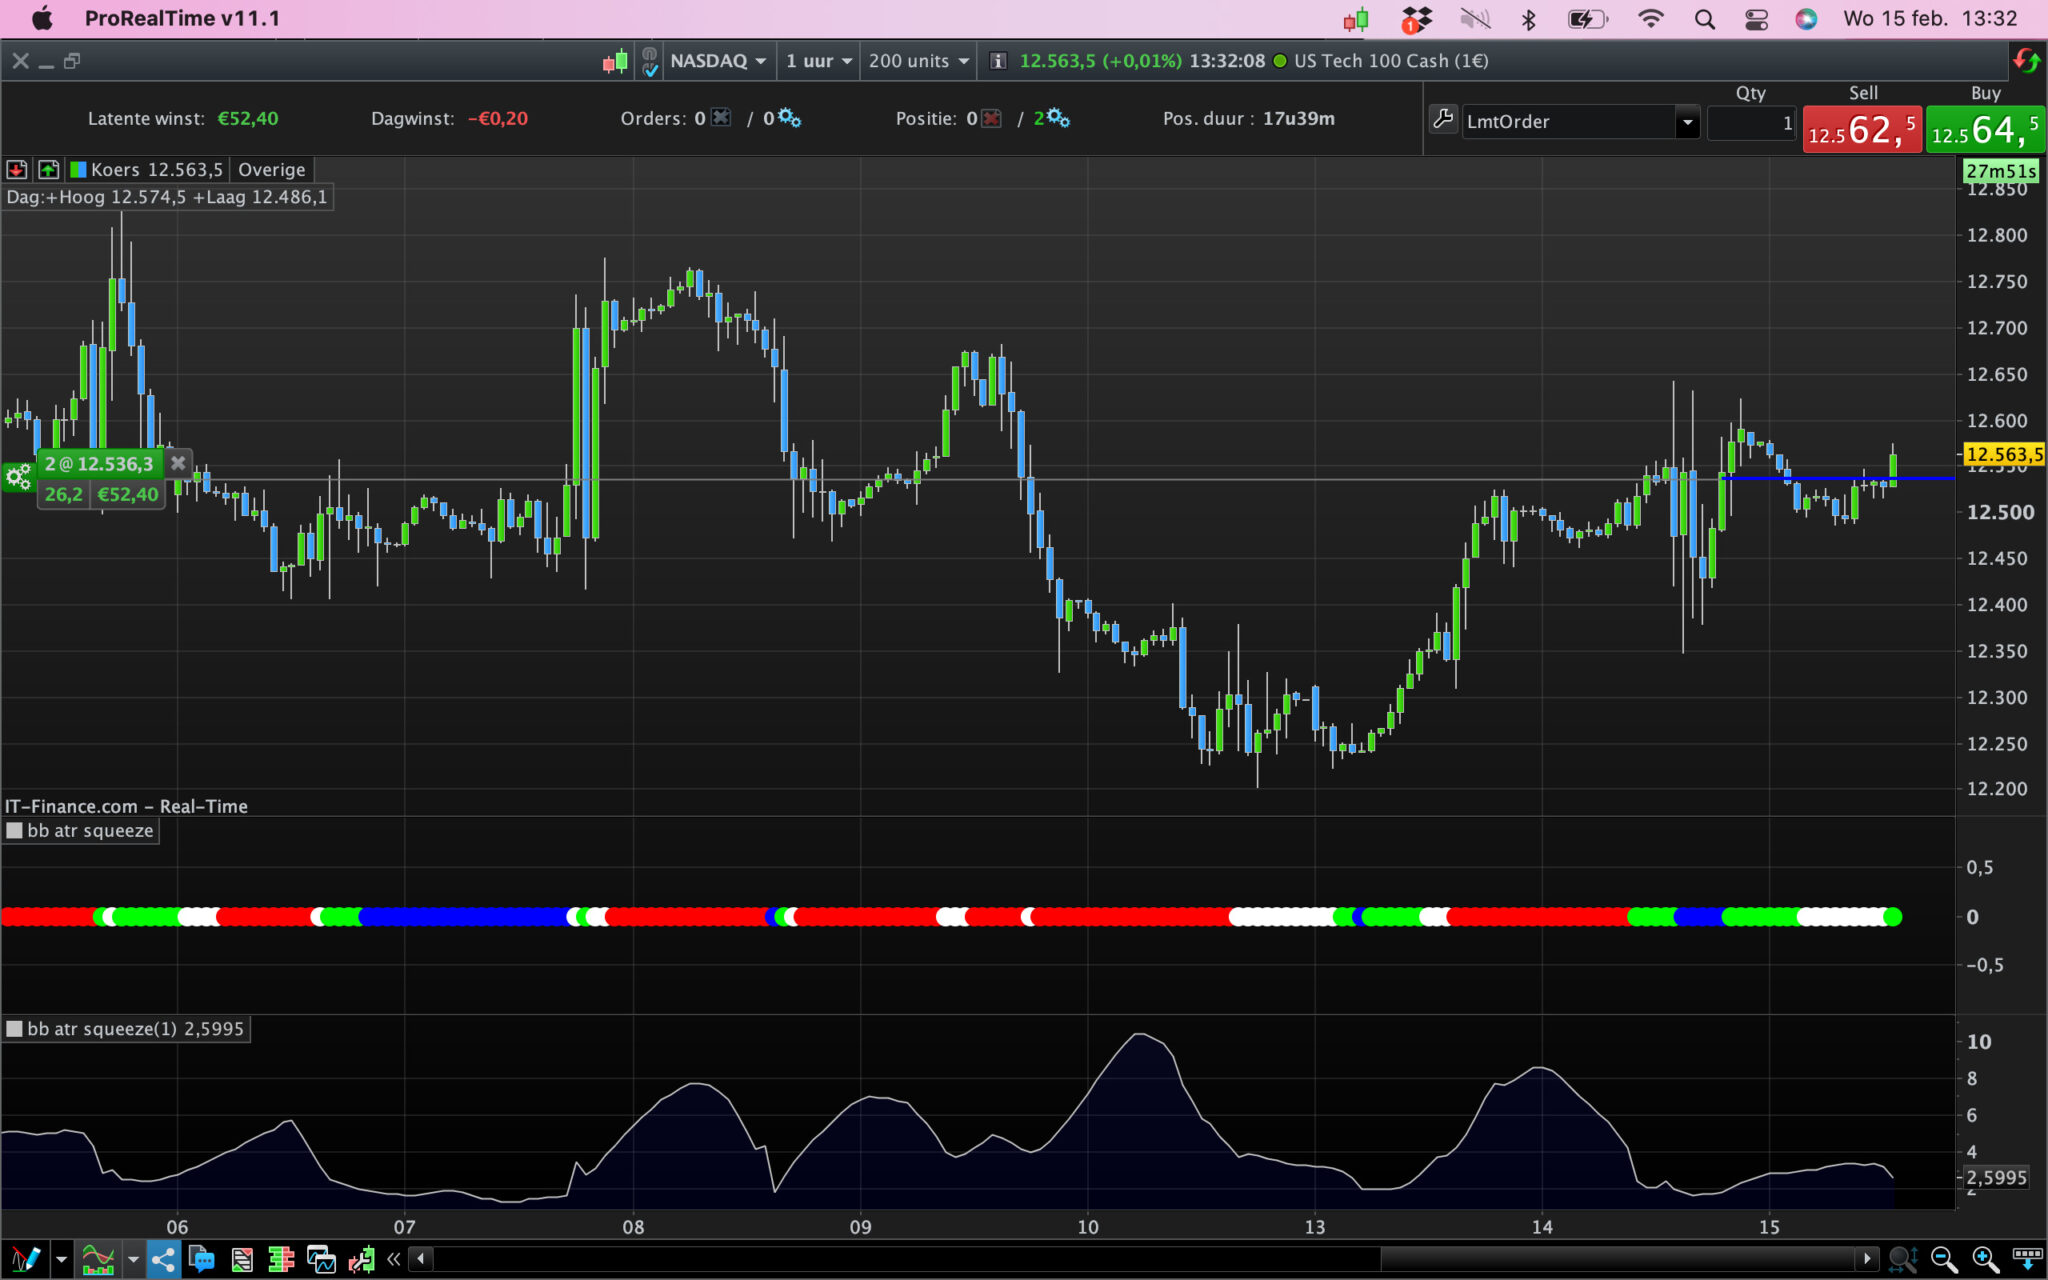
I get the same as you so i see the green dots and the Blue dots but it seems that its not picking up the white dot wider squeeze which is C with values between 3 & 4. (Lowsqz=c=<4 and c>3) Really appreciate you help with this. Its almost perfect
JSParticipant
Veteran
Hi Alfy,
Try this one…
a=Average[20](Close)
// We define the standard deviation.
StdDeviation = STD[20](Close)
Bsup = a + 2 * StdDeviation
Binf = a - 2 * StdDeviation
B=AVERAGETRUERANGE [20] (CLOSE)
C=(BSUP-BINF)/B
Lowsqz=c=<4 and c>3
midsqz=c=<3 and c>2
highsqz=c=<2
If lowsqz then
DrawPoint(BarIndex,0,3)Coloured(255,255,255)
//AcolorR = 255
//AcolorG = 255
//AcolorB= 255
else
//DrawPoint(BarIndex,0,3)Coloured(255,0,0)
//colorR = 255
//colorG = 0
//COLORB=0
endif
If midsqz then
DrawPoint(BarIndex,0,3)Coloured(0,255,0)
//BcolorR = 0
//BcolorG = 255
//BcolorB= 0
else
//DrawPoint(BarIndex,0,3)Coloured(255,0,0)
//colorR = 255
//colorG = 0
//COLORB=0
ENDIF
If highsqz then
DrawPoint(BarIndex,0,3)Coloured(0,0,255)
//CcolorR = 0
//CcolorG = 0
//CcolorB= 255
else
//DrawPoint(BarIndex,0,3)Coloured(255,0,0)
//colorR = 255
//colorG = 0
//COLORB=0
ENDIF

If C > 4 then
DrawPoint(BarIndex,0,3)Coloured("Red")
EndIf


Return //MIDSQZ coloured (BCOLORR,BCOLORG,BCOLORB) as "mid sqz", HIGHSQZ coloured (COLORR,COLORG,COLORB) as "high sqz", LOWSQZ coloured (ACOLORR,ACOLORG,ACOLORB) as "LOW SQZ"
AlfyParticipant
Average
Wow JS! Thanks so much, works perfectly