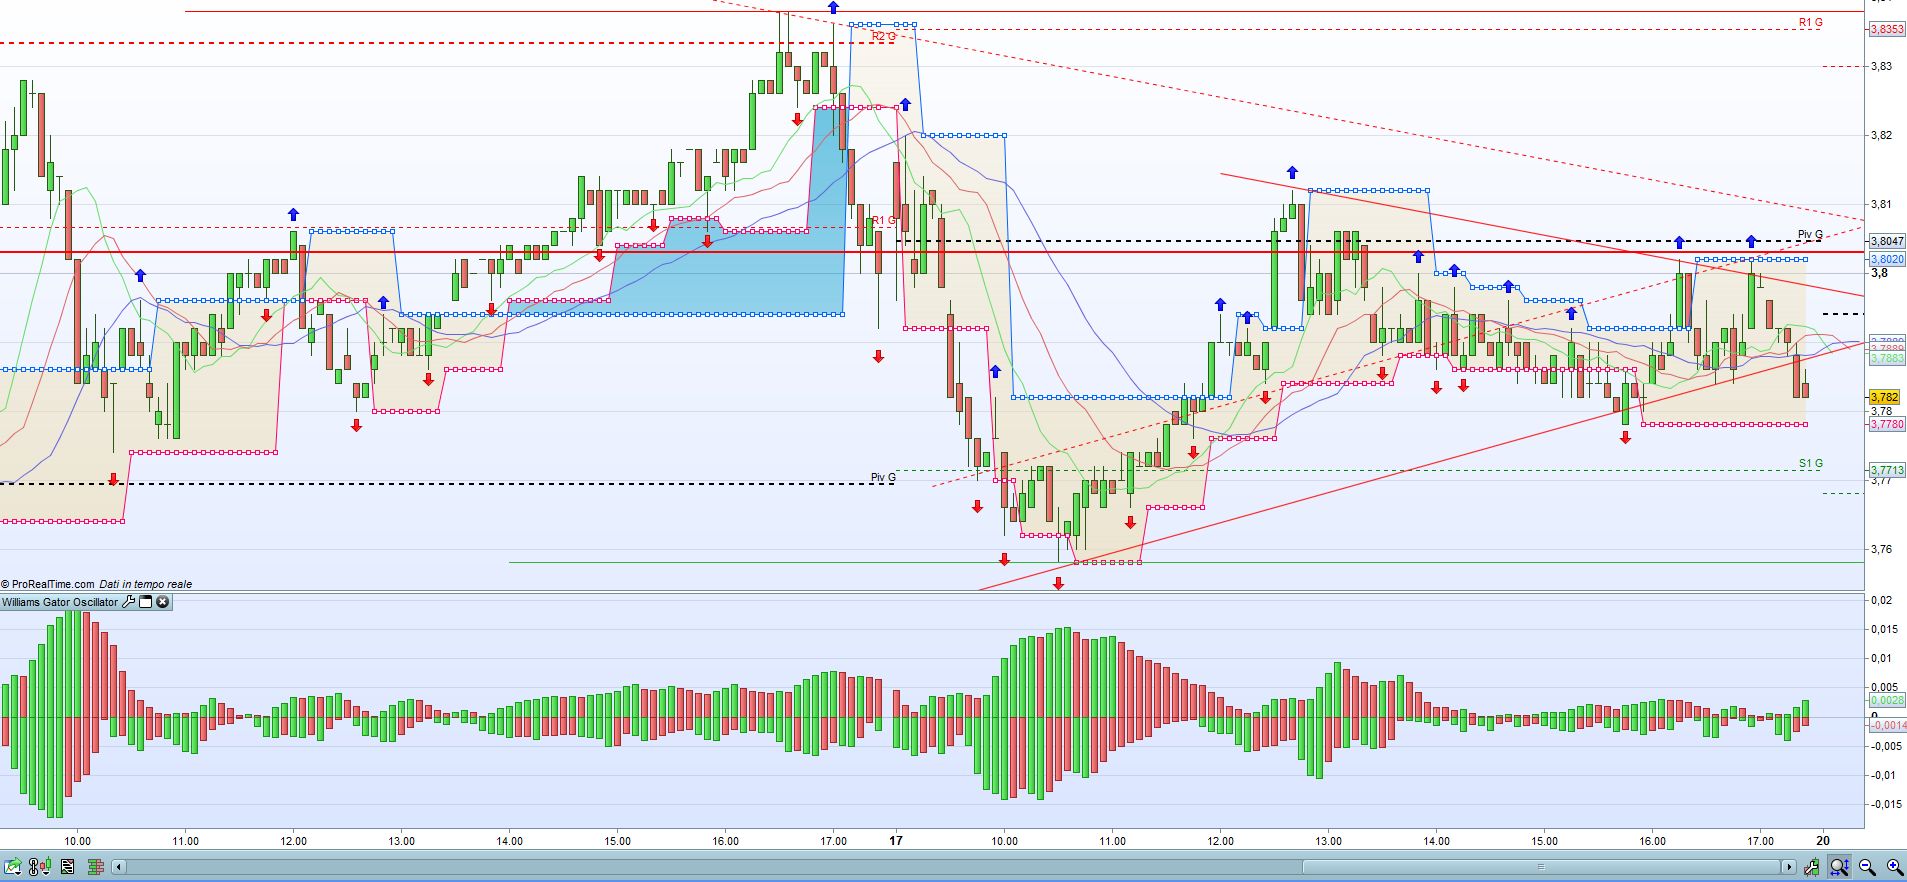
Gator Oscillator is based on the Alligator and shows the degree of convergence/divergence of the Balance Lines (Smoothed Moving Average). The upper histogram is the absolute difference between the values of the blue and the red lines. The lower histogram is the absolute difference between the values of the red line and the green line, but with the minus sign, as the histogram chart is drawn top-down.
I edited the code posted here https://www.prorealcode.com/prorealtime-indicators/bill-williams-alligator/
I hope I didn’t make any mistakes, so just check if you think it is useful
REM Gator Oscillator - Bill Williams
// Alligator Blue Line - Jaw
// 13 bar smoothed average future 8 bars
SSMAblue = WilderAverage[13](close[8])
// Alligator Red Line - Teeth
// 8 bar smoothed average future 5 bars
SSMAred = WilderAverage[8](close[5])
// Alligator Green Line - Lip
// 5 bar smoothed average future 3 bars
SSMAgreen = WilderAverage[5](close[3])
UpperGraph=abs(SSMAblue-SSMAred)
LowerGraph=-abs(SSMAred-SSMAgreen)
if UpperGraph > UpperGraph[1] then
ug=1
else
if UpperGraph <= UpperGraph[1] then
ug=-1
endif
endif
if LowerGraph > LowerGraph[1] then
lg=-1
else
if LowerGraph <= LowerGraph[1] then
lg=1
endif
endif
return UpperGraph coloured by ug as "Jaws-Teeth", LowerGraph coloured by lg as "Teeth-Lips"