Hi,
I am trying to identify the big body candle out of last 12 candles, but the code is returning “nil or none”. Any help would be much appreciated.
Regards,
DEFPARAM CalculateOnLastBars = 1000
Bullish = close > open
Bearish = close < open
BigBody = HIGHEST[p](abs(close-open))
//BearishBigBody = HIGHEST[p]((open-close))
//
// UP trend detection
//Count1 = 0 i      = 0 WHILE Count1 <= p AND i < BarIndex i = i + 1 IF Count1 = 0 THEN IF Bullish[i] THEN Count1 = 1 MyHigh = BullishBigBody[i] ENDIF ENDIF WEND
d1=Bullish
d2=BigBody
UCond= d1 and d2
d3=Bearish
DCond= d2 and d3
cond=0
if Ucond then
cond=1
elsif Dcond then
cond=-1
endif
return cond as "BigBody"
“p” is a variable having value as 12
Try replacing line 4 with:
BigBody = abs(close - open) = HIGHEST[p](abs(close-open))
Many thanks Robert. It worked. Appreciate your fast and reliable response. Just a question, why there are 2 “=” signs in
BigBody = abs(close – open) = HIGHEST[p](abs(close–open))
Because it first checks that the body is the highest one within the last p bars:
abs(close – open) = HIGHEST[p](abs(close–open))
then the boolean value returned (true or false) is assigned to variable BigBody.
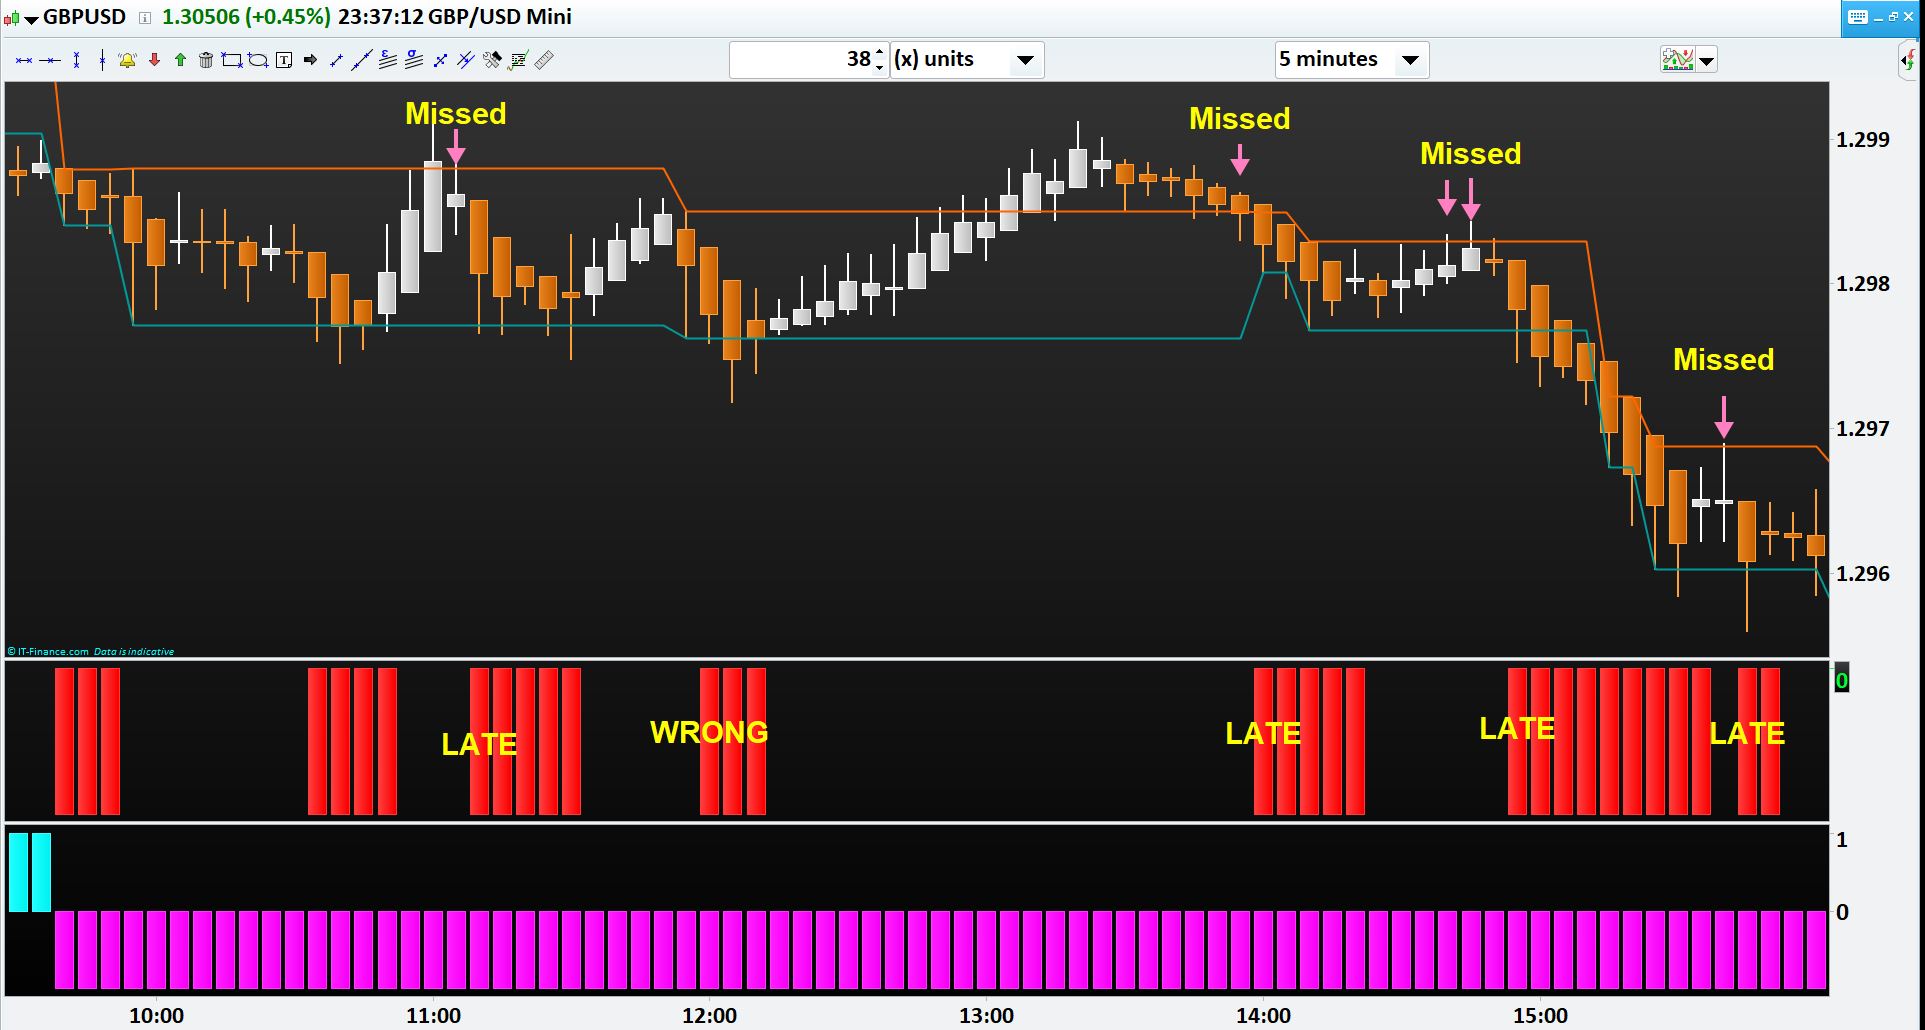
Many thanks Robert. However, when I created the boundary (Upper Line and Lower Line) of the BigBody and then tried to identify the Bounce from those lines based on the conditions as per enclosed PRT, it is missing the correct signals and generating false or Late signals somewhere else as shown in the enclosed chart. Can you please enlighten what is wrong here.
Regards,
DEFPARAM CalculateOnLastBars = 1000
Bullish = close > open
Bearish = close < open
BigBody = abs(close - open) = HIGHEST[p](abs(close-open))

d1=Bullish
d2=BigBody
UCond= d1 and d2
d3=Bearish
DCond= d2 and d3

if Ucond then
cond=1
elsif Dcond then
cond=-1
endif
//
// Creating high and low lines for the "BIGBODY"
if cond=1 then
highline=high
lowline=low
elsif cond=-1 then
highline=high
lowline=low
endif

//Heikin-ashi
if barindex>1 then
hc=(open+close+low+high)/4
ho=(ho[1]+hc[1])/2
xHigh = Max(hO, hC)
xLow = Min(hO, hC)
hh = Max(High,xHigh)
hl = Min(Low,xLow)
endif
//
// BOUNCE Identification
IF cond=-1 AND HH[1]>highline[1] AND HC<highline THEN
OBS=-64
ELSIF cond=-1 AND HH>highline AND HC<highline THEN
OBS=-64
ELSIF cond=1 AND HL[1]<lowline[1] AND HC>lowline THEN
OBS=64
ELSIF cond=1 AND HL<lowline AND HC>lowline THEN
OBS=64
ELSE
OBS=0
ENDIF

return OBS as "BigBody-Line-Bounce"
What value is P?
What date & time are those candlesticks?
Sorry Robert, P is 15 and chart is of 5 min for GBPUSD as shown in the chart. Your help would be much appreciated.
Regards,
What TZ is it, compared tu UTC ?
Hello Robert,
Thank you for your response, however there is no “TZ” or “UTC” in the code. Where did you find them? I am again pasting the code for your reference.
Regard
DEFPARAM CalculateOnLastBars = 1000
Bullish = close > open
Bearish = close < open
BigBody = abs(close - open) = HIGHEST[p](abs(close-open))

d1=Bullish
d2=BigBody
UCond= d1 and d2
d3=Bearish
DCond= d2 and d3

if Ucond then
cond=1
elsif Dcond then
cond=-1
endif
//
// Creating high and low lines for the "BIGBODY"
if cond=1 then
highline=high
lowline=low
elsif cond=-1 then
highline=high
lowline=low
endif

//Heikin-ashi
if barindex>1 then
hc=(open+close+low+high)/4
ho=(ho[1]+hc[1])/2
xHigh = Max(hO, hC)
xLow = Min(hO, hC)
hh = Max(High,xHigh)
hl = Min(Low,xLow)
endif
//
// BOUNCE Identification
IF cond=-1 AND HH[1]>highline[1] AND HC<highline THEN
OBS=-64
ELSIF cond=-1 AND HH>highline AND HC<highline THEN
OBS=-64
ELSIF cond=1 AND HL[1]<lowline[1] AND HC>lowline THEN
OBS=64
ELSIF cond=1 AND HL<lowline AND HC>lowline THEN
OBS=64
ELSE
OBS=0
ENDIF

return OBS as "BigBody-Line-Bounce"
It’s your TZ.
Mine is UTC + 1 DST (currently Utc+2), so when I see a candle in your pic at 11am, what 11am is it? it is UTC+???
Moreover, are you with IG?
Sorry Robert, I thought you are asking about TZ and UTC as variable in the code.
Our time zone (TZ) is UTC+ 10
Yes, we are using PRT (v10.3 – 1.8.0-_202) from IG
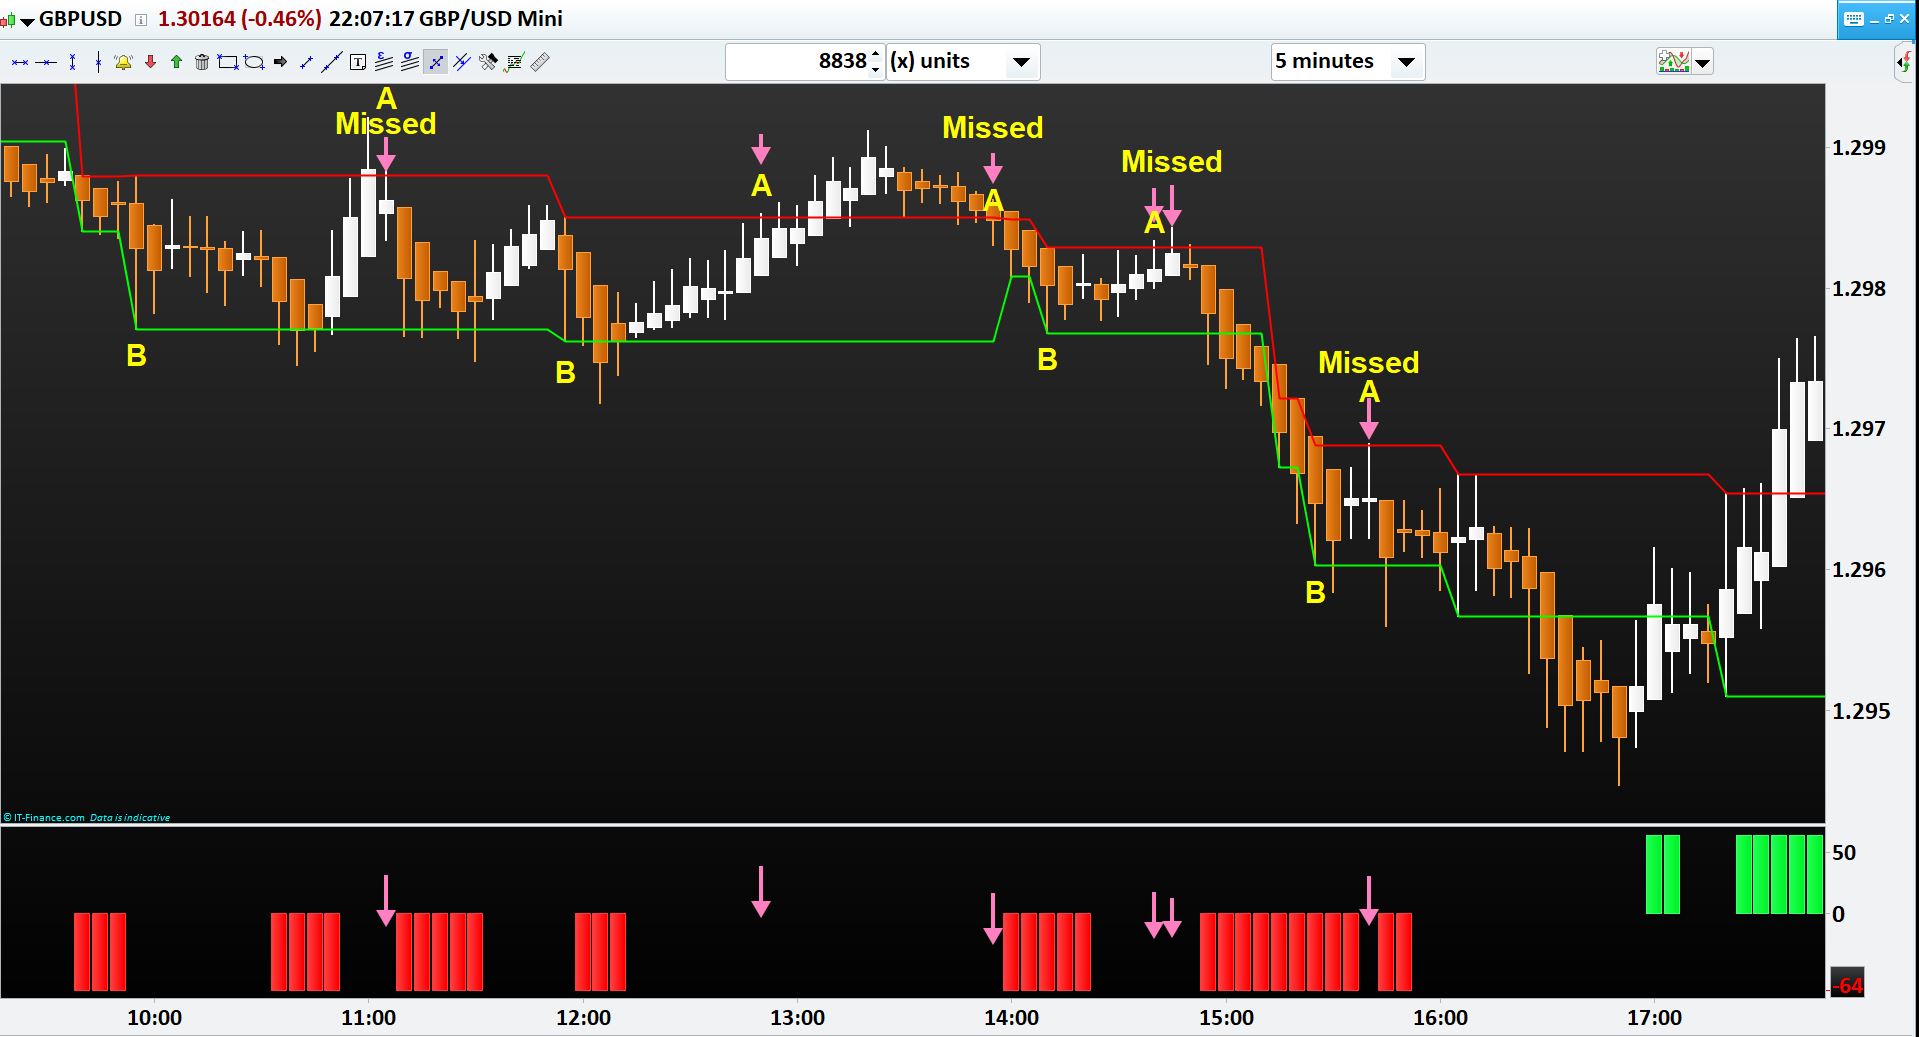
I can’t see anything wrong with those candlesticks. If you think some of them are wrong (late or missing), please let me know, for each candle (use their time tag):
- the value of that candle
- the highest value calculated to compare them.
Moreover:
- you are mixing some computations on HA candles (lines 38-44) and regular japanese candles (the rest of the code)
- lines 19-25 show two dfferent conditions, but the value you assign to variables is the same for both.
If you explain the details of waht you want to achieve I might be able to help you better.
Hello Robert, thank you for your response. Appreciate. I am trying to do the following steps:
1. Identify Big body bar
2. Identify the high and low of the Big body bar to draw horizontal high line (HL) and low line (LL) on its high and low
3. Identify whether the Big body bar is bullish or bearish
4. Identify bounce Short opportunity: If bearish big body (B) and any heikin ashi bar (A)’s high, after the bearish big body (B), is higher than the high line (HL) (red line) and heikin ashi close (HC) of the same bar (A) is lower than high line (HL) then print OBS as -64
5. Identify bounce Long opportunity: If bullish big body (BB) and any heikin ashi bar (AA)’s low, after the BB, is lower than the low line (LL) and heikin ashi close (HC) of the same bar (AA) is higher than low line (LL) then print OBS as 64
Trust this help.
The missed signal’s time stamps are as below:
Symbol: GBPUSD mini
Date: 30.07.2020
Time: 11:05, 12:50, 13:55, 14:40, 15:40
Regards,