Thanks for clarifying that Nicolas. I was wondering why I did not have MTF yet and I did not realise that it is in beta testing only on PRT end of day or free trial accounts opened directly with PRT.
I have just opened a new account (needed yet another email address!) so that I can now test out this long awaited feature.
My first thoughts on MTF – fantastic so far!
Only being able to test it on an end of day account at the moment is a little bit limiting but we can get an idea of how powerful this will be and the opportunities it opens up.
The use of the GRAPH function is going to be very important in our ability to understand and develop ideas so it is a pity that you have to have at least one BUY or SELL instruction within the code to be able to run it otherwise you get this message.
[attachment file=75283]
So you then have to put a BUY or SELL in to get it to work and then you find the strategy runs out of money so you have to increase the start capital, but it is still not enough so then you have to try to create a basic strategy that does not run out of money – all a bit of a faff really.
I think it would be better to do away with the demand for at least one BUY and SELL and just let the strategy run if there is a GRAPH instruction in it. So what if it does not open a trade?
The perfect solution is the use of TIMEFRAME in indicator creation in ProBuilder but just doing away with the need for a BUY or SELL so that we can graph easily would do for now.
The correct use of DEFAULT or UPDATEONCLOSE is going to critical within our strategies. I made this simple test and graphed the results to compare with UPDATEONCLOSE and DEFAULT.
//12 month average
timeframe(monthly, default)
ma1 = average[12,1]

//52 week average
timeframe(weekly, default)
ma2 = average[52,1]

//300 day average
timeframe(default)
ma3 = average[300,1]
With DEFAULT:
[attachment file=75287]
and with UPDATEONCLOSE:
[attachment file=75288]
If you were using the MA’s being stacked in the correct order as a filter then UPDATEONCLOSE would have you kept off the market in the latter part of each month.
Dear Nicolas, do you know for when is scheduled the MTF with IG demo accounts?
Thank you very much.
Cristiano
@Vonasi
About GRAPH indicators and no orders, you just have to set a fake condition to avoid any order to be launched at market, just like the way I did in the example of the blog article:
defparam cumulateorders=false


//daily SMA
timeframe(daily)
smad20 = average[20]

timeframe(15 minutes,updateonclose)
bollup = BollingerUp[20](close)
bolldn = BollingerDown[20](close)

//5 minutes SMA
timeframe(default)
sma20 = average[20]
sma50 = average[50]
//dummy order condition
if sma20=-100 then
 buy at market
endif

graph close as "price"
graph smad20 coloured(0,0,255)
graph bollup coloured(100,100,100)
graph bolldn coloured(100,100,100)
graph sma20 coloured(0,255,0)
graph sma50 coloured(255,0,0)
Obviously, the sma20 variable will never be equal to -100 🙂
You are absolutely right about the mode selection (UpdateOnClose or default), that’s why I warned people in the same article.
@Cris48
If the feature is in Beta testing with the software version, it smells good to get it with associated brokers within some weeks. Beta testing period with a wide range of codes is necessary before pushing it into real live trading. In the meantime, everyone is free to open a free EOD account with ProRealTime software and benefit of the new multi-timeframe support for automatic trading. So what are you waiting for? 😉
Thanks for the workaround Nicolas. Do PRT plan on bringing MTF to ProBuilder for indicators?
Do PRT plan on bringing MTF to ProBuilder for indicators?
I know they are working on indicators on Renko/Kagi/Point&Figure/etc. first and for the version 11 (with sooooooooo many new features and redesigned of the platform that everyone will be amazed!, I think I will able to show you things by September).
MTF for ProBuilder should come with v11.1 , as for the last news I get.
If I include the calculations within a strategy that returns a result do the variable names have to be different for each time frame?
I ask because I cut and pasted an indicator code into each time frame and then returned the result as a different variable name for each time frame and the code won’t run – it just goes to an error message asking to send a report.
Yes, the rules for variables naming is the same as before. You are programming in different timeframe, but the program is still a single one.
About your error message, seems like a bug. Difficult to help more without knowing the code itself! 🙂
I modified the code so that the variables for each time frame have different names by simply adding a ‘2’ to the end of them but it still errors out.
It is the standard error band code on each time frame and then I wanted to graph the results.
P = 21
SDEG = 1
MF=2

timeframe(weekly)
AR = close
N = barindex
LR = Average[SDEG](linearregression[P](AR))

bv1 = summation[P](N*AR) - (P*Average[P](N)*Average[P](AR))
bv2 = summation[P](square(N)) - (P*square(Average[P](N)))
CalcB = bv1 / bv2

CalcA = Average[P](AR) - (CalcB*Average[P](N))

sev1 = Summation[P](square(AR)) - (CalcA*Summation[P](AR)) - (CalcB*Summation[P](N*AR))
sev3 = P - 2
SE = sqrt(sev1 / sev3)

UB = LR + (SE * MF)
BB = LR - (SE * MF)

topline = UB - LR
bottomline = LR - BB
gap = topline + bottomline
closelineW = ((close - bb) / gap) * 100

timeframe(default)
AR2 = close
N2 = barindex
LR2 = Average[SDEG](linearregression[P](AR2))

bv12 = summation[P](N2*AR2) - (P*Average[P](N2)*Average[P](AR2))
bv22 = summation[P](square(N2)) - (P*square(Average[P](N2)))
CalcB2 = bv12 / bv22

CalcA2 = Average[P](AR2) - (CalcB2*Average[P](N2))

sev12 = Summation[P](square(AR2)) - (CalcA2*Summation[P](AR2)) - (CalcB2*Summation[P](N2*AR2))
sev32 = P - 2
SE2 = sqrt(sev12 / sev32)

UB2 = LR2 + (SE2 * MF)
BB2 = LR2 - (SE2 * MF)

topline2 = UB2 - LR2
bottomline2 = LR2 - BB2
gap2 = topline2 + bottomline2
closelineD = ((close - bb2) / gap2) * 100

if average[20] = -100 then
buy at market
endif

graph close
graph closelinew coloured(0,128,0)
graph closelined coloured(0,0,255)
@nicolas,
I’m already on MTF with EOD account… I whant to have it with IG demo accounts to test live ASAP!!
Cristiano
I corrected a typo in my above post as I missed a ‘2’ off but it still errors out.
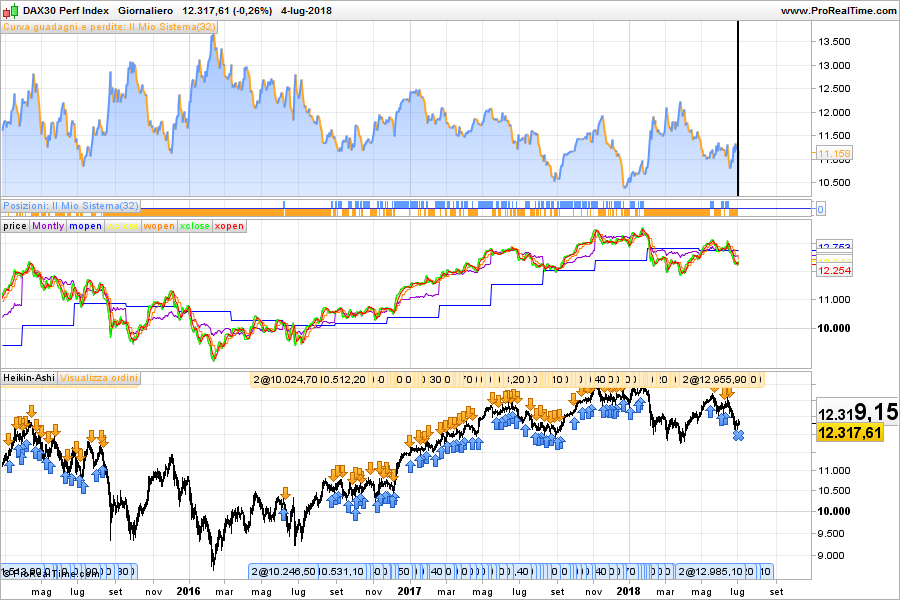
My very small contribution ….
defparam cumulateorders=false


//
timeframe(60days)
If barindex=0 Then
mclose = Totalprice
mopen = Open
//xhigh = High
//xlow = Low
Else
mclose = Totalprice
mopen = (mopen[1]+mclose[1])/2
//xhigh = Max(Max(High, xopen), xclose)
//xlow = Min(Min(Low, xopen), xclose)
Endif

timeframe(3days)
If barindex=0 Then
wclose = Totalprice
wopen = Open
//xhigh = High
//xlow = Low
Else
wclose = Totalprice
wopen = (wopen[1]+wclose[1])/2
//xhigh = Max(Max(High, xopen), xclose)
//xlow = Min(Min(Low, xopen), xclose)
Endif

//
timeframe(default)
If barindex=0 Then
xclose = Totalprice
xopen = Open
//xhigh = High
//xlow = Low
Else
xclose = Totalprice
xopen = (xopen[1]+xclose[1])/2
//xhigh = Max(Max(High, xopen), xclose)
//xlow = Min(Min(Low, xopen), xclose)
Endif
//
if xclose crosses over xopen and mclose>mopen then
buy at market
endif
if xclose crosses under xopen then
sellshort at market
endif

graph xclose as "price"
graph mclose coloured(148,0,211) as "Montly"
graph mopen coloured(0,0,255)
graph wclose coloured(255,255,0)
graph wopen coloured(255,127,0)
graph xclose coloured(0,255,0)
graph xopen coloured(255,0,0)
Cristiano
@Vonasi
What is your default timeframe please? and what instrument? Doesn’t has any error but the code is still in starting loop since minutes in backtest..