Hi, I would like to get my hands on a indicator which display candles with 50% or lower bodys. Does anyone know or would like to help me build one?
Thank you for reply!
Best!
This piece of code does what you want, displaying a green dot below each candle that meets your requirements:
DEFPARAM CalculateOnLastBars = 500  //just to speed up things
R=0
G=255
B=0
F=255
IF close > open THEN
   UpperShadow = high - close
   LowerShadow = open - low
ELSE
   UpperShadow = high - open
   LowerShadow = close - low
ENDIF
Shadows = UpperShadow  + LowerShadow
Body = range - Shadows
IF Body <= (Shadows / 2) THEN
   DotVal = low - (3 / pipsize)
   DRAWTEXT("•",barindex,dotval,Dialog,Bold,12) coloured(R,G,B,F)
ENDIF
RETURN
Sorry but nothing happens, I can load it but no dots. :/
You should add it to the price, not below.
As shown in the pic:
- 1 – click on the PRICE WRENCH in the upper left corner
- 2 – with your cursor on the tag PRICE click on “add indicator”
- 3 – tht’s the outcome
I changed the code to modify display, as follows:
DEFPARAM CalculateOnLastBars = 1000
R=0
G=255
B=0
F=255
IF close > open THEN
   UpperShadow = high - close
   LowerShadow = open - low
ELSE
   UpperShadow = high - open
   LowerShadow = close - low
ENDIF
Shadows = UpperShadow  + LowerShadow
Body = range - Shadows
IF Body <= (Shadows / 2) THEN
   DotVal = low - (100 * pipsize)
   DRAWTEXT("•",barindex,DotVal,Dialog,Bold,12) coloured(R,G,B,F)
ENDIF
RETURN
I attach the code so that you can import it, if you don’t want to copy and paste it.
Oh I see! Thank you very much! You are a very kind person!
Sorry, but it seems that that the dots does not work properly, see attache picture. some candles tdont get the dots even if its a 50% candle. It seems that the higher timeframe, it miss more.
My pic was on GbpJpy monthly chart and it works, I also tried it on DAX both 1 hr and monthly and it displays correctly all candles whose body is less than 50% of their range.
You may try to modify this part of line 16:
(100 * pipsize)
replacing 100 with 10. This should not affect computations but only the place where dots are displayed.
This pic is from DAX weekly, do you get different than mine?
Indeed it’s somewhat odd!
I wrote this strategy (on DAX weekly chart) to debug the values of variables:
DEFPARAM CumulateOrders = false

IF close > open THEN
   UpperShadow = high - close
   LowerShadow = open - low
ELSE
   UpperShadow = high - open
   LowerShadow = close - low
ENDIF
Shadows = UpperShadow  + LowerShadow
Body = range - Shadows
//IF Body <= (Range / 2) THEN
//DotVal = low - (20 * pipsize)
//ENDIF
IF close < 0 THEN  //useless, it is compulsory to have at least one BUY
   BUY AT MARKET
ENDIF
GRAPH UpperShadow           AS "uSH"
GRAPH LowerShadow           AS "lSH"
GRAPH Shadows               AS "Shs"
GRAPH Body                  AS "Bdy"
//GRAPH Body <= (Shadows / 2) AS "%"
//GRAPH DotVal                AS "Dot"
GRAPH Range                 AS "rng"
the attached pic shows that variable “rng” (range) retains a value of 277.5, while the ProOrder box on the chart says the distance High-Low is 280.2!
I don’t know why, I hope someone can help spot the bug!
 AVT
AVTParticipant
Senior
We had an issue with the weekly drawing position being – if I recall correctly – 1 candle too much right-sided (although calculation values are correct)
robertogozzi
sir need Basing Candle Indicator for mt4 please code for it
in above post Dot shows for Basing candle , sir i need blue colur for basing candle instead of Dot …
plz check attachment ….like this i need
robertogozzi
sir need Basing Candle Indicator for mt4 please code for it
in above post Dot shows for Basing candle , sir i need blue colur for basing candle instead of Dot …
plz check attachment ….like this i need
Please update your country flag! Thank you.
Only conversions TO ProRealTime are possible, as from this link https://www.prorealcode.com/topic/free-conversion-mt4-indicators-mql4/.
If you meant to change my code so that it mirrors your screenshot, there you go:
DEFPARAM CalculateOnLastBars = 1000
UpperShadow = high - max(close,open)
LowerShadow = min(close,open) - low
Shadows     = UpperShadow  + LowerShadow
Body        = range - Shadows
IF Body <= (Shadows / 2) THEN
   DRAWCANDLE(open,high,low,close) COLOURED(255,215,0,255) BORDERCOLOR(255,0,255,255)
ENDIF
RETURN
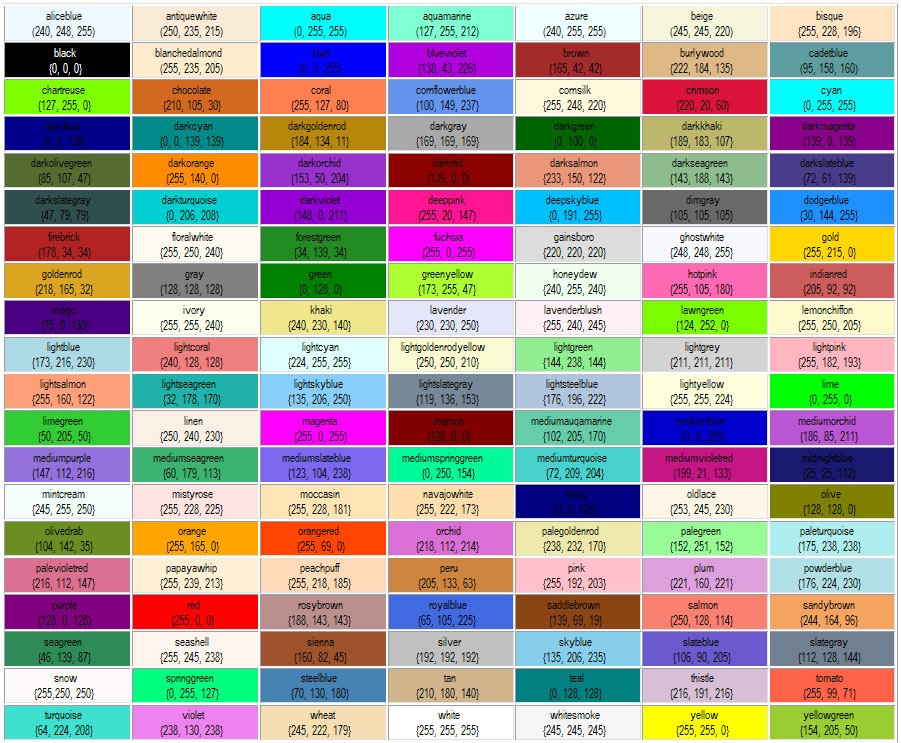
You can choose different colours https://www.prorealcode.com/wp-content/uploads/2015/09/P1jHlnG.jpg.
Robbert
sir how to make it indicator for mt4 , i don’t know how can , please make it for me and send to my mail [deleted]
thanks…..
Robbert
sir how to make it indicator for mt4 , i don’t know how can , please make it for me and send to my mail
thanks…..
You need to go to an MT4 forum site and ask someone there to convert it.
This is a Pro Real Time forum where you can get code converted from MT4 to PRT but not the other way around.
You have repeatedly asked for the same thing which is making us despair a little. Please stop asking.
Also it is not wise to post email addresses on forums so I have deleted it for you.

