Hi All,
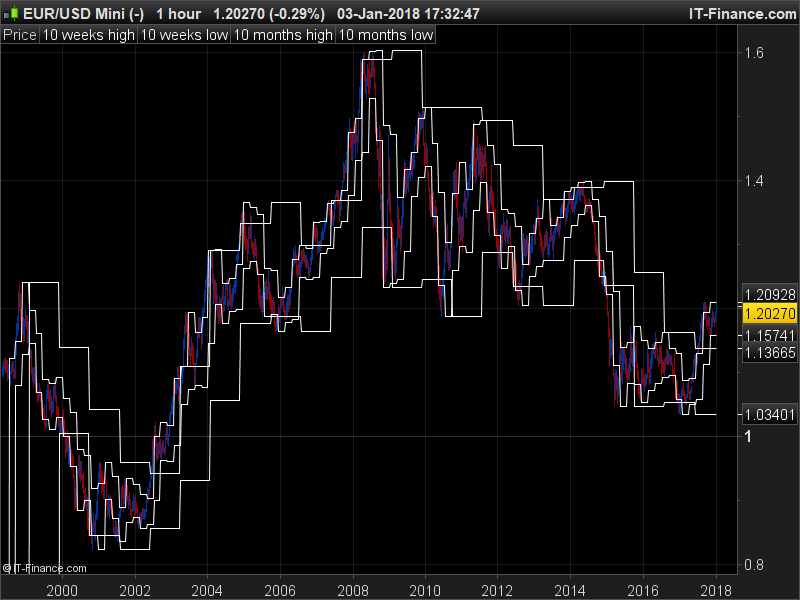
I came across Paul Langham’s channel on You tube and in it he mentioned an indicator than draws in lines which he says the banks ‘trade’ at (I.e they often make a move at).
Basically it seems to consist of the highs and lows for the last :-
10 weeks
10 Months
10 Quarters
10 Years
I am not a coder which can be seen from my daily level effort which I have attached.
x = i
for i = 1 to 10 do
next

a = DHigh(x)
b = DLow(x)

DRAWHLINE(a)
DRAWHLINE(b)

return
It doesnt seem to work as intended :o(
Can someone give me some direction? I tried to substitue Dhigh for Month[high] and it said it expected a positive value?
Regards
BN
I just made this rough code for this purpose, it only calculates the last 10 weeks and 10 months highest high and lowest low, not tested but should be ok.
I’ll try to add the other levels later, time to rest a bit now 🙂
Once lastWeekBarIndex = 0
Once weeklyHigh = undefined
Once weeklyLow = undefined

Once lastMonthBarIndex = 0
Once monthlyHigh = undefined
Once monthlyLow = undefined

If DayOfWeek<DayOfWeek[1] then
countw=countw+1
weeklyHigh = Highest[BarIndex - lastWeekBarIndex](High)[1]
weeklyLow = Lowest[BarIndex - lastWeekBarIndex](Low)[1]
lastWeekBarIndex = BarIndex

hhw=max(hhw,weeklyhigh)
llw=min(llw,weeklylow)

if countw=10 then
weeks10hi = hhw
weeks10lo = llw
hhw = 0
llw = close*1000
countw = 0
endif
Endif

If Month<>Month[1] then
countm=countm+1
monthlyHigh = Highest[BarIndex - lastMonthBarIndex](High)[1]
monthlyLow = Lowest[BarIndex - lastMonthBarIndex](Low)[1]
lastMonthBarIndex = BarIndex

hhm=max(hhm,monthlyhigh)
llm=min(llm,monthlylow)

if countm=10 then
months10hi = hhm
months10lo = llm
hhm = 0
llm = close*1000
countm=0
endif
Endif


Return weeks10hi as "10 weeks high", weeks10lo as "10 weeks low", months10hi as "10 months high", months10lo as "10 months low"
Cheers Nicolas,
I will have a play around with it when I get in tonight
how do i use the code? copy paste in mt4 ? also how to code for yearly and quaterly
how do i use the code? copy paste in mt4 ? also how to code for yearly and quaterly
The code is for use with ProRealTime only. This is a forum dedicated to ProRealTime code – it is not a place to find MQ4 code solutions.
Hello Nicolas,
I am also interested in this indicator,I tried to install it but it does not seem to work,could you test it ?
Thank you,
Jan
Did you add it to the price chart via the wrench in the top left corner?
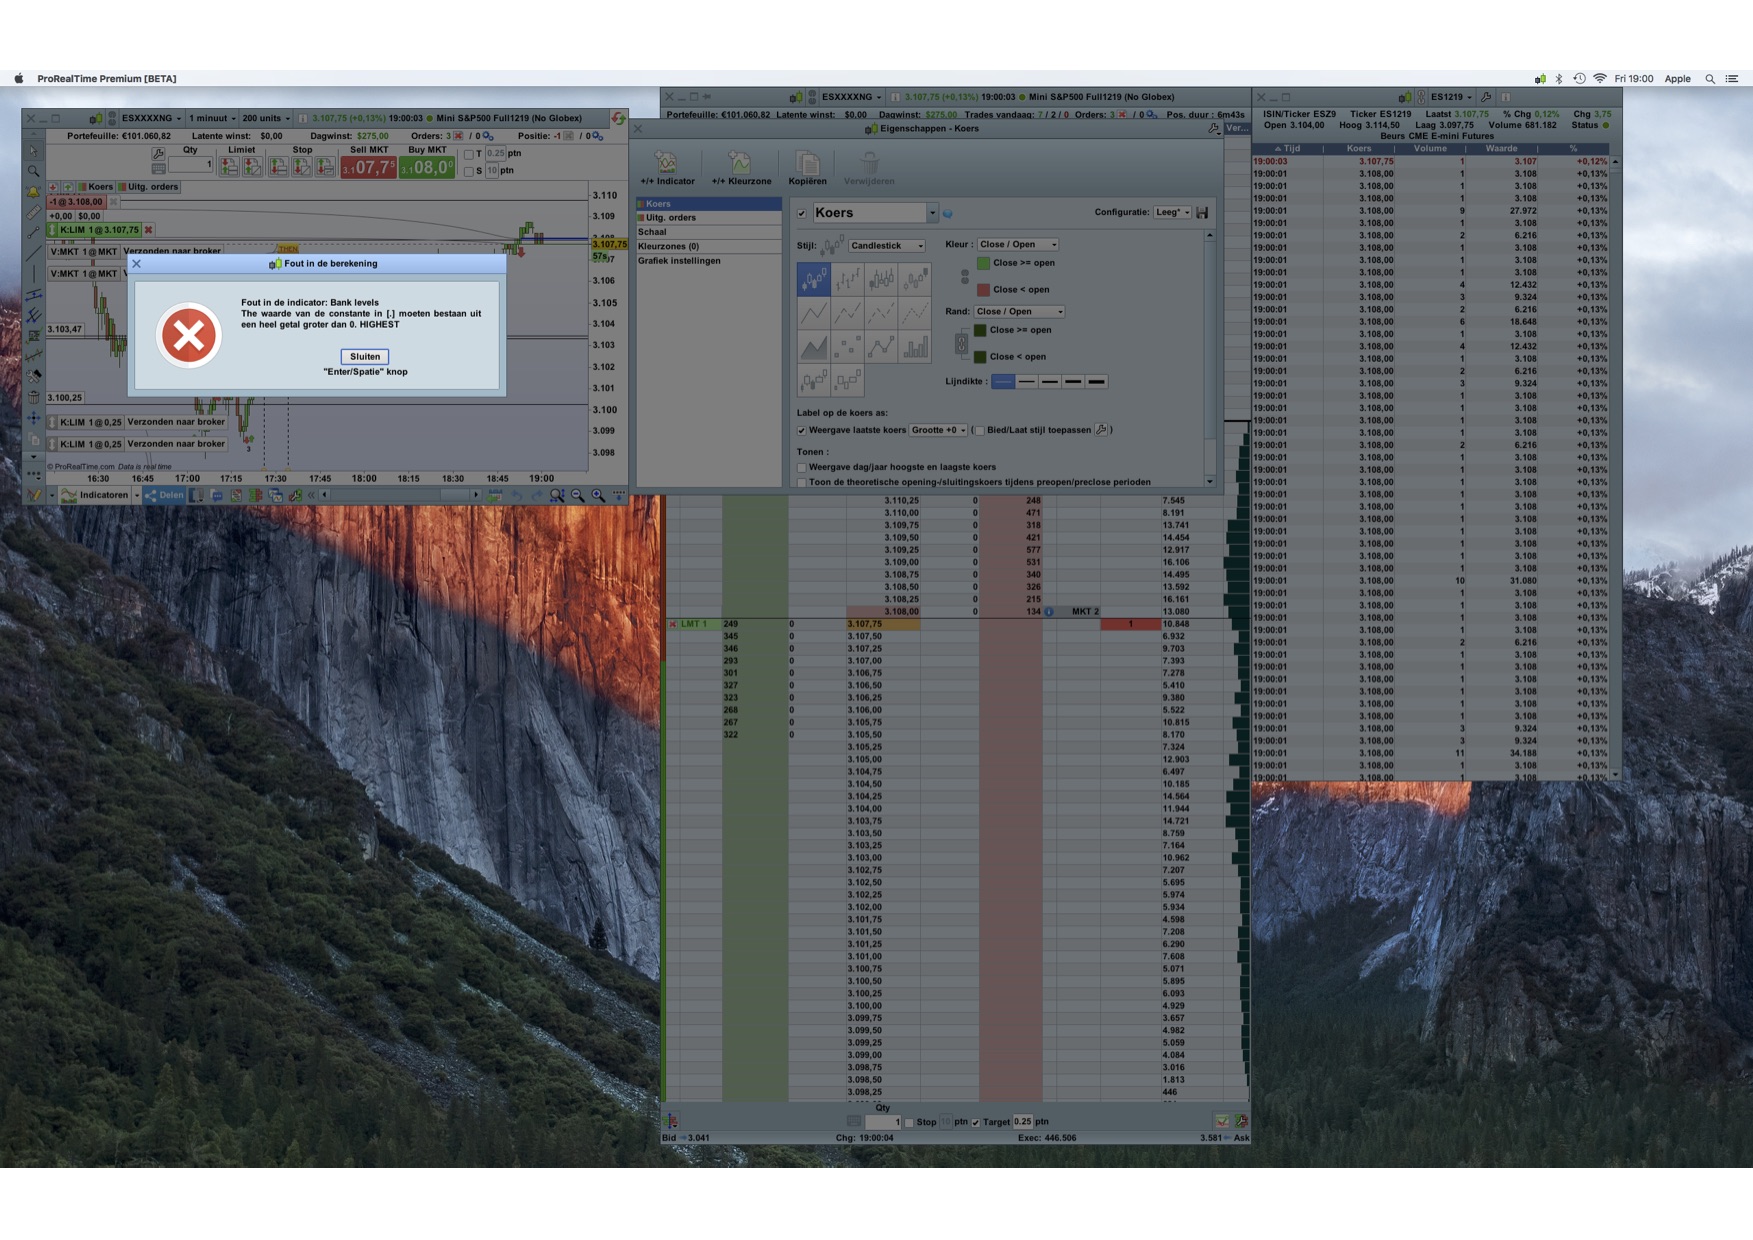
I tried that too but it gives me the same error notice,I attached a screen shot …
Sorry but that screen shot is not clear enough to read. I just cut and pasted Nicolas’ code into a new indicator and it works fine. What instrument and time frame are you applying it to so that everyone else can try to get the same error?
It seems there’s a wrong value within brackets with HIGHEST and LOWEST.
Try using
[max(1,BarIndex - lastWeekBarIndex)]
at lines 11-12, and
[max(1,BarIndex - lastMonthBarIndex)]
at lines 29-30.
Perhaps it is trying to get the values on the first bar of a chart (barindex = 0) so that would create a negative value in the HIGHEST and LOWEST brackets. So you could just enclose the main code within the following IF THEN ENDIF to avoid this:
Once lastWeekBarIndex = 0
Once weeklyHigh = undefined
Once weeklyLow = undefined

Once lastMonthBarIndex = 0
Once monthlyHigh = undefined
Once monthlyLow = undefined

if barindex > 0 then

If DayOfWeek<DayOfWeek[1] then
countw=countw+1
weeklyHigh = Highest[BarIndex - lastWeekBarIndex](High)[1]
weeklyLow = Lowest[BarIndex - lastWeekBarIndex](Low)[1]
lastWeekBarIndex = BarIndex

hhw=max(hhw,weeklyhigh)
llw=min(llw,weeklylow)

if countw=10 then
weeks10hi = hhw
weeks10lo = llw
hhw = 0
llw = close*1000
countw = 0
endif
Endif

If Month<>Month[1] then
countm=countm+1
monthlyHigh = Highest[BarIndex - lastMonthBarIndex](High)[1]
monthlyLow = Lowest[BarIndex - lastMonthBarIndex](Low)[1]
lastMonthBarIndex = BarIndex

hhm=max(hhm,monthlyhigh)
llm=min(llm,monthlylow)

if countm=10 then
months10hi = hhm
months10lo = llm
hhm = 0
llm = close*1000
countm=0
endif
Endif

endif

Return weeks10hi as "10 weeks high", weeks10lo as "10 weeks low", months10hi as "10 months high", months10lo as "10 months low"
Hi
I think there is a lot more to these levels than meets the eye. From my understanding these levels include a number of variables that help to define the level itself, such as, how recent has the level been hit, if the market goes through the level, which would be a negative score, volume or number of transactions at the level, etc. this is based on an indicator I have used on MT4 where this was the case. I think what Paul Langham has developed is similar to the tool, maybe more advanced.
I would love to have such an indicator as it is really helpful in setting up a trade in determining stops and targets. If someone knows how to get this in PRT that would be great.
Toby
Please define the ways to calculate those levels and maybe someone would code it? Math formulas are appreciated, thanks.
Hi, Let me see if I can get the details you need from my source. Many thanks