From what i read in the manuals this happens because trades maybe executed within candles for example that are not shown on the backtesting results.
In this case the manuals will always be way too simple. Also, the people writing the manuals may not be the people who perform actual trading. Or, don’t know how to use the(ir own) tools.
It is all not so simple.
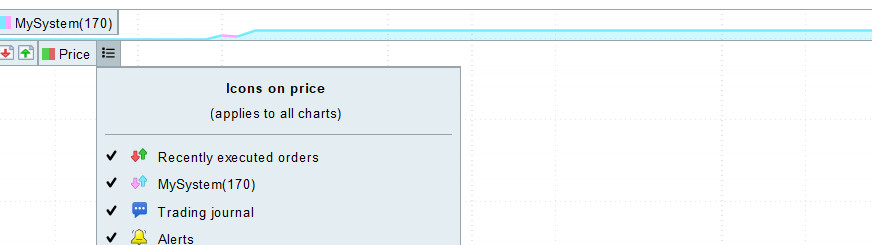
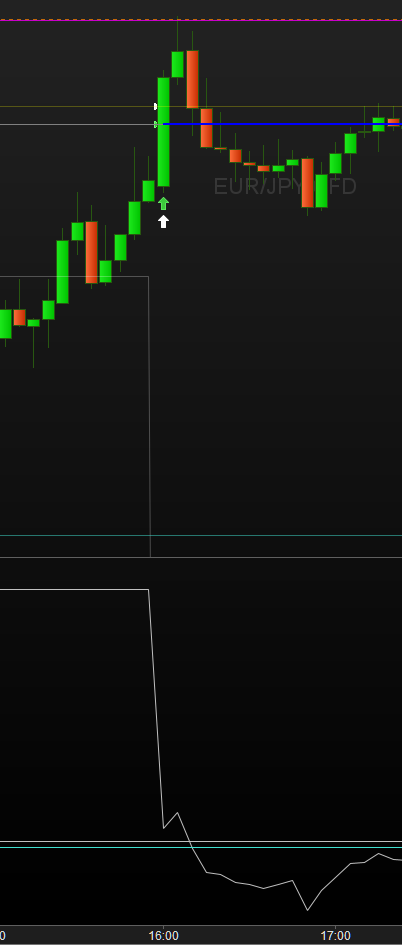
In the first picture below you see – via the green arrow – an entry of a real-live trade on a System I started just before that time. For the example for you, it took me 5 minutes to start the backtesting such that the backtesting arrow would show on the exact same spot. N.b.: Via the small green triangles you would be able to observe the exact same entry price. In this picture quite invisible because overlaid (read : the entry price was exactly the same). BUT : This first entry was a Market order … (they would enter at the same beginning of “a” bar for both (Demo-)Live and Backtest).
Notice that when you don’t align this starting point, you can forget about the remainder being equal – right ? (the whole sequence of trades and results would be different)
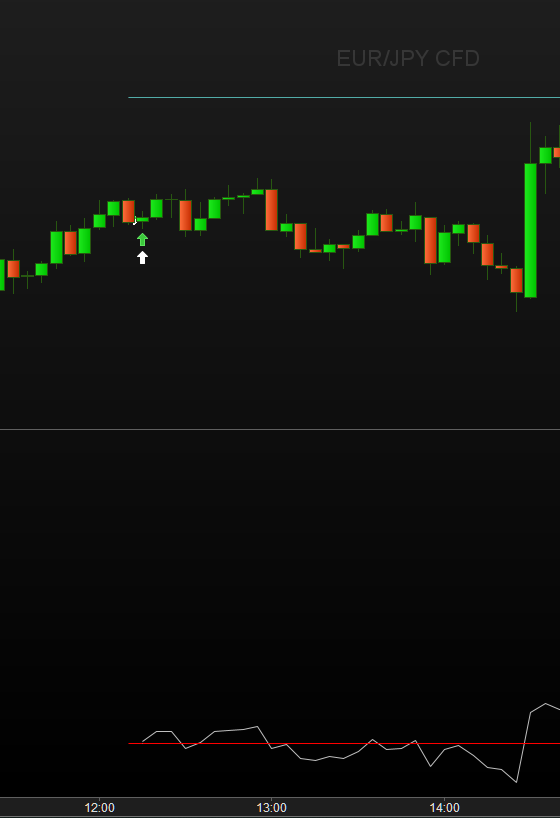
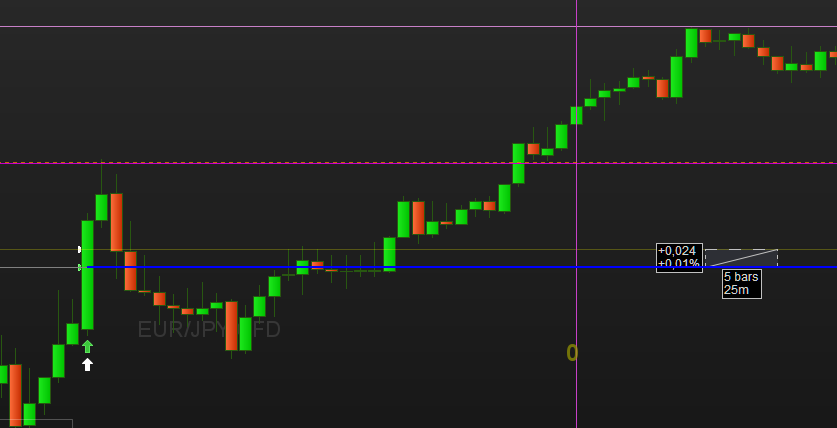
Now the second picture …
This is in the same day (August 15), later. Here again the entry of both is at the exact same time. But careful now, because in this 21 seconds bar the entry is not exactly the same – see the triangles. Also we see that this is in-bar because this entry is being done by a pending order (Stop or Limit). Thus now it completely depends on the price, never mind the size of the bar.
That the entry prices are not 100% equal, is completely normal and to be expected, because the backtest simulates the bid/ask as good as possible, knowing that PRT cannot do that for real. As a matter of fact no platform would be able to, unless you’d have data of bid and ask, which consumes 60GB or so for one day. No platform provides this (it is useless because your backtest would take a year), and while it can be bought (like $1000 for one month for one symbol), it is still useless because it can’t be processed in a workable fashion. It is good for analysis (which is another dimension).
So … the difference in Entry Price is 0,024 JPY. Thus, the backtest bought at a slightly higher price than the Real-Live. This is peanuts hence neglectable.
But is it ?
Maybe not because the exit rules (which are your own) could cause the backtest to go out (the price was met) while the (Demo-)Live just did not reach that price and stays in. It may stay in for dayyys more because the price dropped from then on, and Backtest may have done a dozen more trades with at least a very different outcome.
Assumed this is all understandable, you now see that nothing much is different but the difference you may observe is because of not taking the above into account. I do. And when you do, you will suddenly see that all is actually 100% unless for the situations which are completely normal. They are not to be neglected, but must skipped in your comparison. The solution ? find a moment in the trades that all is synced again (entry is at the same bar again and exits if all is right too).
I have shown a 100+ times that all can be equal – this time I did not do that but showed some explanation to start off instead. And … that your code may be meshed with all sorts of situations to indeed keep all synced is a different story – too large to put in a forum post (or two). One example : if several in-bar trades occur (which just is possible depending on your program code) then the Tick by Tick Mode comes into play (otherwise it does not do a thing – just saying). But to create program code that can deal with this properly – and which starts which challenging this situation to occur, is mighty complicated. But once this in-bar trading occurs *and* you properly dealt with it in the code, all keeps on being synced again.