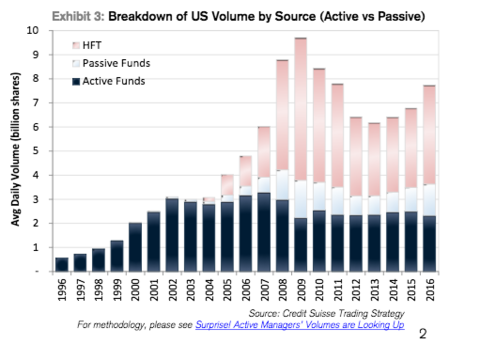
I’ve been trying out some ideas based on weekly charts on major indices recently and had some great results in backtesting (not using tick by tick as with strategies that do not close positions mid candle so tick by tick not needed) – but I kept noticing that around 2004 onwards results became much more consistent resulting in almost straight line equity curves with a fixed position size. So I Googled the history of High Frequency Trading/Algo trading and of course this started in earnest around 2003/2004. So it seems that before this date the markets were an entirely different animal and so it is better to concentrate our backtesting efforts on 2003/2004 to the present day and forget anything before. I’d be interested in others view points on this and what periods others trust for backtesting. Also any general thoughts on auto trading weekly strategies would be of interest to me.
[attachment file=63067]
I think it depends a lot on the sort of strategy that you are backtesting. For example I run a seasonal strategy commodities and have found that the underlying I developed with a lot data (25+ years) are much more robust than the ones I build with only 10 years of data. (with IG we have on some underlying a lot data and other much less) This is probably caused by seasonal strategies have quite few trades (this one of mine trades maybe 8 times per year on average).
So I think that it depends on the sort of strategy how much data you need. Then one has to be cautious that there are really changes to the system that affect our strategies. For example when the USA started to quote prices in decimals and not 1/8th or whatever this was before.
Hi,
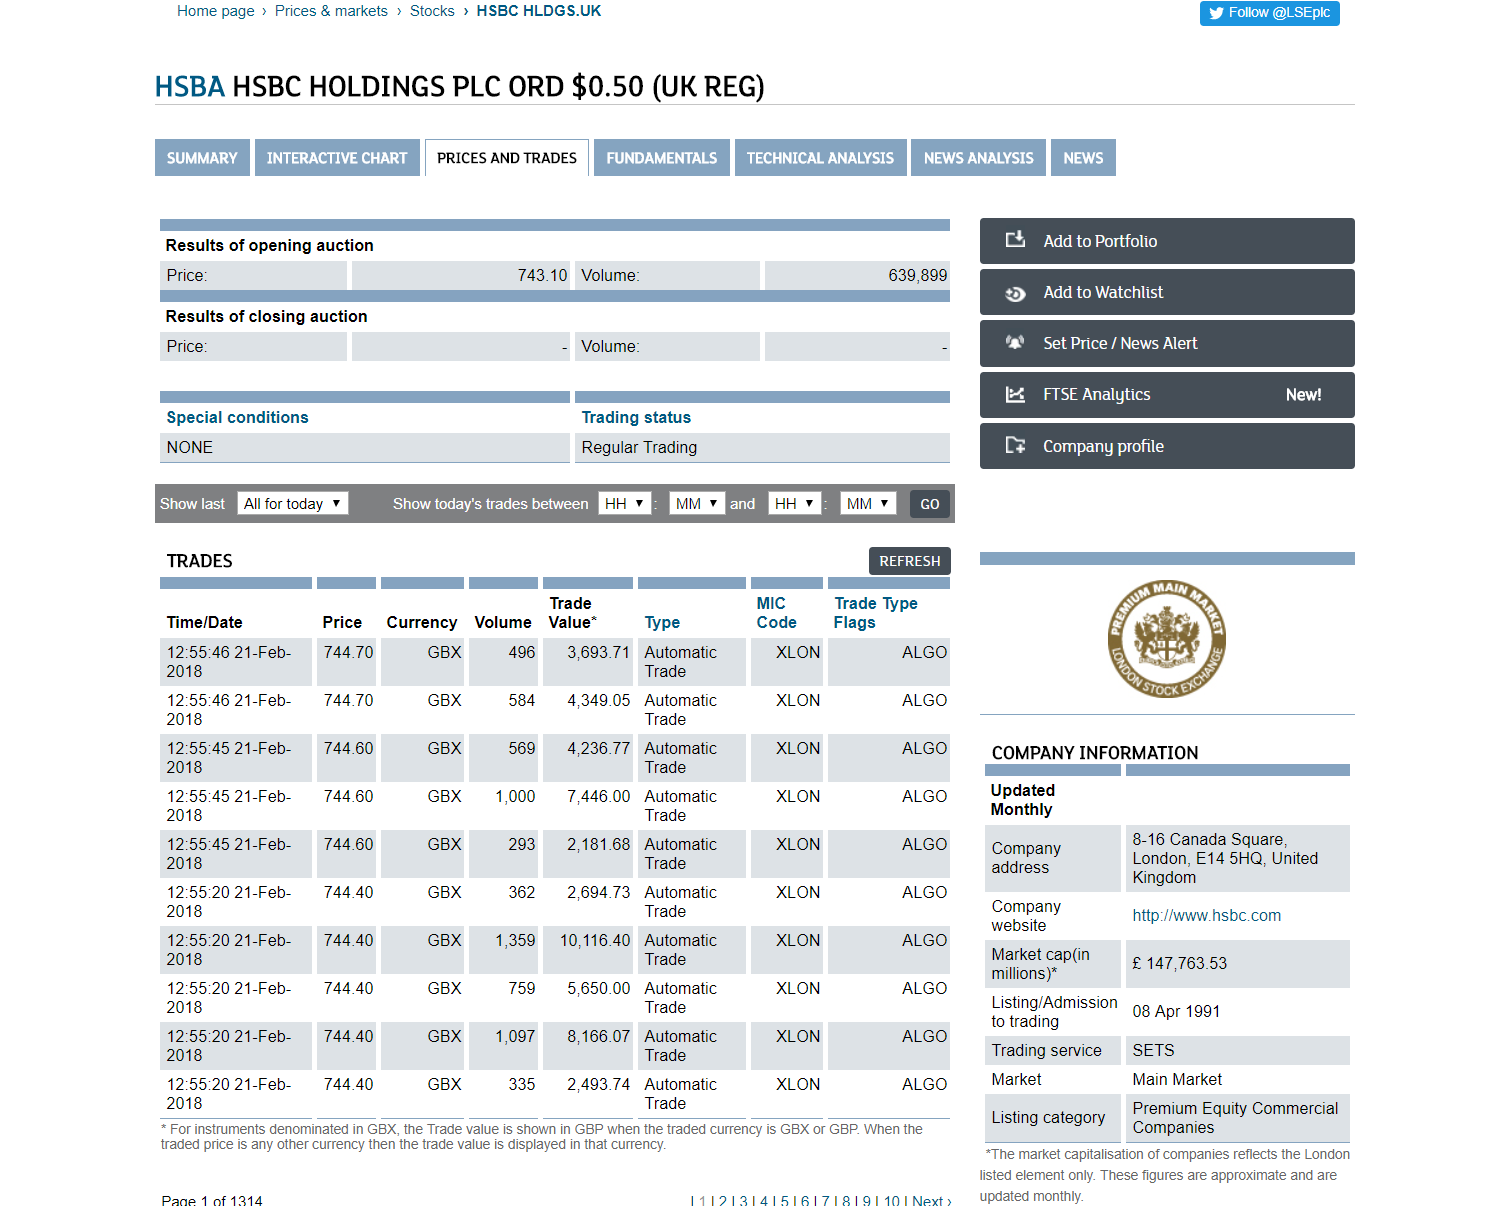
I think your observation and the anecdotal evidence you have provided is definitely on the right track. I worked in the industry and did notice a lot more activity post 2005 from hedge funds in general and specifically Quant strategies and the demand for its personnel. The advent of faster fixed communication lines, processing power and lower latency led to a spurt of HFT funds and strategies and I would regularly observe a bunch of them going round seeking to raise capital (which was quite easy back then). So this ties in with your graphic above. Interestingly the LSE now has a code for indicating which trades are Algo driven which demonstrates how big a part they now play not only in indices and commodities but also underlying equities (see example of HSBC attached, by my rough eyeball calculation 90%+ of all trading in there is Algos but that’s to be expected as it’s a large cap).
My view is that for longer timeframe strategies (weekly/daily), using periods out to 10-15 yrs max is sufficient as market trends are less likely to be overly influenced by the existence or participation of HFT’s which focus more on the shorter term. Also this generally would include a period of recession which is always crucial when testing. Anything older and the dynamics of the market have moved so much in various asset classes over that period (eg. contango trades in Oil, explosion in commodities and derivative trading volume, even underlying sectors and constituents of indices themselves etc) that it’s less likely that the trends you observe then would still be applicable and any inefficiencies present back then would be harder to exploit ongoing in a strategy.
I have tested out a few weekly strategies in the past, I’ll dig some out to see if any of them are useful.
Thanks for your replies.
My ‘hunch’ was that since algo trading really took off the markets have become very different beasts to the time prior to that. Algo trading has allowed more trades and faster decision making and I guess more and more computers are doing the same things. There are only so many ways to look at price at any one time and only so many indicators to use for the decision making. Basically I guess I am saying that the market was very different when trading was just done by a handful of men in pin striped suits in London working with a piece of paper with a line drawn on it compared to today when every school kid can trade from their bedroom on a laptop – or even on the bus on the way to school! Wow – the world is a different place and yet we try to use the data from the pin striped suit days to test a strategy today.
At the moment I am mainly testing buying indices on pullbacks on longer time frames (weekly) when the market is in a trend – and staying out completely once a disaster loss has occurred (such as would have happened when the GFC hit the markets) and then only returning once a new uptrend is established again. This sort of strategy is difficult to test as walkforward testing struggles if there are large periods not in the market and also trading costs are difficult to calculate in. Accepting large drawdown also seems to be necessary – as is deciding what constitutes a disaster – one man’s disaster is another man’s pullback opportunity!
I’d be interested in any feedback on any of your weekly strategies Manel but I guess as you have to dig them out you are not actually trading them?
Hi – Yes, I don’t have most of them live not because none of them showed promise but for various other reasons such as the need for more demo testing (sometimes I forget to extend the demo validity – annoying that it’s only 30days) , more data analysis and simply in some cases, not enough time as more focus is taken up on shorter tf strategies. But I have it on list to revisit. In the meantime, I came across these short observational statements in my reading today that I think sums up nicely the purpose of this thread and echoes exactly my feelings and delivers it more succintly :
“More data intuitively feels better but things change over time, so more data can add in past trends that tell you nothing about what to expect in the future. If something is rare, the tendency is to go way back in history to gather as many examples as you can. But the further back you go, the more likely you are to study a world that operated in a different paradigm. We can study the financial crisis of 1873, but the modern banking system lives in a totally different universe than it did then.”
“Ask an economist how many recessions they wish they had to study and they’ll say “ten thousand.” But there have only been 11 recessions since we started systematically collecting good data in the 1940s. That is nothing. If we had as much recession data as we wanted we’d likely realize that half of what we think we know about recessions is wrong.”
“The most important events are the hardest to sample, so extrapolating their lessons can be misleading. There have been two world wars in the last century. But no one would say, “the average world war lasts five years,” or “the average world war kills 60 million people.” No forecaster would say we’re overdue for a world war based on historic trends. A sample size of two can’t tell us what to expect next. The point may be obvious with world wars. But use a slightly more common case and people start drawing all kinds of false conclusions. Studying things with inadequate samples causes more delusion than intentional deceit. That’s because the ease of explaining things based on what’s readily in front of you meets the intellectual cover of using statistics.”
I personally think a large sample size of data (>15yrs) is perhaps most important when looking at seasonality driven markets as they add some definitive value to the analysis, the most obvious example being commodities. But for most other markets I would question the use of a larger dataset as it will inevitably lead to false positives that will likely not work in todays markets.
Where ever you got that from it is spot on I think Manel. More data is always a good thing but you have to consider the quality and relevance of that data before basing a strategy on it. As regards seasonality where more data is definitely a good thing it is almost as if you copy and pasted from another thread that Despair said exactly the same on yesterday! 🙂
I am really starting to get more interested in longer time frame strategies at the moment. They require a lot less hours in front of a screen and are a much less stressful trading method. It is nice to trade the bigger picture rather than the noise. The only stress comes from the considerable drawdown that longer time frame strategies inevitably have – but it is a necessary evil that needs to be held on through if profits are to be made. As is the way in life bigger bank balances lead to bigger opportunities and bigger balls let you make the most of them!
Haha I also just noticed that I repeated myself. 🙂 However my most successful strategies all run on daily bars. Much less noise on intraday timeframes.
 ALE
ALEModerator
Master
I use only daily strategies, from 2003 the indexes damage coherent results with today’s market.
This coincides with your observations.