When backtesting in PRT, is it possible to change the scale of the equity curve from total equity to percentage values? Either current equity as a percentage of initial equity, or current equity as the change in percentage of the initial equity.
I’m using PRT v10.3 – 1.8.0_43 in demo mode.
It is not possible to do this within the platform but would be possible to display the % value by adding a simple indicator to the equity curve chart.
Thanks! I guess that’s one way to handle it. Right now I’m thinking of adding some money management code to the trading system so I can start the simulation with any amount of capital and use any percentage of the capital currently on the account at each entry. I’d like to see what happens if use almost 100% of the capital at each entry. Just for the fun of it. 🙂
If anyone knows any nice code snippets I can use for this, pls. share here. So far I’ve found this snippet:
https://www.prorealcode.com/blog/learning/money-management-prorealtime-code/
I can see at least 3 here … may not be exactly what you want, but worth a look?
Snippet Link Library
Thanks! Very nice library. I’m new to PRT programming so I’m not familiar with resources such as this yet. 🙂
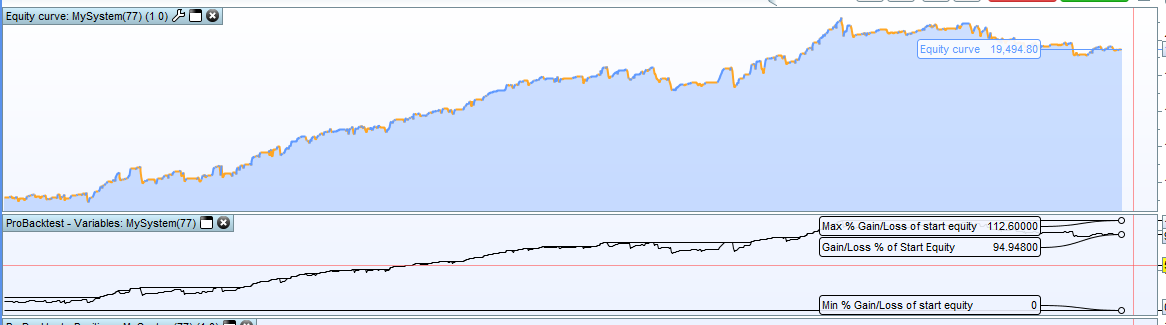
Having tried out the idea it is a little more complicated than it first seems as you would need to run a virtual strategy in the indicator on the equity curve to simulate returns. Far easier is to just add this to the bottom of your strategy and then graph the percentages in their own window. It records the lowest % of start equity in the equity curve as well as the maximum % of start equity along with the running % of start equity.
Change startequity to match your starting capital value.
startequity = 10000
Perc = (strategyprofit / startequity) * 100
maxperc = max(maxperc,perc)
minperc = min(minperc,perc)

graph Perc as "Gain/Loss % of Start Equity"
graph maxperc as "Max % Gain/Loss of start equity"
graph minperc as "Min % Gain/Loss of start equity"
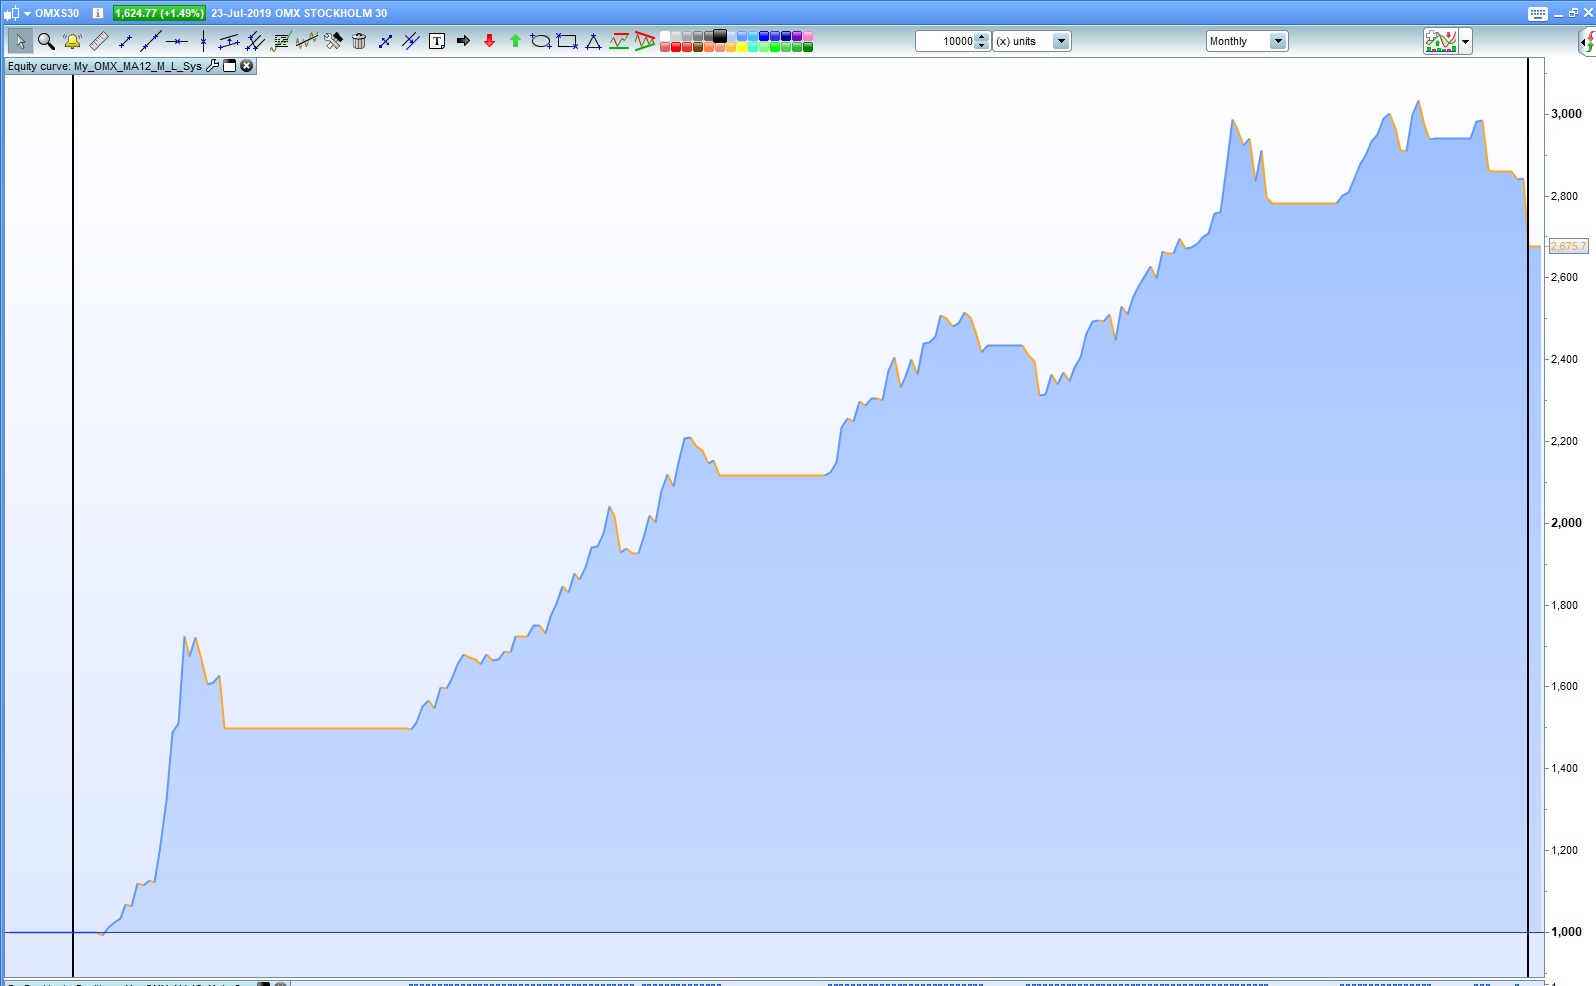
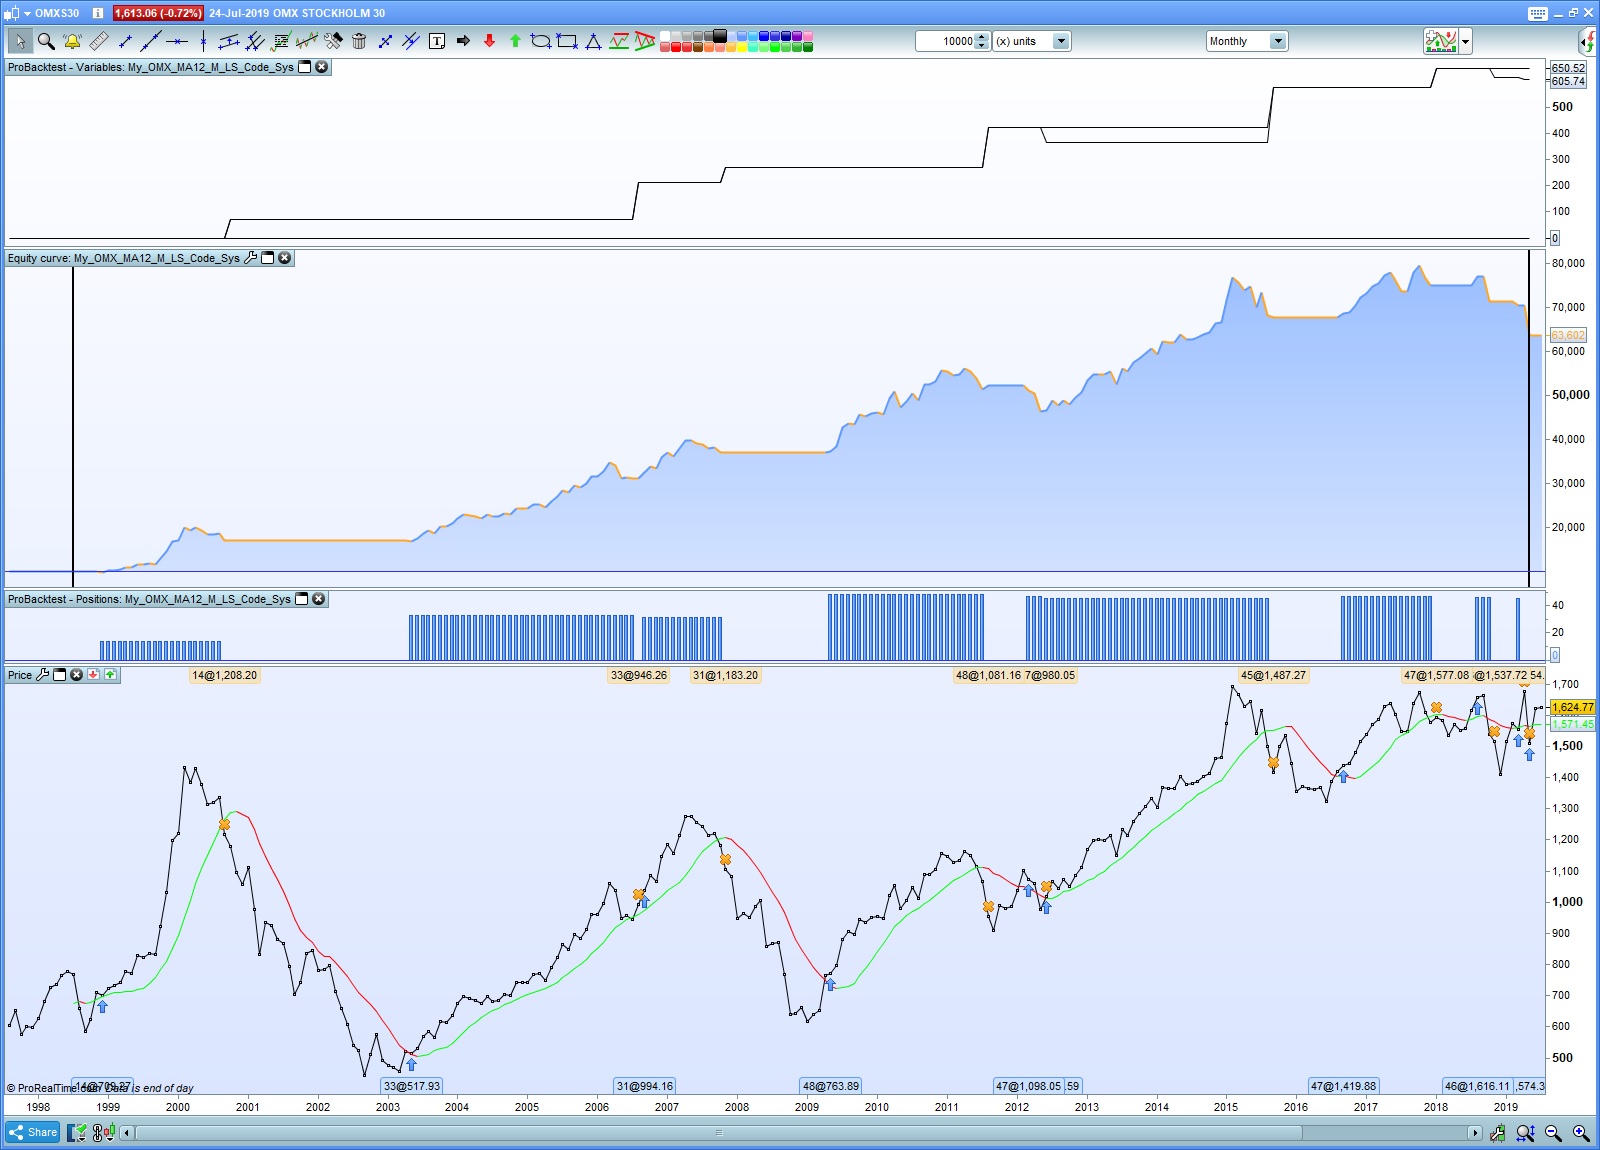
Thanks a lot! I tested to insert your code in the bottom of my strategy. Before that I had also tweaked my code so that I would use the max amount of available capital on the account for each buy. Seems like your code doesn’t change the graph until the sell. I’m not sure why though. I might have to sleep on it to figure out why the curves are different.
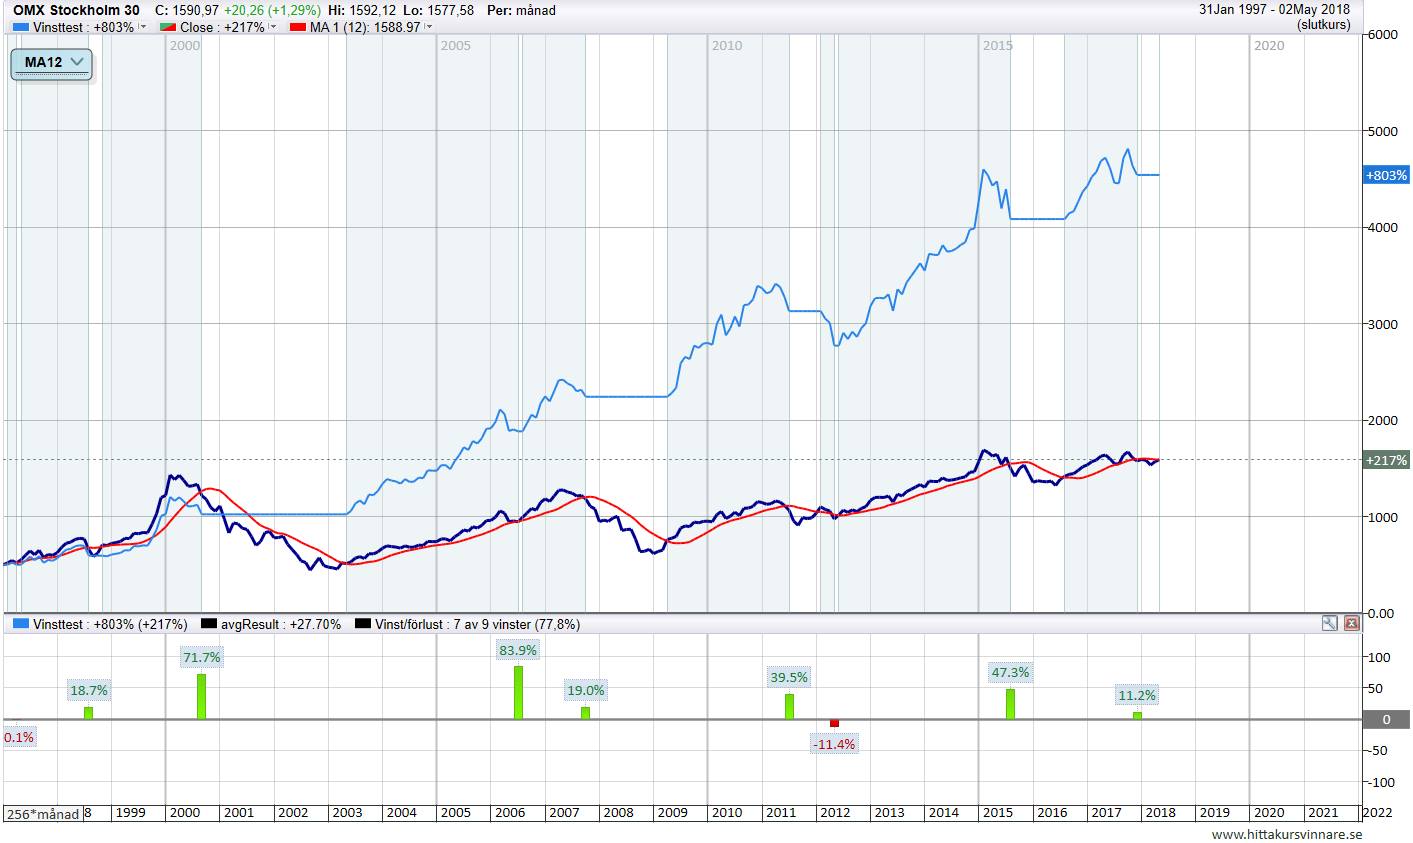
You can see the result in the first figure. What I’m trying to implement is something like you see in the second figure. The two bottom curves are the price development in the stock (actually an index) in percent as well as the MA(12) indicator. The top curve is the development of the account in percent, if I’m fully invested during uptrends and not invested during downtrends.
// Definition of code parameters
DEFPARAM CumulateOrders = False // Cumulating positions deactivated

InitCapital = 10000
Equity = InitCapital + StrategyProfit
NrOfShares = Round(Equity/close - 0.5) // Round down to integer below

// Conditions to enter long positions
indicator1 = Average[12](close)
c1 = (close > indicator1)

IF c1 THEN
BUY NrOfShares SHARES AT MARKET
ENDIF

// Conditions to exit long positions
indicator2 = Average[12](close)
c2 = (close < indicator2)

IF c2 THEN
SELL AT MARKET
ENDIF

// Graph the Gain/Loss % of Start Equity
startequity = 10000
Perc = (strategyprofit / startequity) * 100
maxperc = max(maxperc,perc)
minperc = min(minperc,perc)

graph Perc as "Gain/Loss % of Start Equity"
graph maxperc as "Max % Gain/Loss of start equity"
graph minperc as "Min % Gain/Loss of start equity"
STRATEGYPROFIT is only updated at the close of positions which is why you do not see a live update of the % while a position is open. To achieve this you will need to calculate the difference between CLOSE and POSITIONPRICE whenever you are on the market and add this to STRATEGYPROFIT to get a live value.
It seems that your topic is more ProOrder automatic trading related than platform related. It is not a % on an equity curve that you need but a % in a strategy. I will move the topic to the ProOrder forum for this reason.
Please try to post in the most relevant forum with future topics. 🙂